
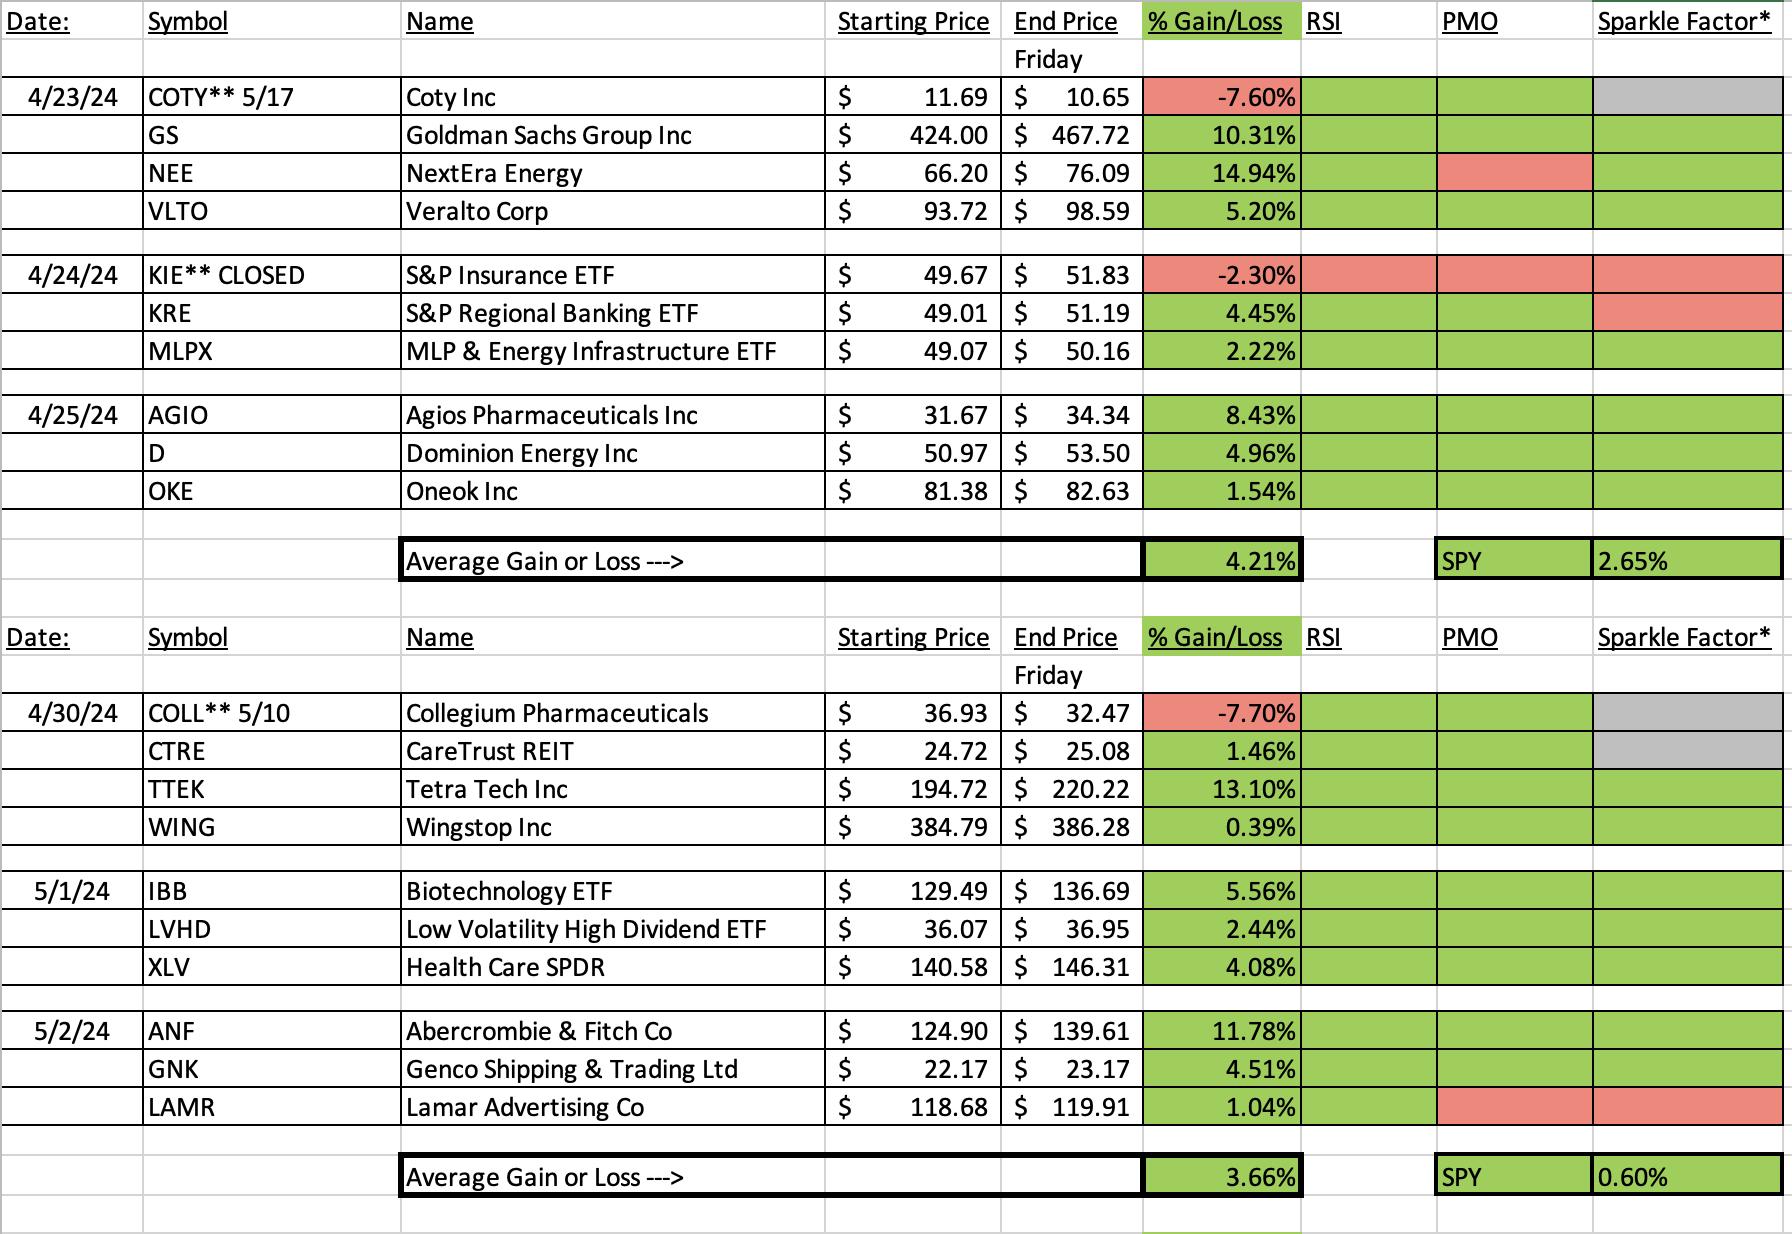
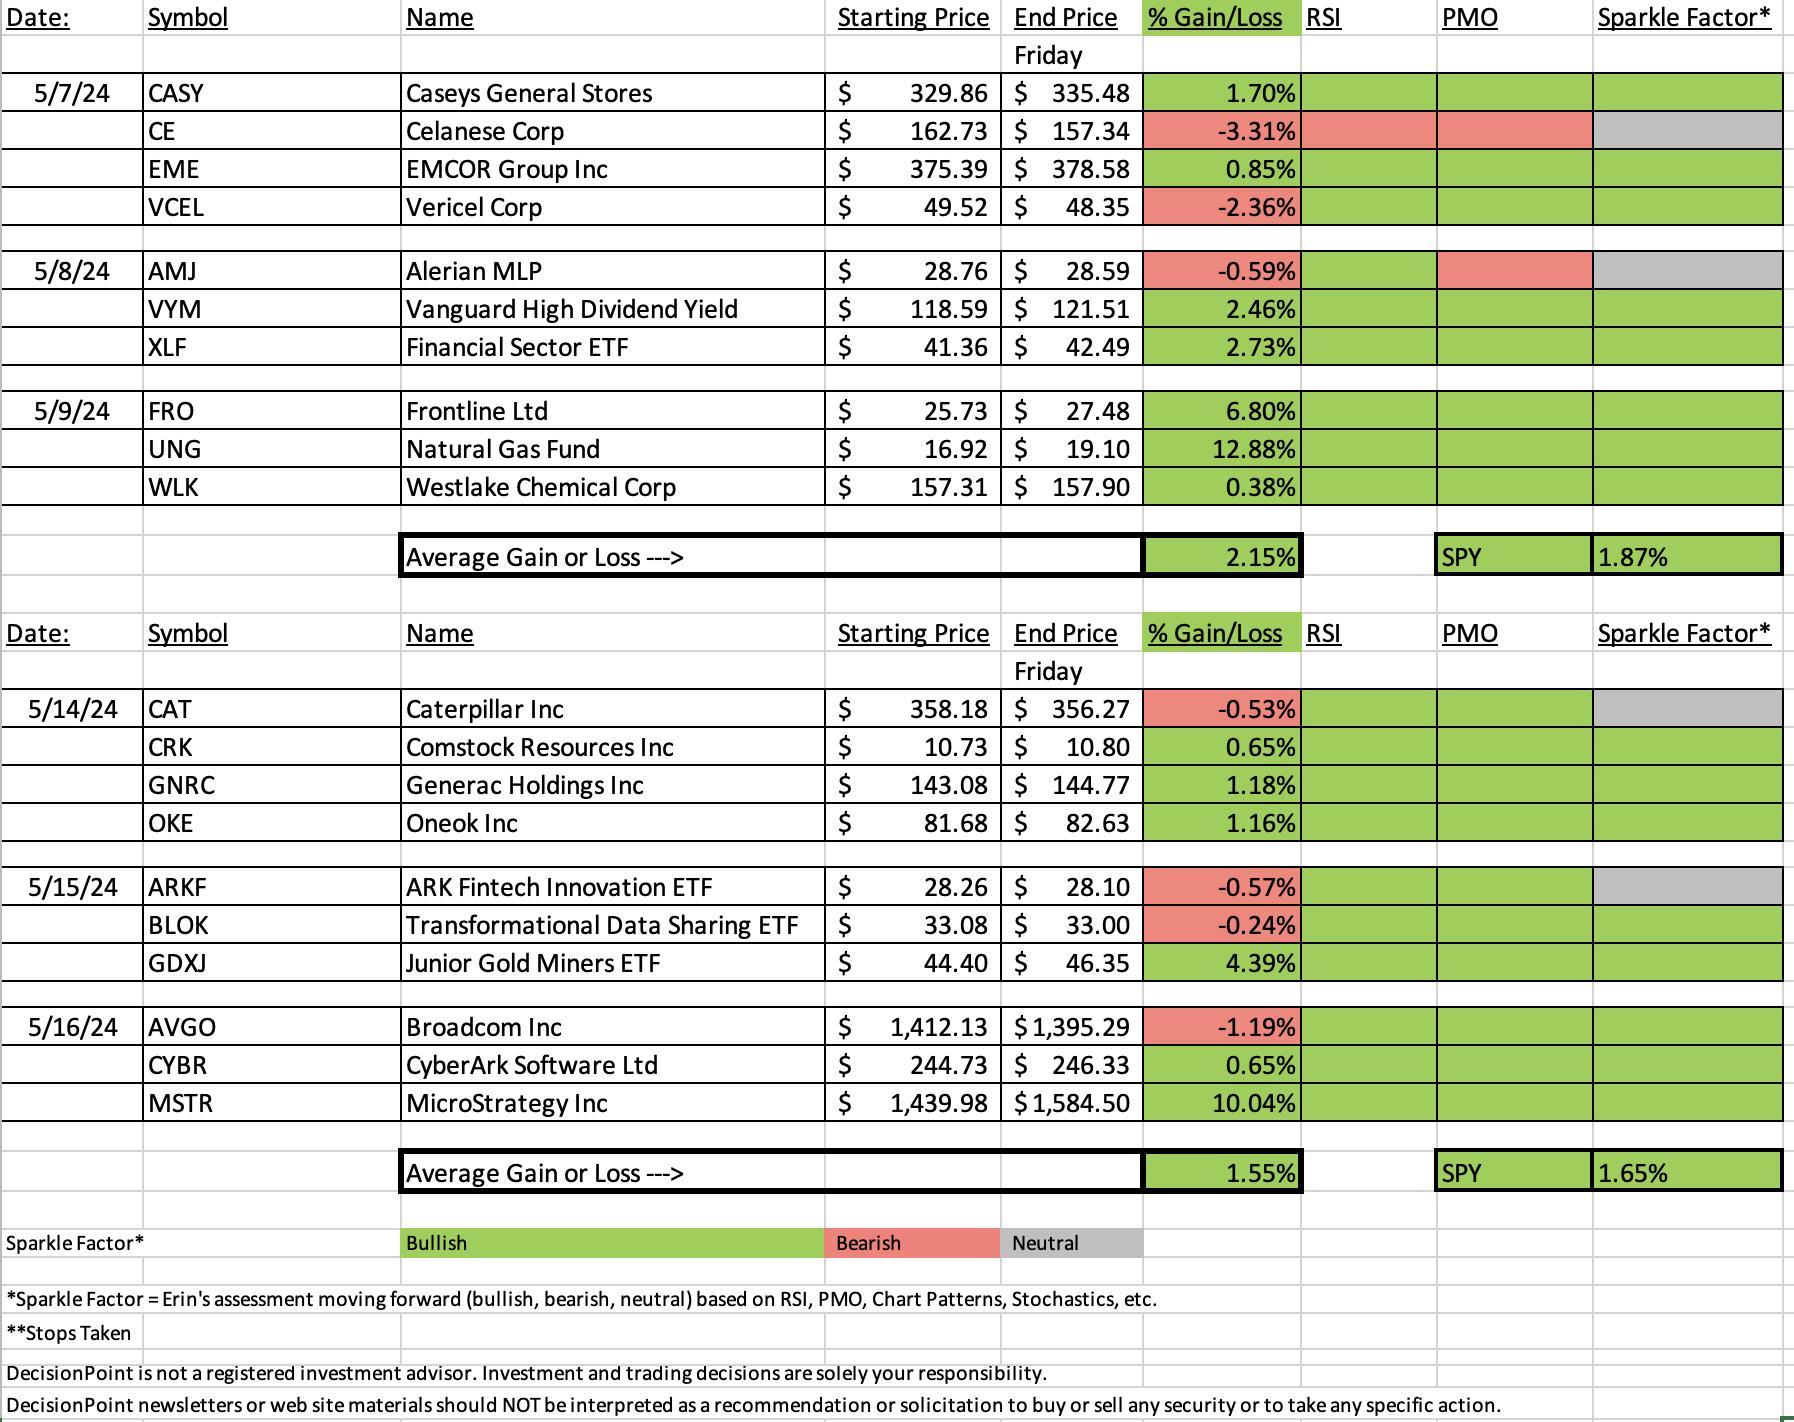
We had a positive finish to the week. I'm especially happy about the maturity of previous "Diamonds in the Rough" which are really beginning to outperform. The spreadsheet is very 'green' right now.
The market continues to make its way higher and admittedly I'd like to be more exposed, but every time I go to add, there is something that prevents it, from overbought charts to market indicator weakness. Be sure to have stops set on your positions.
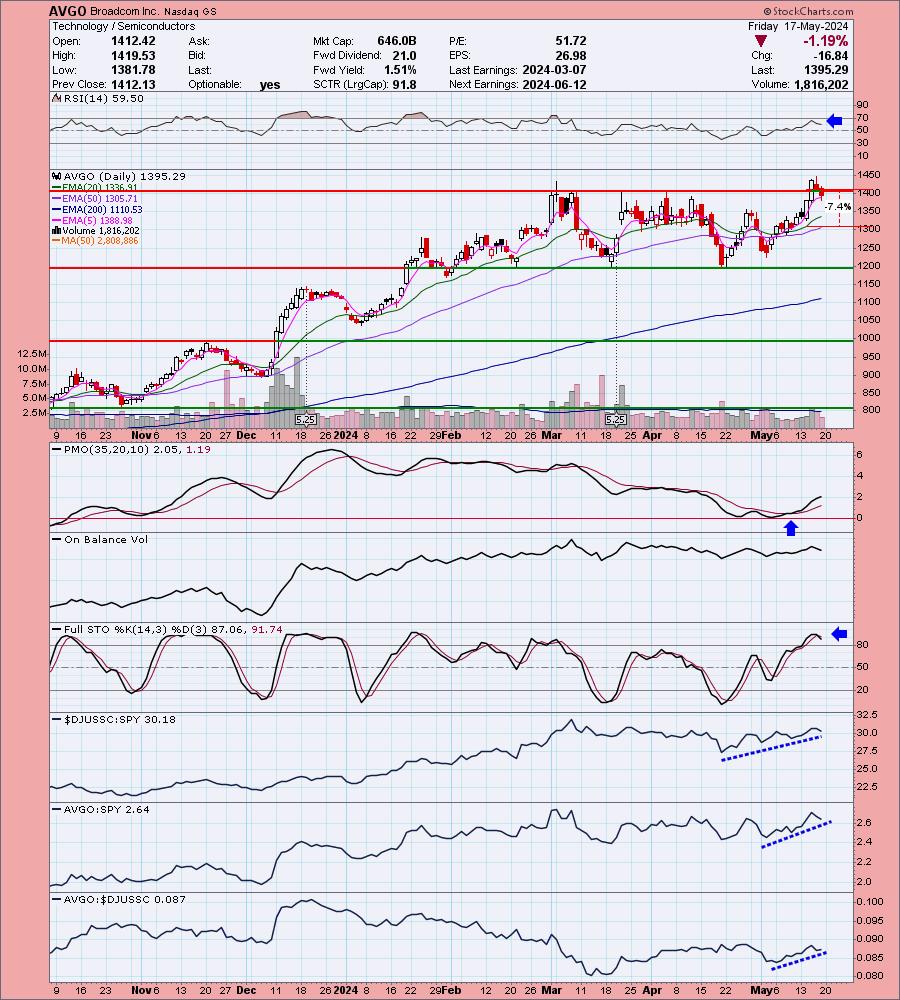
This week's "Darling" turned out to be yesterday's reader request pick MicroStrategy (MSTR). It is quite overbought now, but I have to say I think we could see even more follow through. This week's "Dud" was reader requested Broadcom (AVGO). I've moved that one to a neutral Sparkle Factor meaning I don't think it is ripe for an add. It could be considered a 'hold'. I'll talk more about these later.
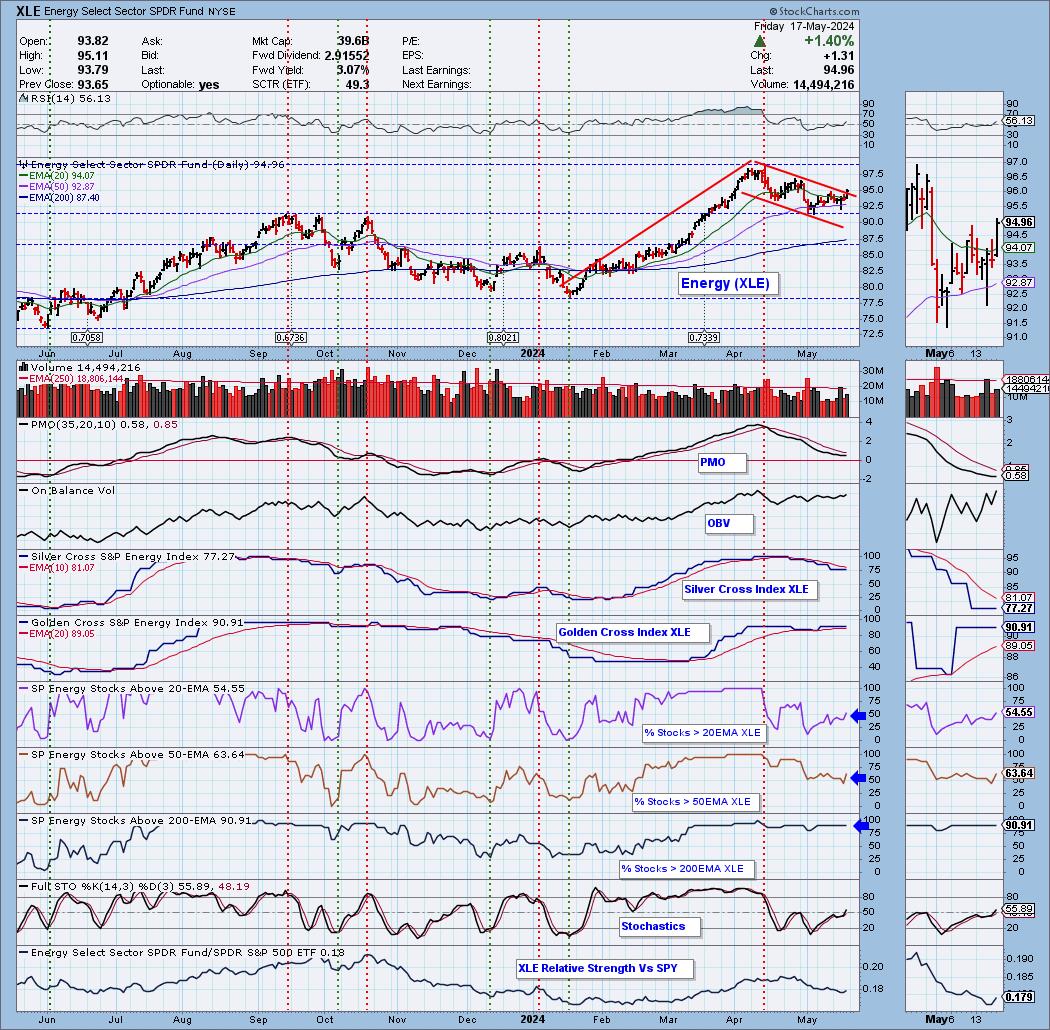
The Sector to Watch is Energy (XLE). The PMO wasn't rising during the trading room this morning, but it has turned up on the close.
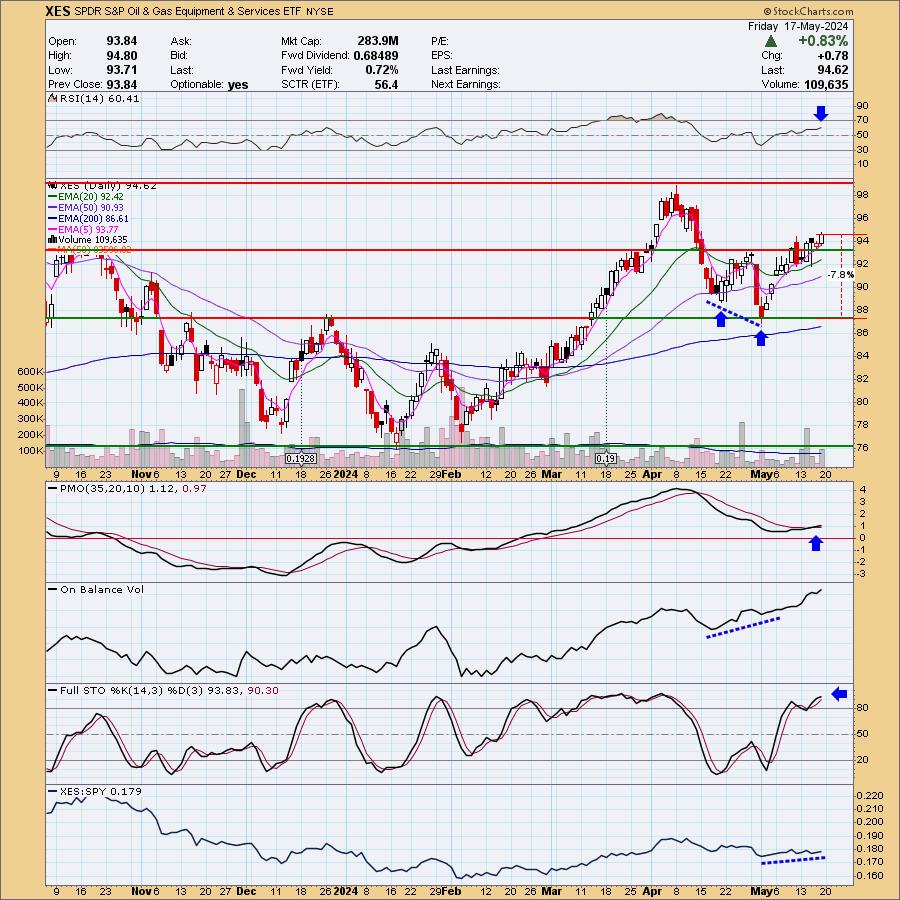
The Industry Group to Watch is Oil Equipment & Services. I have an ETF that is close to this one that I'll present instead of the non-tradable DJUS industry group chart. Symbols of interest from this industry group were: DO, LBRT, VAL and CLB.
We were able to run some scans at the end of the trading room. The PMO Crossover Scan produced the most symbols compared to the other scans: TRGP, VLO, BKR, EXTR and KWR.
Have a great weekend! See you in the free DecisionPoint Trading Room on Monday at Noon ET!
Good Luck & Good Trading,
Erin

RECORDING & DOWNLOAD LINK (5/17/2024):
Topic: DecisionPoint Diamond Mine (5/17/2024) LIVE Trading Room
Download & Recording Link HERE
Passcode: May#17th
REGISTRATION for 5/24/2024:
When: May 24, 2024 09:00 AM Pacific Time (US and Canada)
Topic: DecisionPoint Diamond Mine (5/24/2024) LIVE Trading Room
Register in advance for this webinar HERE.
After registering, you will receive a confirmation email containing information about joining the webinar.

Below is the latest free DecisionPoint Trading Room recording from 5/13. You'll find these recordings posted on Mondays to our DP YouTube Channel. Be sure and subscribe HERE.
A few items about the spreadsheet: I've put on the spreadsheet whether the RSI is positive (green) or negative (red). The PMO column tells you if it is rising (green) or falling (red). Finally I've added my own "Sparkle Factor" that gives you my assessment going forward, bullish (green), bearish (red) or neutral (gray). The Sparkle Factor is basically my thoughts on whether I expect it to rise or fall. A neutral means it could really go either way so it could be added to a watch list. If you're in a stock I consider "neutral" going forward, the ball is in your court.
Darling:
MicroStrategy Inc. (MSTR)
EARNINGS: 07/30/2024 (AMC)
MicroStrategy, Inc. engages in the provision of enterprise analytics and mobility software. The firm designs, develops, markets, and sells software platforms through licensing arrangements and cloud-based subscriptions and related services. Its product packages include Hyper. The company was founded by Michael J. Saylor and Sanjeev K. Bansal on November 17, 1989, and is headquartered in Vienna, VA.
Predefined Scans Triggered: Bearish Harami.
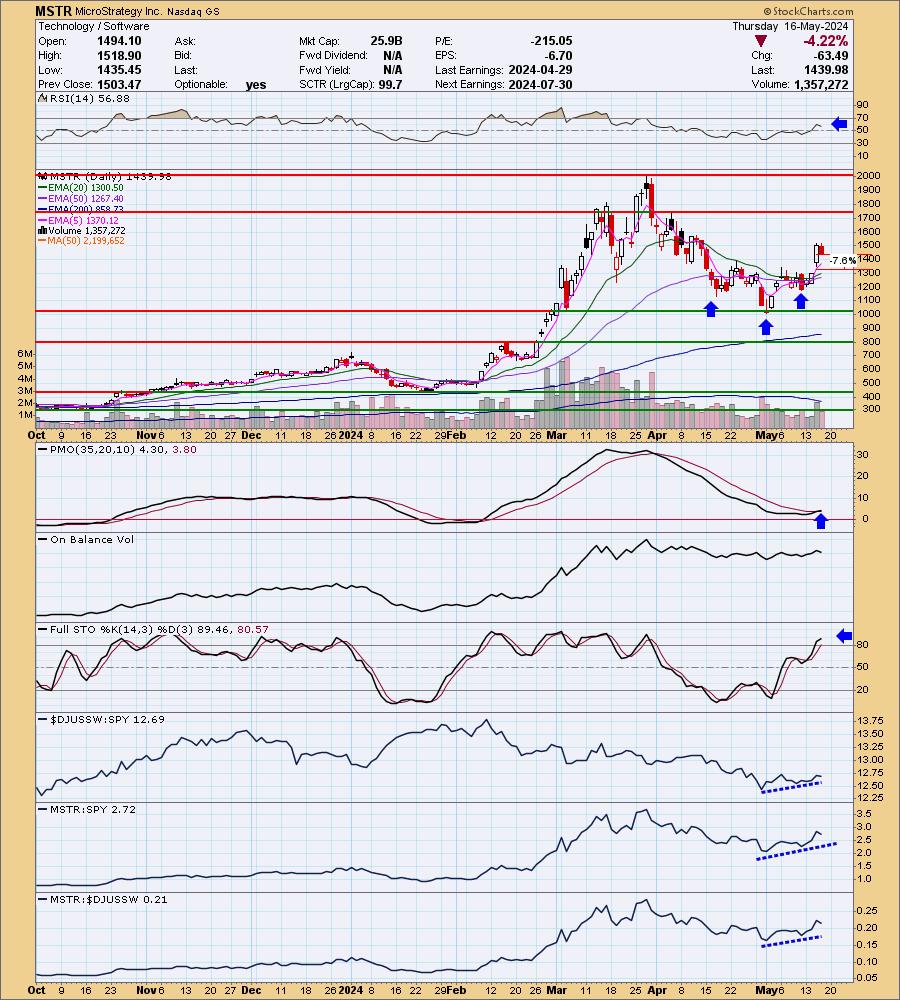
Below are the commentary and chart from Thursday, 5/16:
"MSTR is up +0.51% in after hours trading. The reverse head and shoulders pattern is what immediately caught my eye on this one. We do have a bearish harami candlestick today, but given its up in after hours trading, I don't think there is a problem. Today's decline does make it interesting for an add here. It basically broke out and then pulled back to the breakout point which I find bullish. The RSI is positive and not overbought. There is a brand new PMO Crossover BUY Signal. Stochastics are rising above 80. Relative strength lines are all rising. The stop is set near the 20-day EMA at 7.6% or $1330.54."
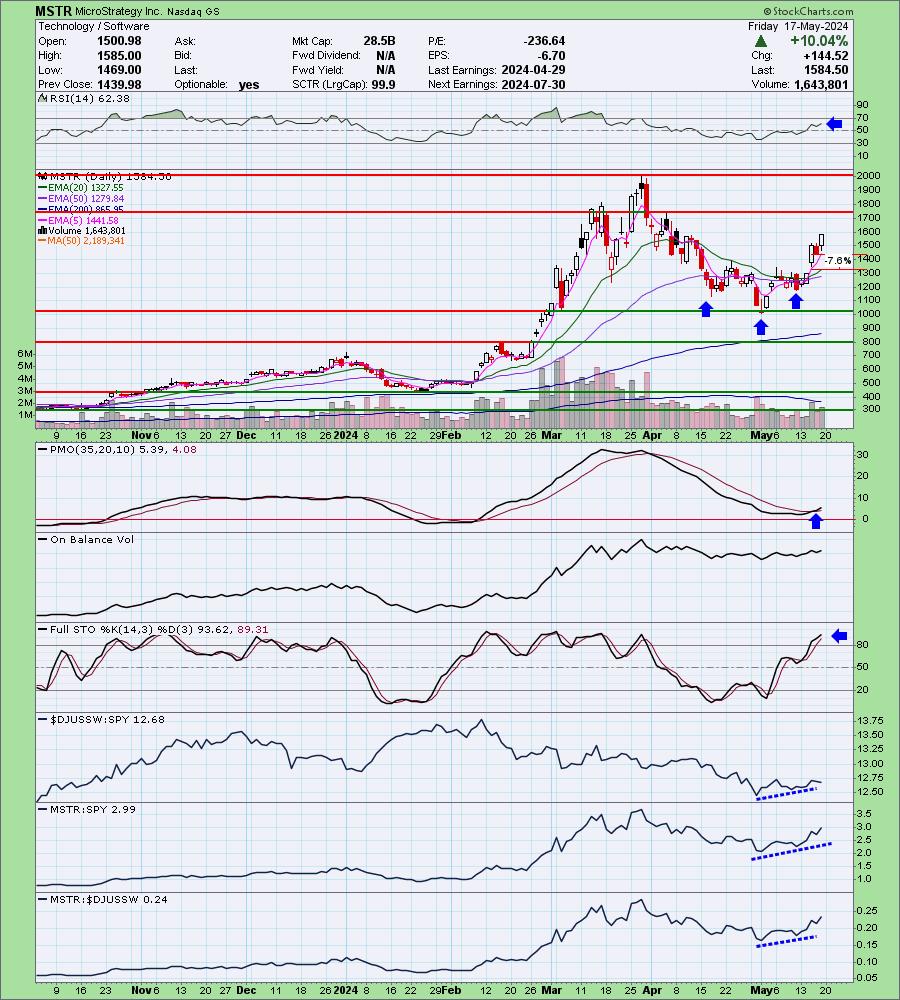
Here is today's chart:
MSTR saw another incredible run today as it was up over 10%. I was asked in the trading room what the minimum upside target was on the reverse head and shoulders. We add the height of the pattern to the neckline. That would put price above the next level of overhead resistance so there is more upside to be had here. Amazingly it isn't overbought. Relative strength is just improving and the PMO Crossover BUY Signal looks good.
Don't forget, on Thursdays I look at reader-requested symbols, so shoot me an email at erin@decisionpoint.com. I read every email I receive and try to answer them all!
Dud:
Broadcom Inc. (AVGO)
EARNINGS: N/A
Broadcom Inc. is a global technology company, which designs, develops, and supplies semiconductors and infrastructure software solutions. It operates through the Semiconductor Solutions and Infrastructure Software segments. The Semiconductor Solutions segment refers to product lines and intellectual property licensing. The Infrastructure Software segment relates to mainframe, distributed and cyber security solutions, and the FC SAN business. The company was founded in 1961 and is headquartered in Palo Alto, CA.
Predefined Scans Triggered: New 52-week Highs, Stocks in a New Uptrend (ADX) and P&F Double Top Breakout.
Below are the commentary and chart from Thursday, 5/16:
"AVGO is down -0.17% in after hours trading. Yesterday saw a breakout to new 52-week highs. It is coming out of a trading range. I have looked at the Semiconductors (SMH) under the hood chart and I like what I see coming from this industry group. You can see that it is already outperforming. The RSI is positive and not overbought and the PMO is rising on a Crossover BUY Signal above the zero line. Stochastics are staying above 80. Relative strength shows AVGO has a leadership role within the group right now. The stop is set near the 50-day EMA at 7.4% or $1307.63."
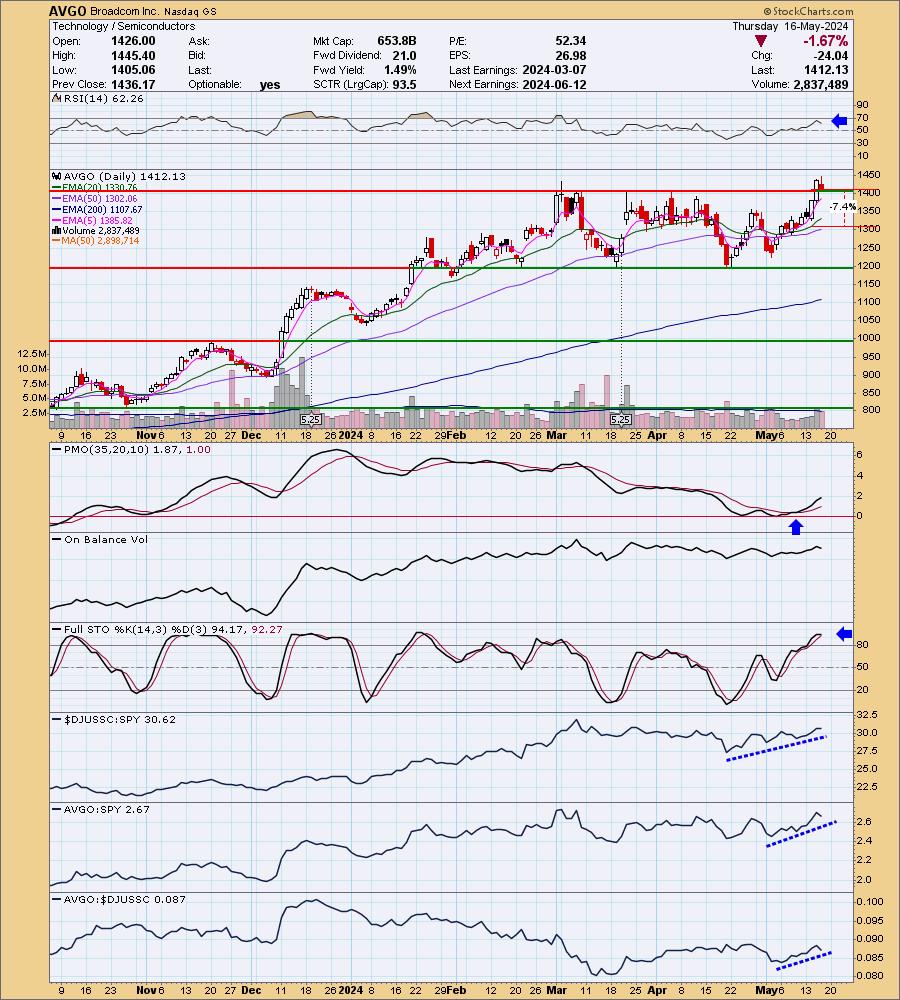
Here is today's chart:
I really liked the breakout and pullback to prior resistance, but today it dropped back below that level. Still, the chart hasn't gone completely south. I would say if the PMO turns down you should tighten the stop level. I do have a small worry about Semiconductors and that is upcoming earnings from NVDA. While they should be good, not all Semis have seen positive reactions to earnings. What they do have working for them is their yield dependency as I do see yields continuing to weaken.
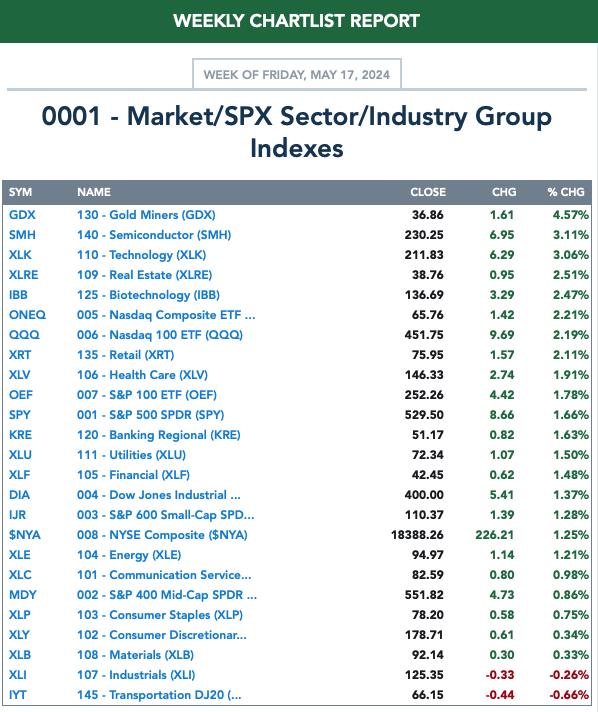
THIS WEEK's Performance:
DecisionPoint Market Scoreboard (Mechanical Trend Model Signals): 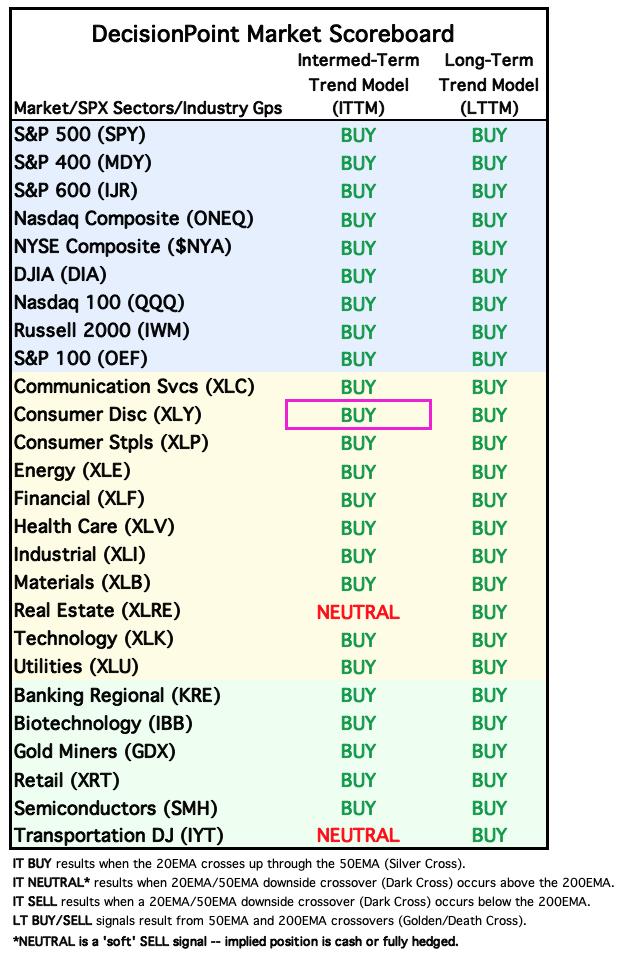
Friday signal changes are outlined in purple.
Click Here to view Carl's annotated "Under the Hood" ChartList!
Sector to Watch: Energy (XLE)
I am very happy to see the upside breakout from the bullish flag formation. The PMO just turned up today so we are getting in on this trade early. The RSI is now in positive territory. The Golden Cross Index is above its signal line and reading at over 90% so the foundation is quite strong. The Silver Cross Index hasn't gotten back above its signal line, but we are starting to see some movement in stocks above their 20/50EMAs. The big problem is those percentages are below the Silver Cross Index so it will take some time to get a bullish Silver Cross Index configuration. Stochastics look very positive. It of course has not been outperforming due to the falling flag, but I see more upside ahead for this sector.
Industry Group to Watch: Oil & Gas Equipment & Services (XES)
We have a breakout from a bullish double bottom formation. The pattern implies an upside target that would take price to overhead resistance at a minimum. The RSI is positive and the PMO is on a Crossover BUY Signal. Stochastics are oscillating above 80. Relative strength is also beginning to pick up. The OBV shows a strong positive divergence moving into the current rally.
Go to our Under the Hood ChartList on DecisionPoint.com to get an in-depth view of all the sectors. On StockCharts.com you can find the Industry Summary.
Good Luck & Good Trading!
- Erin
erin@decisionpoint.com
Full Disclosure: I'm 40% long, 0% short.
Watch the latest episode of the DecisionPoint Trading Room with Carl & Erin Swenlin on Mondays 3:00p EST!
Technical Analysis is a windsock, not a crystal ball. --Carl Swenlin
NOTE: The stocks reported herein are from mechanical trading model scans that are based upon moving average relationships, momentum and volume. DecisionPoint analysis is then applied to get selections from the scans. The selections given should prompt readers to do a chart review using their own analysis process. This letter is not a call for a specific action to buy, sell or short any of the stocks provided. There are NO sure things or guaranteed returns on the selection of "diamonds in the rough."
Helpful DecisionPoint Links:
DecisionPoint Shared ChartList and DecisionPoint Chart Gallery
Price Momentum Oscillator (PMO)
Swenlin Trading Oscillators (STO-B and STO-V)
(c) Copyright 2024 DecisionPoint.com