
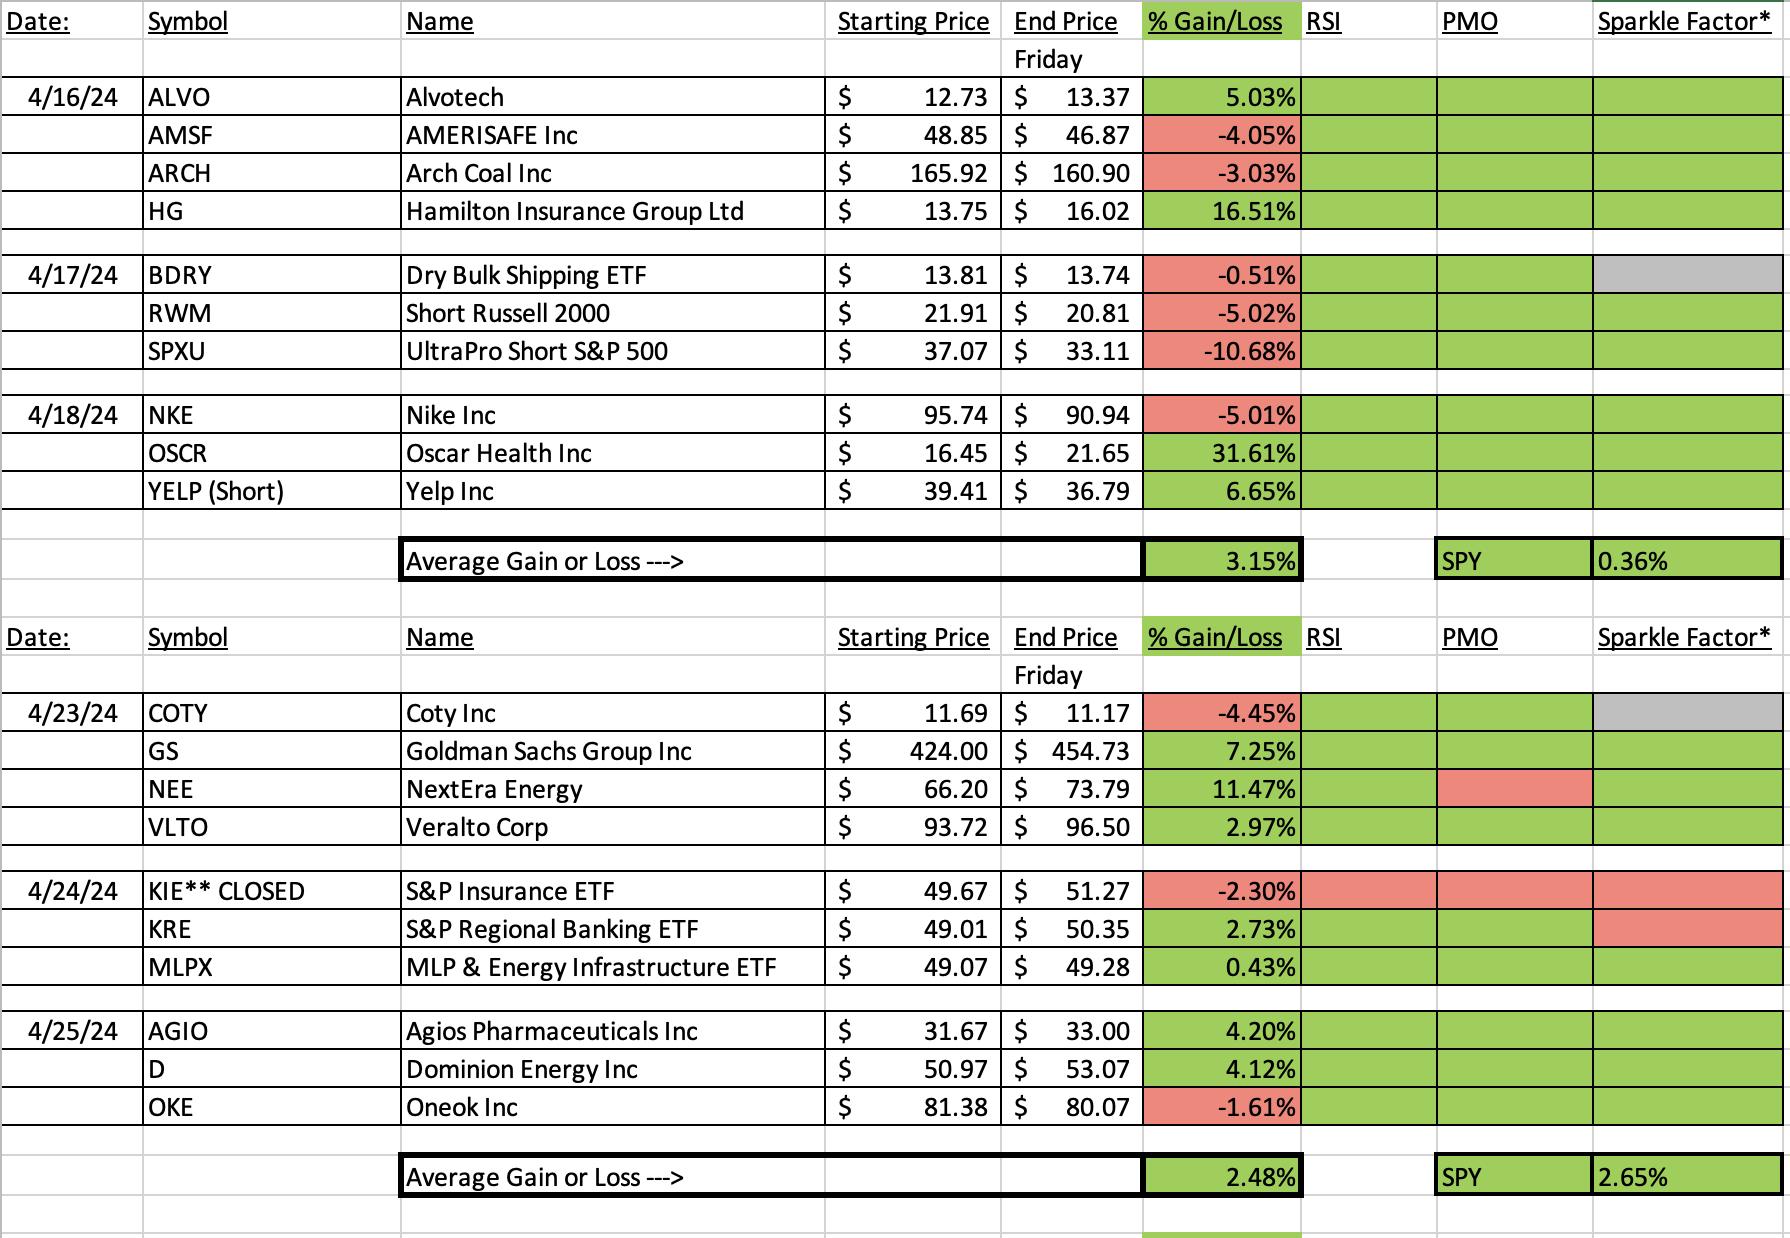
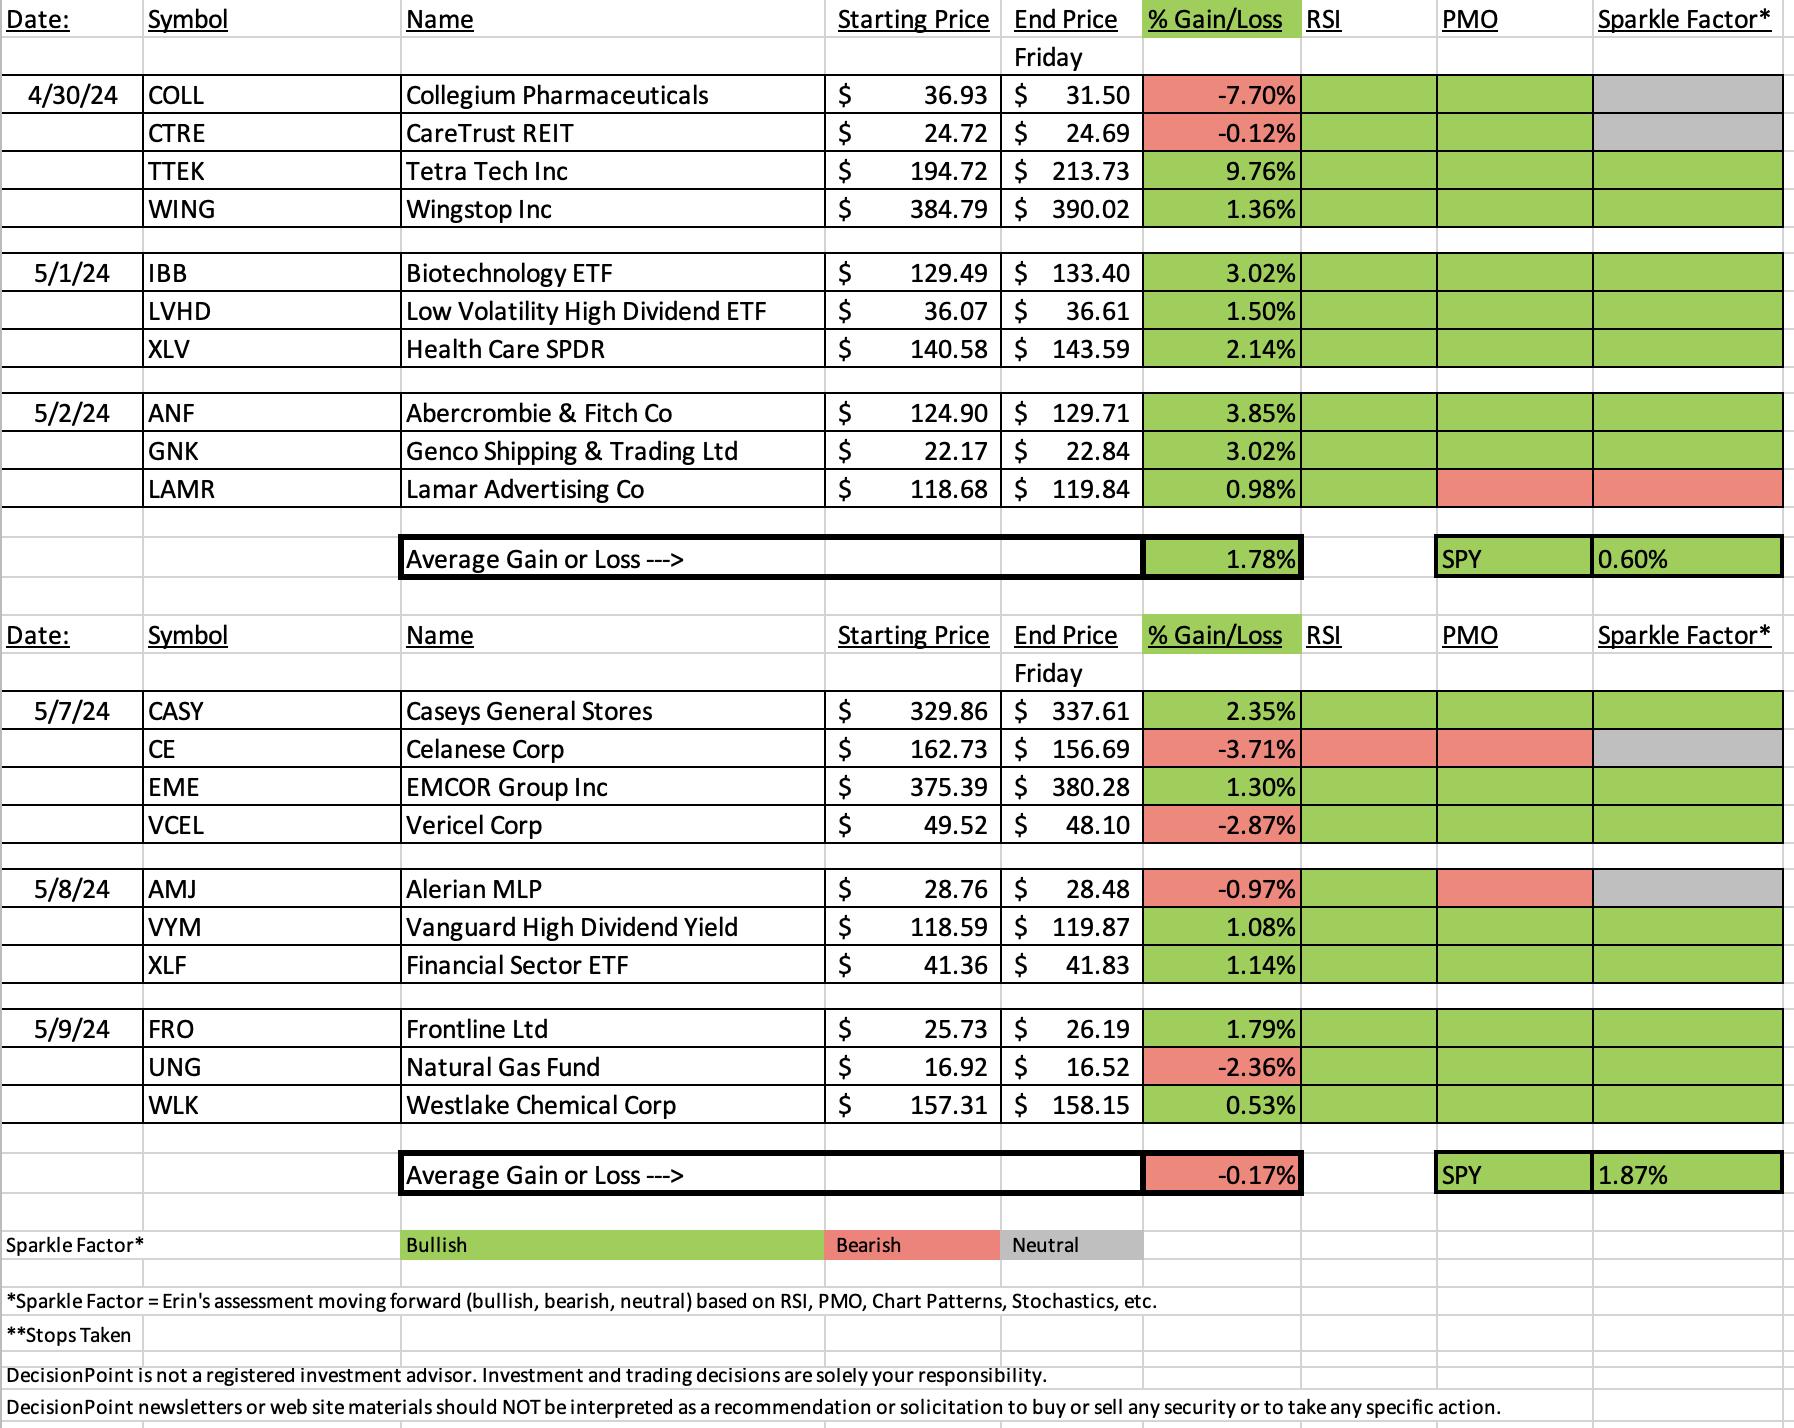
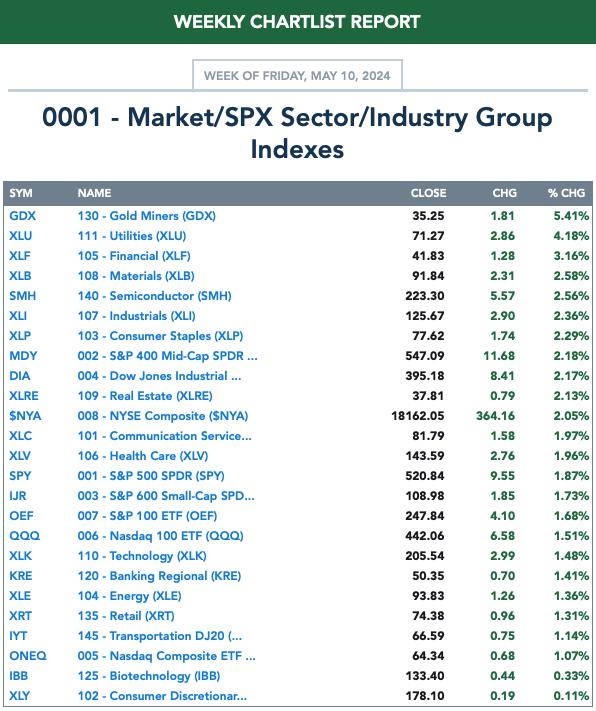
We had four "Diamonds in the Rough" finish lower on the week, but the other six made up for it with mostly 1%+ gains. The market does feel toppy right now so be careful expanding your portfolios. Make sure you are using stops for protection should this rally run out of steam.
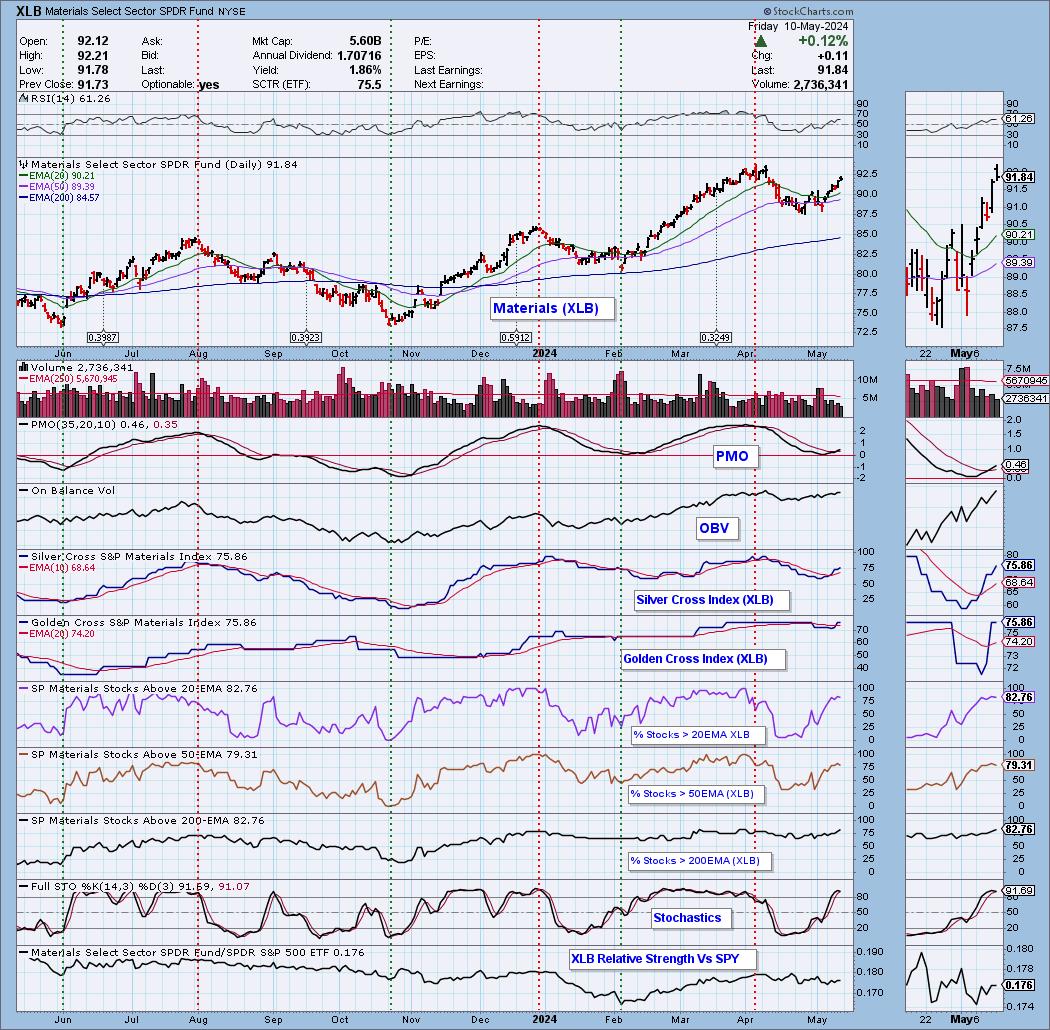
This week I decided the Sector to Watch would be Materials (XLB). We could've picked Financials (XLF) or even Healthcare (XLV). I would just avoid the aggressive areas of the market in Technology (XLK) and Communication Services (XLC).
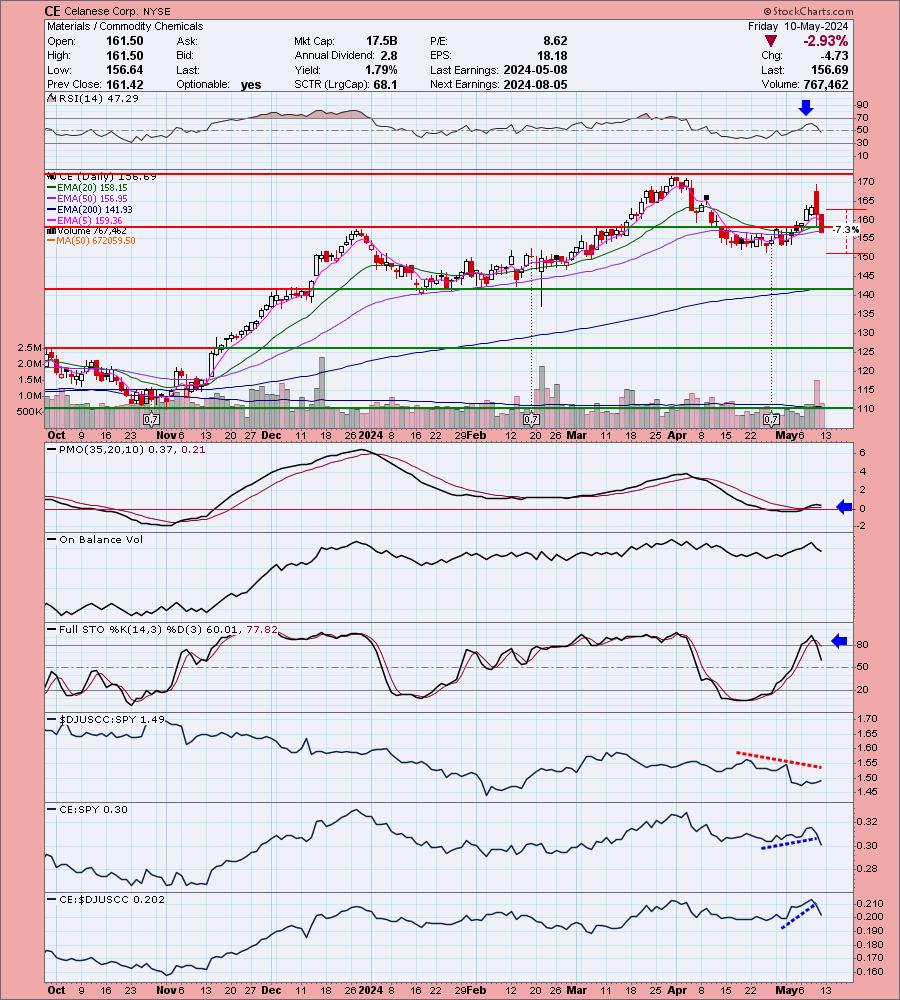
Interestingly, our Dud this week was Celanese (CE) which is a Materials stock. I'll discuss it in its section.
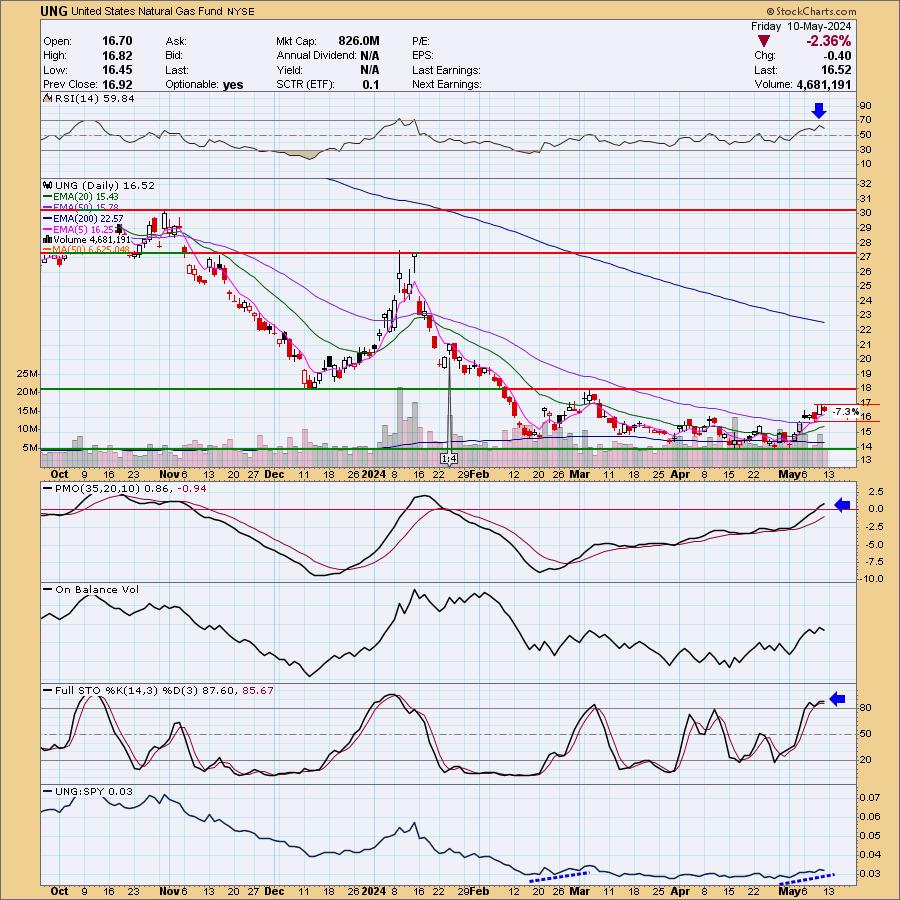
Natural Gas (UNG) came in second worst for the week, but I still like the chart below. The setup hasn't changed. It simply gave back some of the 6% gain it had yesterday.
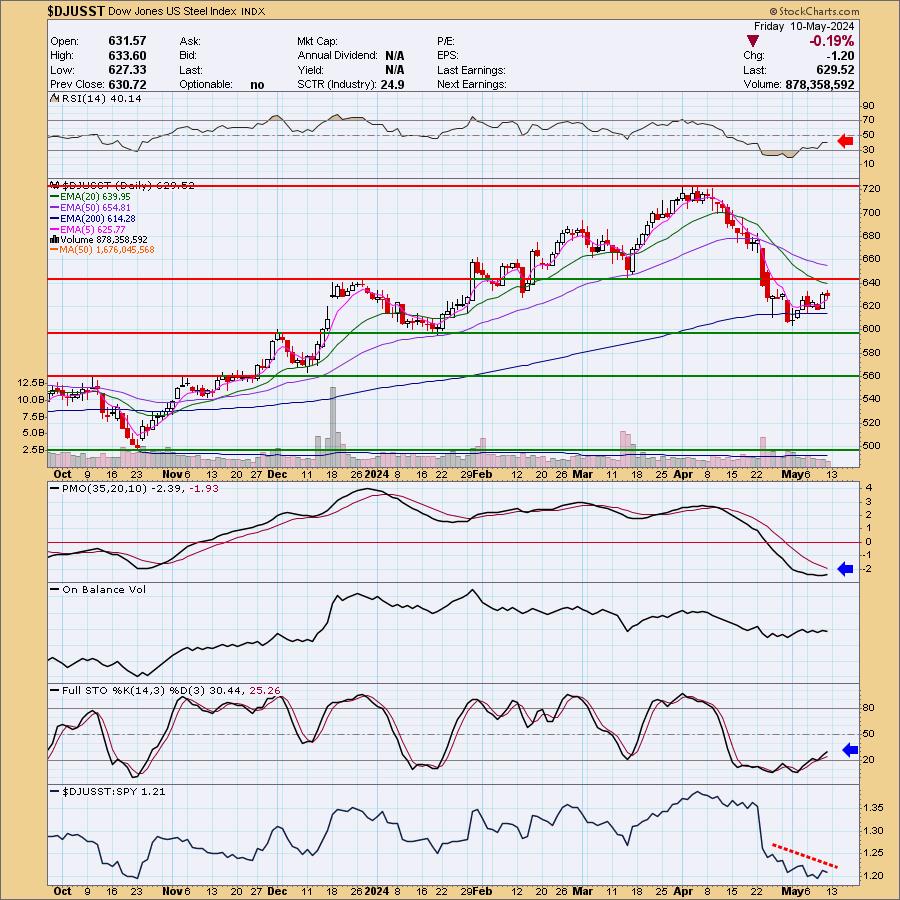
The Industry Group to Watch was Steel. I'm seeing a nice price bottom on the chart. It is early but worth a look. Symbols of interest in this group were CMC, MTUS, TX, STLD and RS. I particularly liked STLD and RS.
The Darling this week was Caseys General Stores (CASY). It is in the breakout sector of Consumer Staples (XLP). Remember that action in this sector and Utilities (XLU) mean investors are hedging their bets on the market.
I ran a few scans this morning in the Diamond Mine and I did find some interesting symbols for your review: BSX, ELME, MMM, NEM and RDNT.
Have a great weekend! See you in the free DecisionPoint Trading Room on Monday at Noon ET!
Good Luck & Good Trading,
Erin

RECORDING & DOWNLOAD LINK (5/10/2024):
Topic: DecisionPoint Diamond Mine (5/10/2024) LIVE Trading Room
Recording & Download Link HERE
Passcode: May#10th
REGISTRATION for 5/17/2024:
When: May 17, 2024 09:00 AM Pacific Time (US and Canada)
Topic: DecisionPoint Diamond Mine (5/17/2024) LIVE Trading Room
Register in advance for this webinar HERE
After registering, you will receive a confirmation email containing information about joining the webinar.

Below is the latest free DecisionPoint Trading Room recording from 5/6. You'll find these recordings posted on Mondays to our DP YouTube Channel. Be sure and subscribe HERE.
A few items about the spreadsheet: I've put on the spreadsheet whether the RSI is positive (green) or negative (red). The PMO column tells you if it is rising (green) or falling (red). Finally I've added my own "Sparkle Factor" that gives you my assessment going forward, bullish (green), bearish (red) or neutral (gray). The Sparkle Factor is basically my thoughts on whether I expect it to rise or fall. A neutral means it could really go either way so it could be added to a watch list. If you're in a stock I consider "neutral" going forward, the ball is in your court.
Darling:
Caseys General Stores, Inc. (CASY)
EARNINGS: 06/04/2024 (AMC)
Casey's General Stores, Inc. engages in the management and operation of convenience stores and gasoline stations. It provides self-service gasoline, a wide selection of grocery items, and an array of freshly prepared food items. The firm offers food, beverages, tobacco products, health and beauty aids, automotive products, and other non-food items. The company was founded by Donald F. Lamberti in 1968 and is headquartered in Ankeny, IA.
Predefined Scans Triggered: Moved Above Upper Keltner Channel, New 52-week Highs, Moved Above Upper Bollinger Band, Moved Above Upper Price Channel, P&F Ascending Triple Top Breakout and P&F Double Top Breakout.
Below are the commentary and chart from Tuesday, 5/7:
"CASY is down -0.28% in after hours trading. Today saw a tremendous breakout with trading taking place almost complete above prior resistance. This prevented a bearish double top from forming. The RSI is positive and we have a new PMO Crossover BUY Signal above the zero line. Stochastics are almost above 80. Relative strength for the group is not good, but CASY is outperforming the SPY and that is what counts. The stop is set beneath support at 7.6% or $304.79."

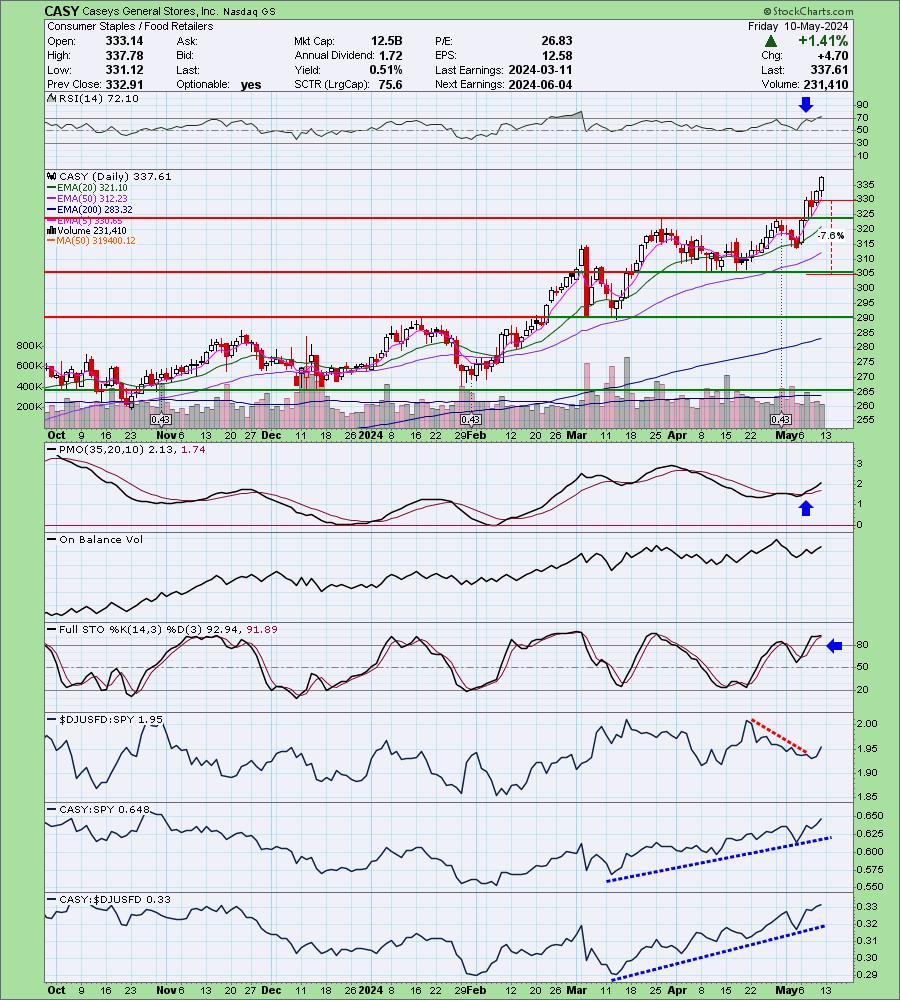
Here is today's chart:
Just as with the Consumer Staples (XLP) sector is breaking out so is CASY. The only issue with the chart now is that it is reading overbought based on the RSI. This may set up a pullback, but given the success XLP is having, I wouldn't be surprised if overbought conditions persist. Stochastics are camped out above 80 now and you can that the industry group is coming back to life. All of this bodes well for CASY.
Don't forget, on Thursdays I look at reader-requested symbols, so shoot me an email at erin@decisionpoint.com. I read every email I receive and try to answer them all!
Dud:
Celanese Corp. (CE)
EARNINGS: 05/08/2024 (AMC) ** Reports Tomorrow! **
Celanese Corp. engages in the provision of technology and specialty materials businesses. It operates through the following segments: Engineered Materials, Acetate Tow, Acetyl Chain and Other Activities. The Engineered Materials segment includes the engineered materials business, food ingredients business and certain strategic affiliates. The Acetate Tow segment serves consumer-driven applications and is a global producer and supplier of acetate tow and acetate flake used in filter products applications. The Acetyl Chain segment includes the integrated chain of intermediate chemistry, emulsion polymers and ethylene vinyl acetate (EVA) polymers businesses, based on similar products, production processes, classes of customers and selling and distribution practices as well as economic similarities over a normal business cycle. The Other Activities segment consists of corporate center costs, including administrative activities such as finance, information technology and human resource functions, interest income and expenses associated with financing activities. The company was founded by Camille Dreyfus and Henri Dreyfus in 1918 and is headquartered in Irving, TX.
Predefined Scans Triggered: New CCI Buy Signals, Moved Above Upper Bollinger Band, Moved Above Ichimoku Cloud and P&F Low Pole.
Below are the commentary and chart from Tuesday, 5/7:
"CE is up +0.17% in after hours trading. It does report after the bell tomorrow, but this melt up into earnings looks quite good. I'm not insisting you go in beforehand, just commenting on the ground being fertile for a rally. I like the basing pattern that it has come out of. The RSI is positive and not overbought. We have a new PMO Crossover BUY Signal above the zero line. Stochastics are now above 80. The group isn't performing very well, but CE is against the group and the SPY. The stop is set beneath support at 7.3% or $150.85."
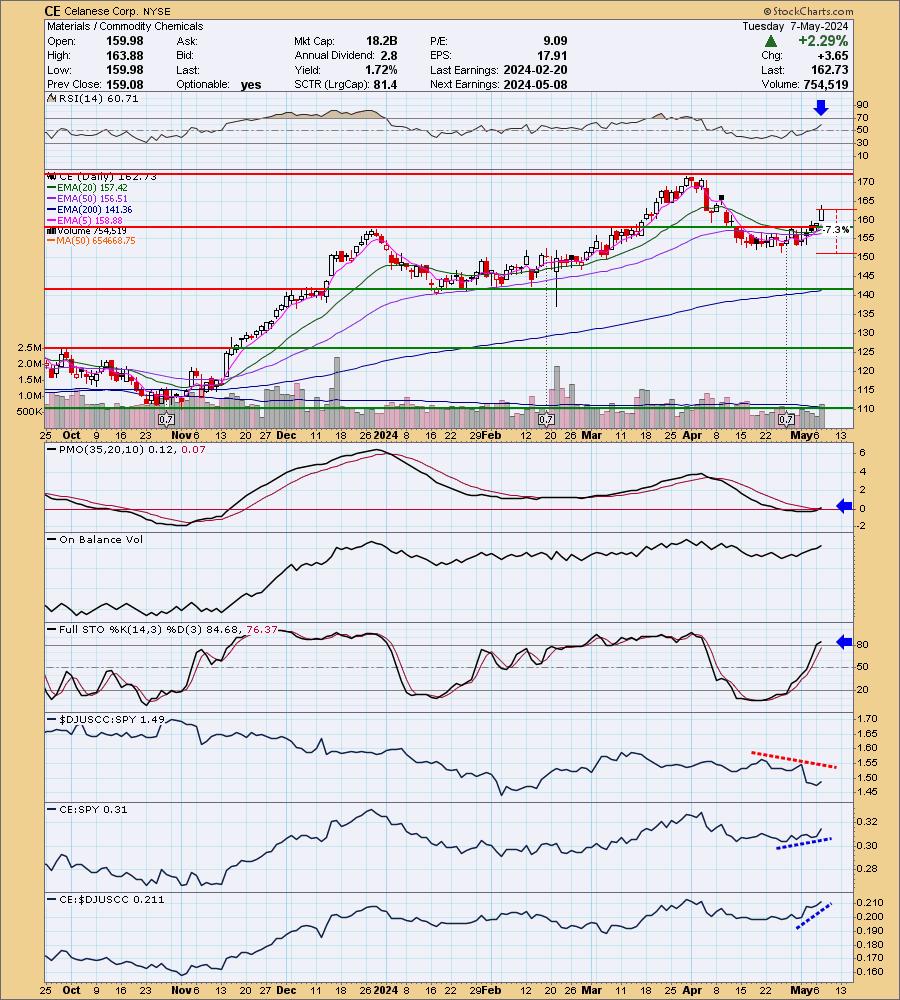
Here is today's chart:
I contemplated giving this one a red Sparkle Factor this week, but we have a cup with handle pattern that could see price pull out of this decline. It was two days of deep decline however which is why I am giving it a Neutral Sparkle Factor. The PMO has topped but good news is the industry group is beginning to outperform. I wouldn't be interested in entering here, but could see it as a hold as we wait to see whether price will reverse out of the bullish chart pattern.
THIS WEEK's Performance:
DecisionPoint Market Scoreboard (Mechanical Trend Model Signals): 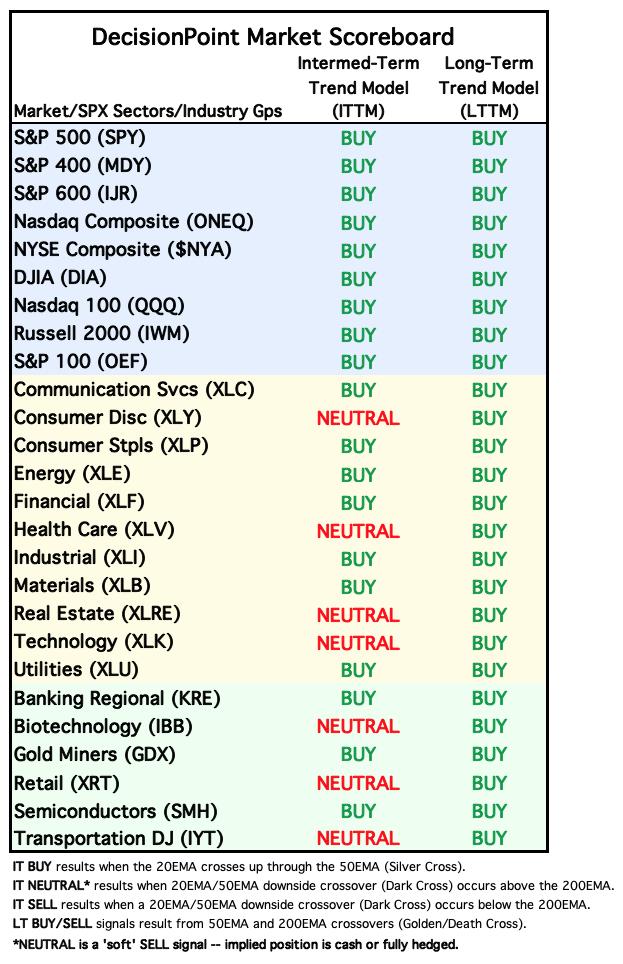
Friday signal changes are outlined in purple.
Click Here to view Carl's annotated "Under the Hood" ChartList!
Sector to Watch: Materials (XLB)
I wanted new momentum for our Sector to Watch. Financials (XLF) was showing it as was Industrials (XLI) but I liked Materials best, partially because I like the Gold trade and that will affect this sector somewhat. I could've chosen almost any sector this week based on participation and rising PMOs. Ultimately, I opted for XLB. The PMO is on a new Crossover BUY Signal and both the Silver Cross Index and Golden Cross Index are rising and are above their signal lines. Participation is robust and Stochastics are above 80. I would have liked to have seen more outperformance, but it is just now starting to outperform somewhat. We'll see how it shapes up next week.
Industry Group to Watch: Steel ($DJUSST)
This is a really early call as not everything is going completely right on the chart. I picked it primarily for its price pattern, bouncing off strong support and the 200-day EMA. Steel slid fast on the April decline, but it halted on support. The RSI is currently negative so price is more on the oversold side. The PMO is scooping up toward a Crossover BUY Signal and Stochastics are on the rise. It is not yet outperforming, we're trying to get this on the reversal. Symbols to review from this group: CMC, MTUS, TX, STLD and RS.
Go to our Under the Hood ChartList on DecisionPoint.com to get an in-depth view of all the sectors. On StockCharts.com you can find the Industry Summary.
Good Luck & Good Trading!
- Erin
erin@decisionpoint.com
Full Disclosure: I'm 40% long, 0% short.
Watch the latest episode of the DecisionPoint Trading Room with Carl & Erin Swenlin on Mondays 3:00p EST!
Technical Analysis is a windsock, not a crystal ball. --Carl Swenlin
NOTE: The stocks reported herein are from mechanical trading model scans that are based upon moving average relationships, momentum and volume. DecisionPoint analysis is then applied to get selections from the scans. The selections given should prompt readers to do a chart review using their own analysis process. This letter is not a call for a specific action to buy, sell or short any of the stocks provided. There are NO sure things or guaranteed returns on the selection of "diamonds in the rough."
Helpful DecisionPoint Links:
DecisionPoint Shared ChartList and DecisionPoint Chart Gallery
Price Momentum Oscillator (PMO)
Swenlin Trading Oscillators (STO-B and STO-V)
(c) Copyright 2024 DecisionPoint.com