
You could tell that today was a rally day given the results of today's scans. I found a few themes, but one that I currently won't be exploiting is Technology. While I do see more upside potential, I also see room for weakness when the market makes a turn. The XLK chart came up in the scans as well as a few other Tech related ETFs like ARKK. I think you need to be very nimble if you're going to trade the QQQ as well.
Other themes were Emerging Markets, Defense and Aerospace and Consumer Discretionary. Another area worth covering is Transportation (IYT) which I have included today. The Medical Devices ETF (IHI) also found its way into today's scan results. I picked both an Emerging Markets ETF and a Defense ETF. The Defense ETF is leveraged so be careful. An alternative to DFEN would be ITA.
Good Luck & Good Trading,
Erin
Today's "Diamonds in the Rough": DFEN, DGS and IYT.
Runner-ups: CNYA, BKCH, IHI, IXN, XLY and ITA.

RECORDING & DOWNLOAD LINK (2/2/2024):
Topic: DecisionPoint Diamond Mine (2/2/2024) LIVE Trading Room
Recording & Download Link HERE.
Passcode: February#2
REGISTRATION for 2/9/2024:
When: Feb 9, 2024 09:00 AM Pacific Time (US and Canada)
Topic: DecisionPoint Diamond Mine (2/9/2024) LIVE Trading Room
Register in advance for this webinar HERE.
After registering, you will receive a confirmation email containing information about joining the webinar.

Here is the latest recording from February 5th. Click HERE to subscribe to the DecisionPoint YouTube Channel to be notified when new content is available.
Welcome to DecisionPoint Diamonds, wherein I highlight ten "Diamonds in the Rough" per week. These are selected from the results of my DecisionPoint Scans which search for stocks that could benefit from the trend and condition of the market. Remember, these are not recommendations to buy or sell, but are the most interesting of the stocks that surfaced in my scans. My objective is to save you the work of the initial, tedious culling process, but you need to apply your own analysis to see if these stocks pique your interest as well. There are no guaranteed winners here!
"Predefined Scans Triggered" are taken from StockCharts.com using the "Symbol Summary" option instead of a "SharpChart" on the workbench.
Stop levels are all rounded down.
Direxion Daily Aerospace & Defense Bull 3X Shares (DFEN)
EARNINGS: N/A
DFEN provides 3x leveraged exposure to a market-cap- weighted index of US aerospace and defense companies. Click HERE for more information.

Predefined Scans Triggered: Moved Above Upper Bollinger Band, Moved Above Ichimoku Cloud and Moved Above Upper Price Channel.
DFEN is up +0.43% in after hours trading. Today saw a nice breakout above short-term resistance. The PMO has triggered a Crossover BUY Signal and the RSI is positive and far from overbought. This is leveraged so position size wisely and prepare yourself for a deep stop. Stochastics are above 80 and we see the ETF outperforming the market. I've set the stop at 8% or $21.29, but it could be set deeper because it is leveraged.

The weekly chart was a little disappointing given the long-term trading range with price near the top. The weekly RSI is positive and the weekly PMO is on a Crossover BUY Signal. The weekly PMO looks a bit suspect. Keep close tabs on this one if you get it. There is no StockCharts Technical Rank (SCTR) for this ETF so the hot zone* is obviously not being reached.
*If a stock is in the "hot zone" above 70, it implies that it is stronger than 70% of its universe (large-, mid-, small-caps and ETFs) primarily in the intermediate to long terms.

WisdomTree Emerging Markets SmallCap Dividend Fund (DGS)
EARNINGS: N/A
DGS tracks a dividend-weighted index of small-cap, dividend-paying emerging market stocks. Click HERE for more information.
Predefined Scans Triggered: Moved Above Upper Price Channel, P&F Ascending Triple Top Breakout and P&F Double Top Breakout.
DGS is down -0.53% in after hours trading. This week saw a breakout with two strong days of rally. This breakout came just in time as it was headed back toward support. The RSI is positive and not overbought. The PMO just triggered a new Crossover BUY Signal above the zero line indicating new strength. Stochastics have popped above 80. Relative strength isn't great but it is improving somewhat this week. The stop is set at the 200-day EMA at 6% or $46.37.

We can see that overhead resistance is nearing at 52-week highs. The weekly RSI is positive and the weekly PMO is on a Crossover BUY Signal. I don't like that the PMO is trying to top right as price is reaching overhead resistance so be careful and consider this a short-term play. Consider an upside target of about 17% to $57.72.

iShares Transportation Average ETF (IYT)
EARNINGS: N/A
IYT tracks a broad-based, modified market-cap-weighted index of US stocks in the transportation industry. Click HERE for more information.
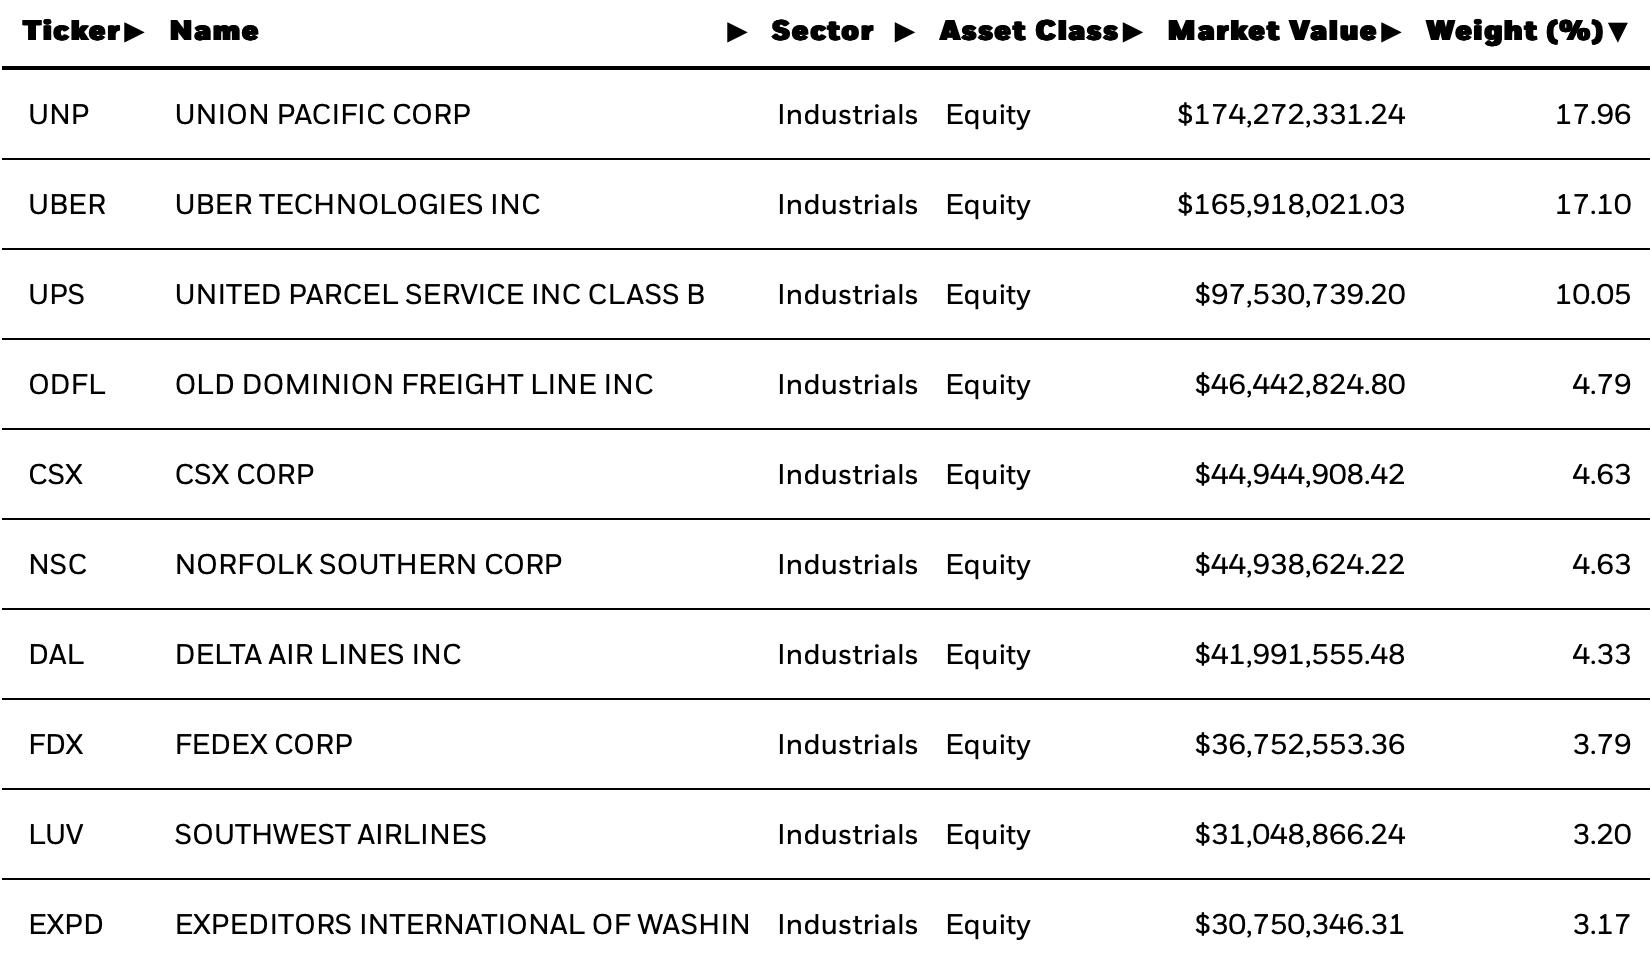
Predefined Scans Triggered: Moved Above Upper Keltner Channel, New 52-week Highs, Stocks in a New Uptrend (ADX), P&F Double Top Breakout and P&F Triple Top Breakout.
IYT is down -0.39% in after hours trading. We have the 'under the hood' chart available. You'll find this one and others in the "Under the Hood" ChartList on our website. Yesterday IYT had a nice breakout and today saw follow through. The RSI is positive and not overbought. There is a new Crossover BUY Signal. The Silver Cross Index is currently below its signal line, but we are getting a nice expansion of stocks above their 20/50-day EMAs. Stochastics are above 80 and relative strength has picked up. I've set the stop beneath support at 7.5% or $250.72.

Overhead resistance is nearing but given the positive daily chart and this positive weekly chart, I don't see why it wouldn't see a breakout here. The weekly RSI is positive and not yet overbought. The weekly PMO is on a Crossover BUY Signal and appears to be accelerating higher. The SCTR is well within the hot zone above 70. Consider a 17% upside target to about $317.13.

Don't forget, on Thursdays I look at reader-requested symbols, click HERE to send me an email. I read every email I receive and try to answer them all!
Current Market Outlook:
Market Environment: It is important to consider the odds for success by assessing the market tides. The following chart uses different methodologies for objectively showing the depth and trend of participation for intermediate- and long-term time frames.
- The Silver Cross Index (SCI) shows the percentage of SPX stocks on IT Trend Model BUY signals (20-EMA > 50-EMA)
- The Golden Cross Index (GCI) shows the percentage of SPX stocks on LT Trend Model BUY signals (50-EMA > 200-EMA)
Don't forget that as a "Diamonds" member, you have access to our GCI/SCI curated ChartList on DecisionPoint.com. You'll find it under "Members Only" links on the left side on the Blogs and Links Page.
Here is the current chart:

Full Disclosure: I am 20% long, 0% short.
I'm required to disclose if I currently own a stock I mention and/or may buy/short it within the next 72 hours.
"Technical Analysis is a windsock, not a crystal ball." - Carl Swenlin
(c) Copyright 2024 DecisionPoint.com
Watch the latest episode of DecisionPoint Trading Room with Carl & Erin Swenlin Mondays on the DecisionPoint YouTube channel here!
NOTE: The stocks reported herein are from mechanical trading model scans that are based upon moving average relationships, momentum and volume. DecisionPoint analysis is then applied to get five selections from the scans. The selections given should prompt readers to do a chart review using their own analysis process. This letter is not a call for a specific action to buy, sell or short any of the stocks provided. There are NO sure things or guaranteed returns on the daily selection of "Diamonds in the Rough."
Regarding BUY/SELL Signals: The signal status reported herein is based upon mechanical trading model signals and crossovers. They define the implied bias of the price index/stock based upon moving average relationships and momentum, but they do not necessarily call for a specific action. They are information flags that should prompt chart review. Further, they do not call for continuous buying or selling during the life of the signal. For example, a BUY signal will probably (but not necessarily) return the best results if action is taken soon after the signal is generated. Additional opportunities for buying may be found as price zigzags higher, but the trader must look for optimum entry points. Conversely, exit points to preserve gains (or minimize losses) may be evident before the model mechanically closes the signal.
Helpful DecisionPoint Links:
Price Momentum Oscillator (PMO)
Swenlin Trading Oscillators (STO-B and STO-V)
For more links, go to DecisionPoint.com