
In a somewhat surprising turn of events, the market rallied. Short-term indicators had been flashing that we would see a continuation of yesterday's decline. Instead we got a bullish finish to the week. This is good news as it does suggest there is internal strength moving forward.
I'll be reviewing the charts in more detail in today's DP Weekly Wrap, but I have to say today's rally was very encouraging for the short term.
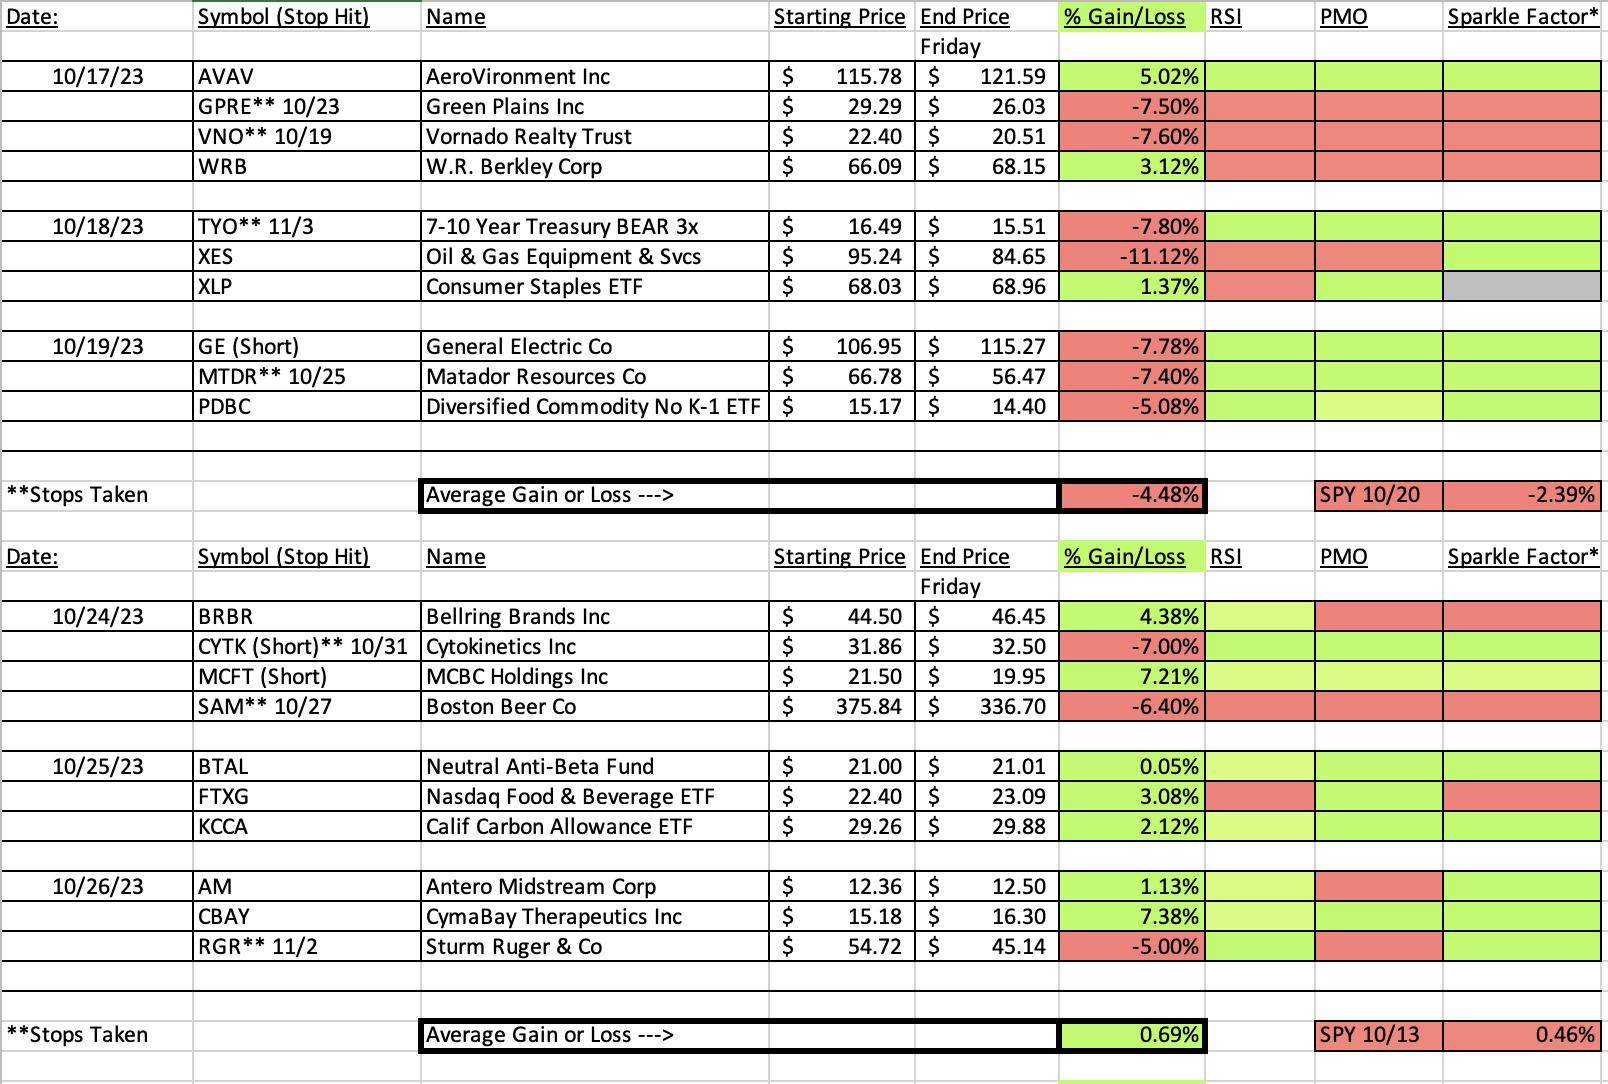
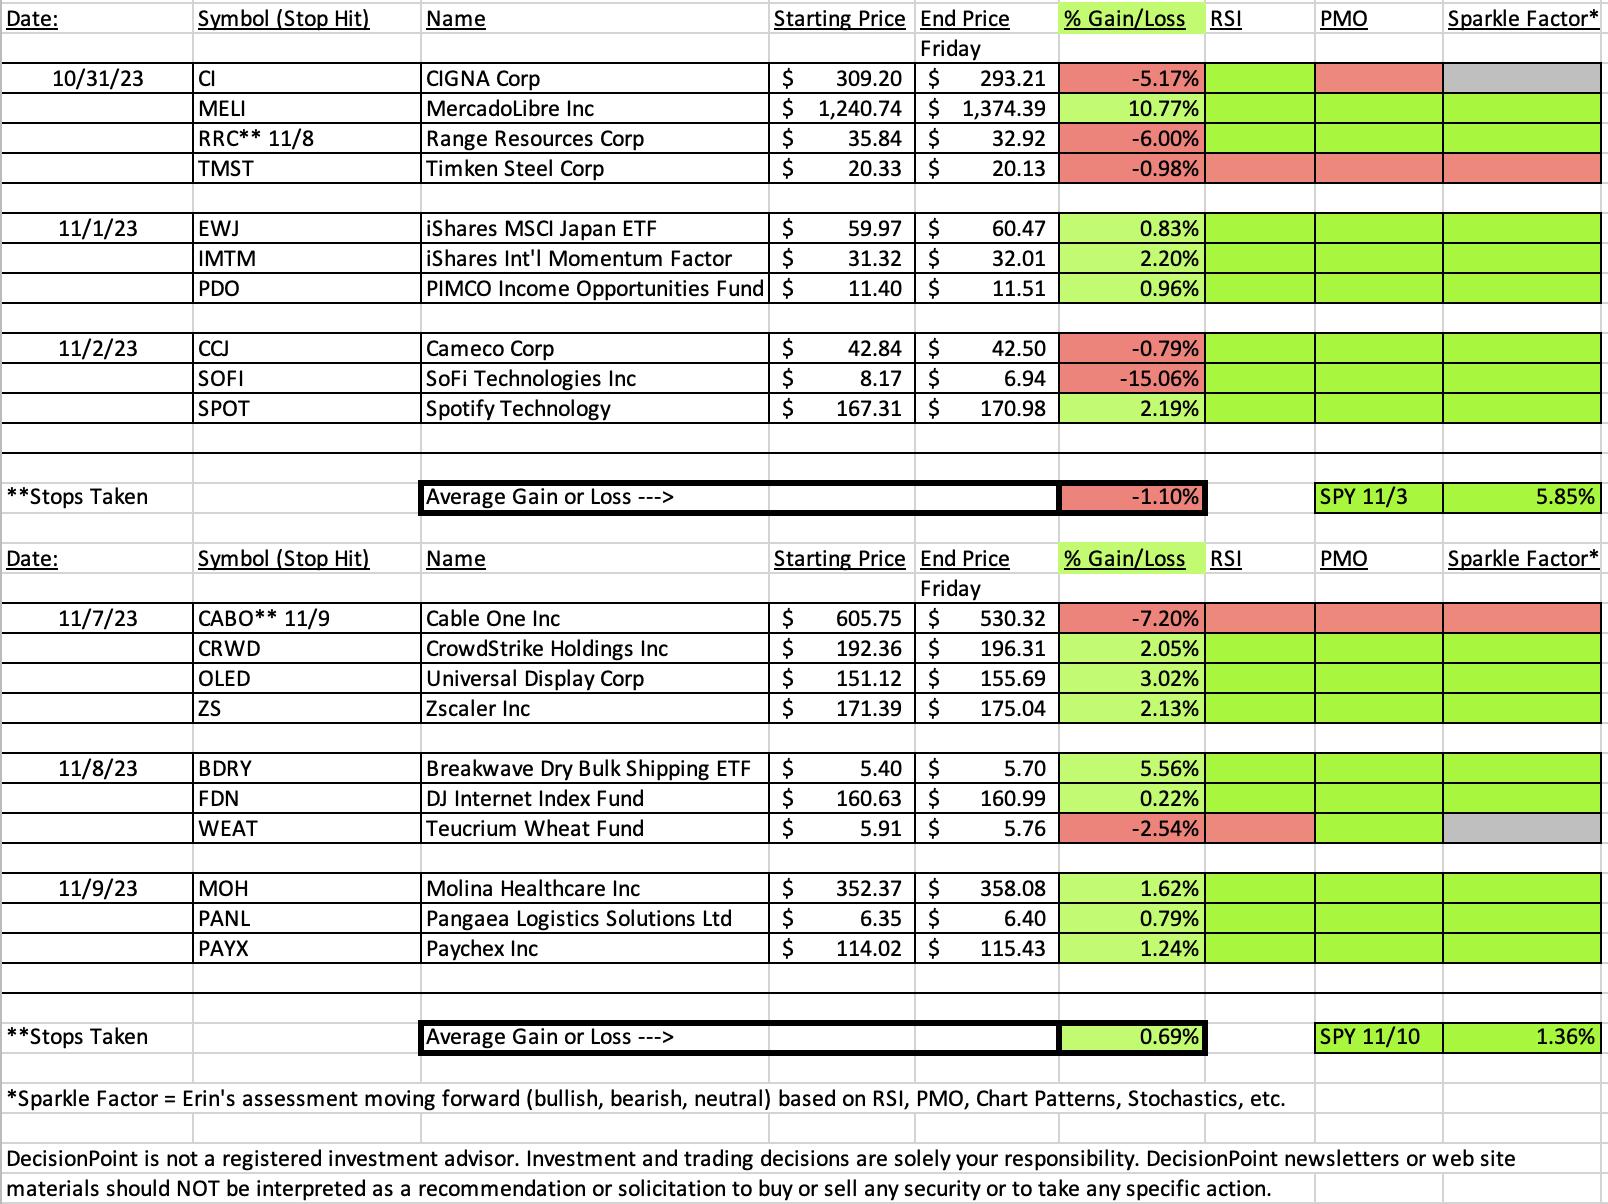
"Diamonds in the Rough" finished with only two positions down since being picked. One was a complete disaster and after reviewing the chart in the Diamond Mine this morning, I can't put my finger on why it failed so spectacularly. The "Darling" this week was the Dry Bulk Shipping ETF (BDRY) and the chart suggests further upside ahead even after the 5%+ gain since Wednesday.
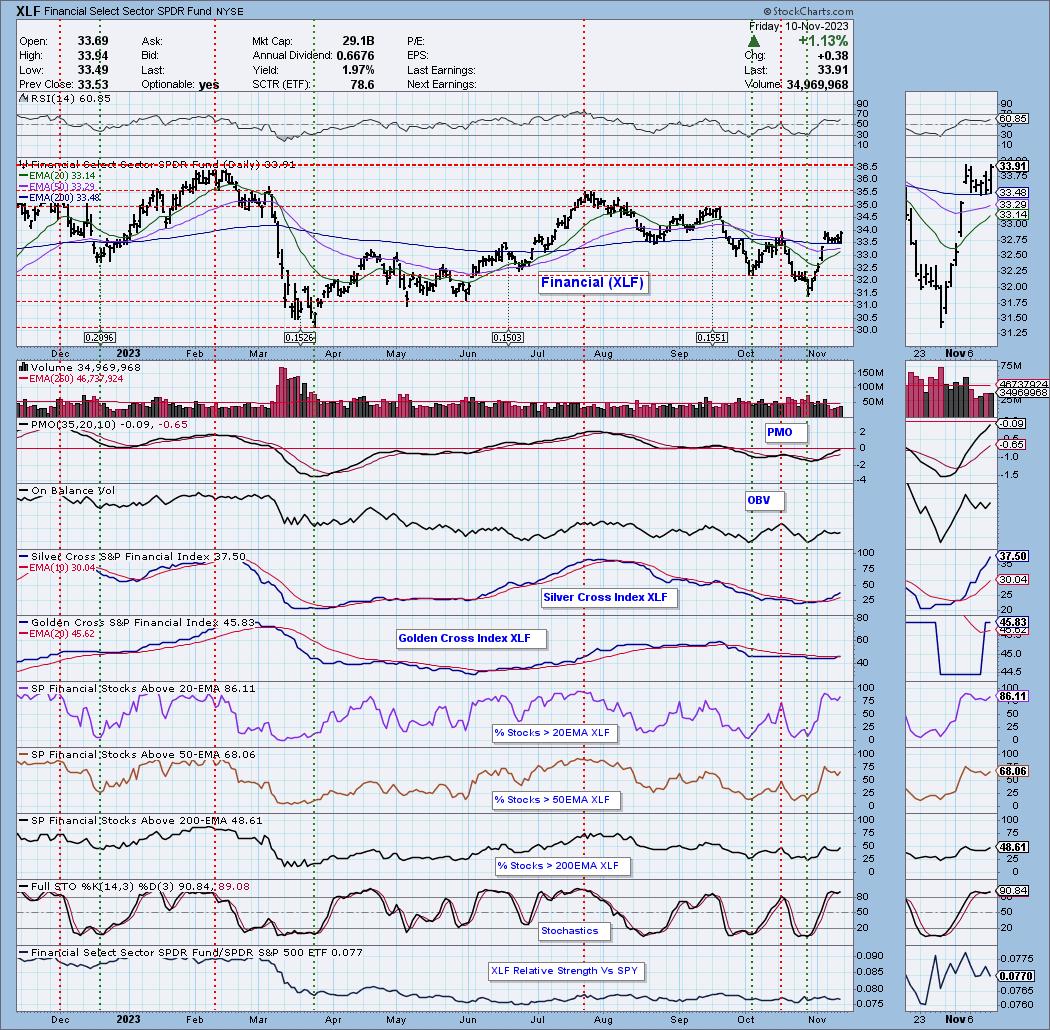
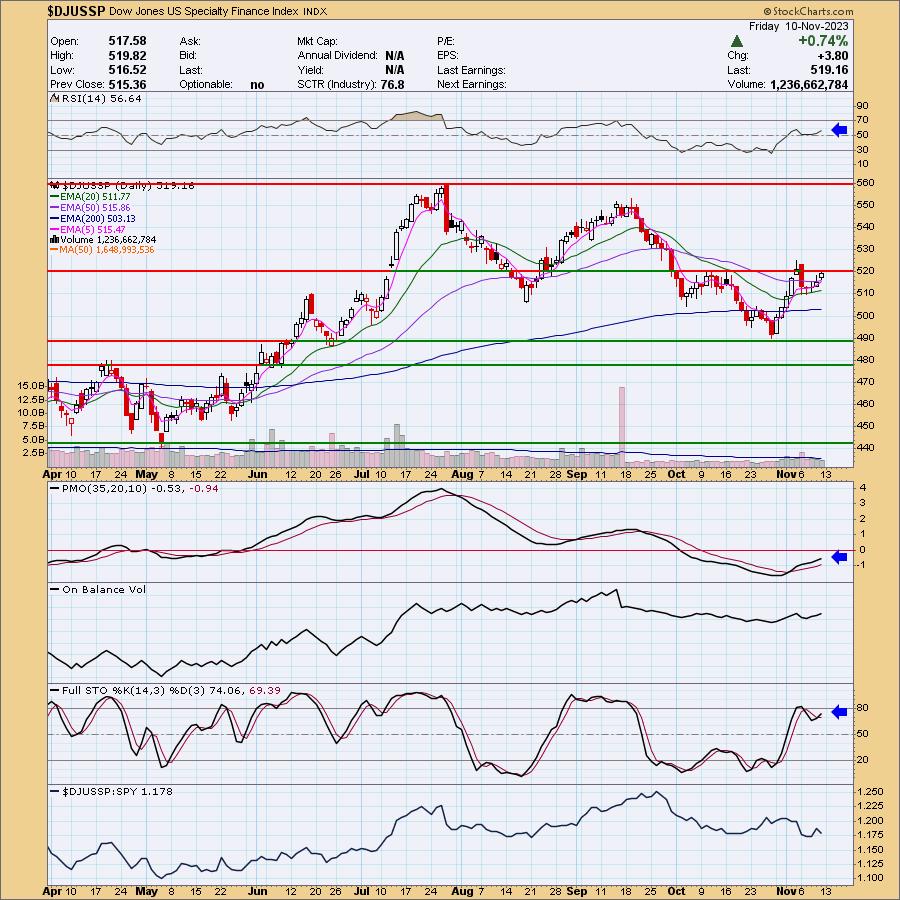
The Sector to Watch is Financials (XLF) which looked good under the hood this morning. The Industry Group to Watch is Specialty Finance. I was able to find plenty of candidates for your watch lists next week: ARES, KKR, PAYS, MCO and SPGI.
Have a great weekend!
Good Luck & Good Trading,
Erin

RECORDING LINK (11/10/2023):
Topic: DecisionPoint Diamond Mine (11/10/2023) LIVE Trading Room
Passcode: November#10
REGISTRATION for 11/17/2023:
When: Nov 17, 2023 09:00 AM Pacific Time (US and Canada)
Topic: DecisionPoint Diamond Mine (11/17/2023) LIVE Trading Room
Register in advance for this webinar HERE
After registering, you will receive a confirmation email containing information about joining the webinar.

Our latest DecisionPoint Trading Room recording (11/6):
A few items about the spreadsheet: I've put on the spreadsheet whether the RSI is positive (green) or negative (red). The PMO column tells you if it is rising (green) or falling (red). Finally I've added my own "Sparkle Factor" that gives you my assessment going forward, bullish (green), bearish (red) or neutral (gray). The Sparkle Factor is basically my thoughts on whether I expect it to rise or fall. A neutral means it could really go either way so it could be added to a watch list. If you're in a stock I consider "neutral" going forward, the ball is in your court.
Darling:
Breakwave Dry Bulk Shipping ETF (BDRY)
EARNINGS: N/A
BDRY tracks an index of long-only exposure to the nearest calendar quarter of dry bulk freight futures contracts on specified indexes. Click HERE for more information.
Predefined Scans Triggered: Elder Bar Turned Green and Parabolic SAR Buy Signals.
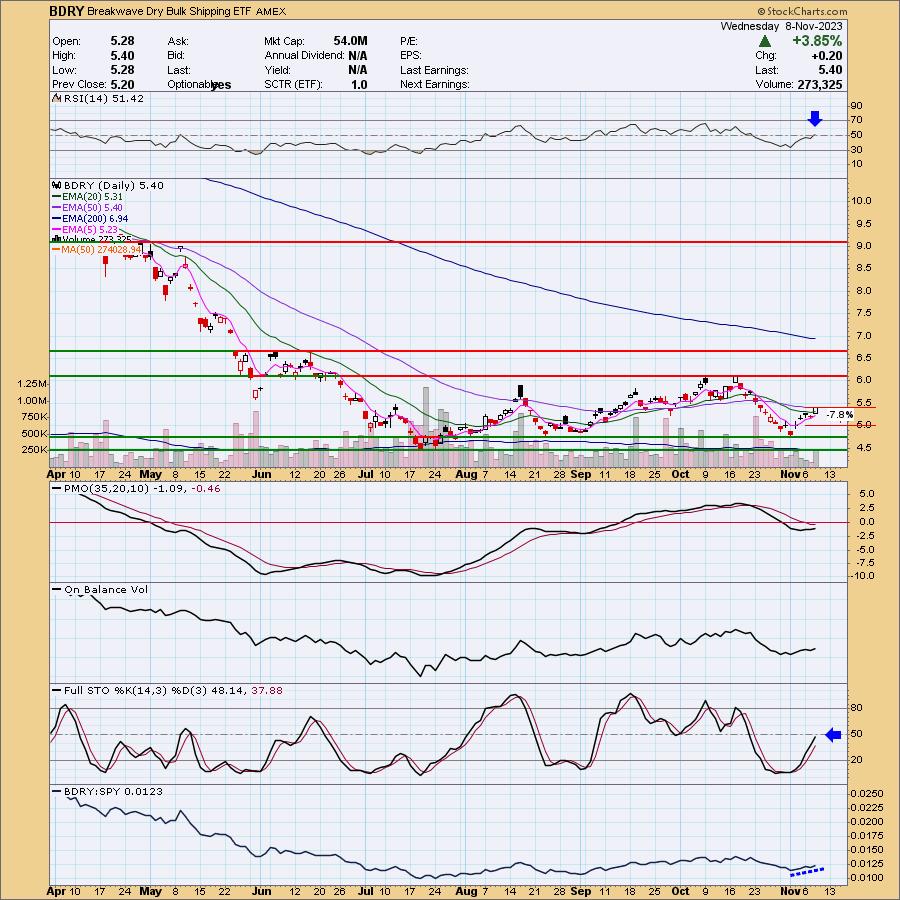
Below are the commentary and chart from 11/8:
"BDRY is unchanged in after hours trading. This is a trading range which in general I don't care for, but given the bounce off the support zone combined with positive indicators, I'm looking for it to at least get back to the top of the range. This is a low priced ETF so position size wisely. The RSI just moved into positive territory and the PMO is gently rising toward a Crossover BUY Signal. Stochastics are rising strongly and it is beginning to outperform the SPY. The stop is set at 7.8% or $4.97."
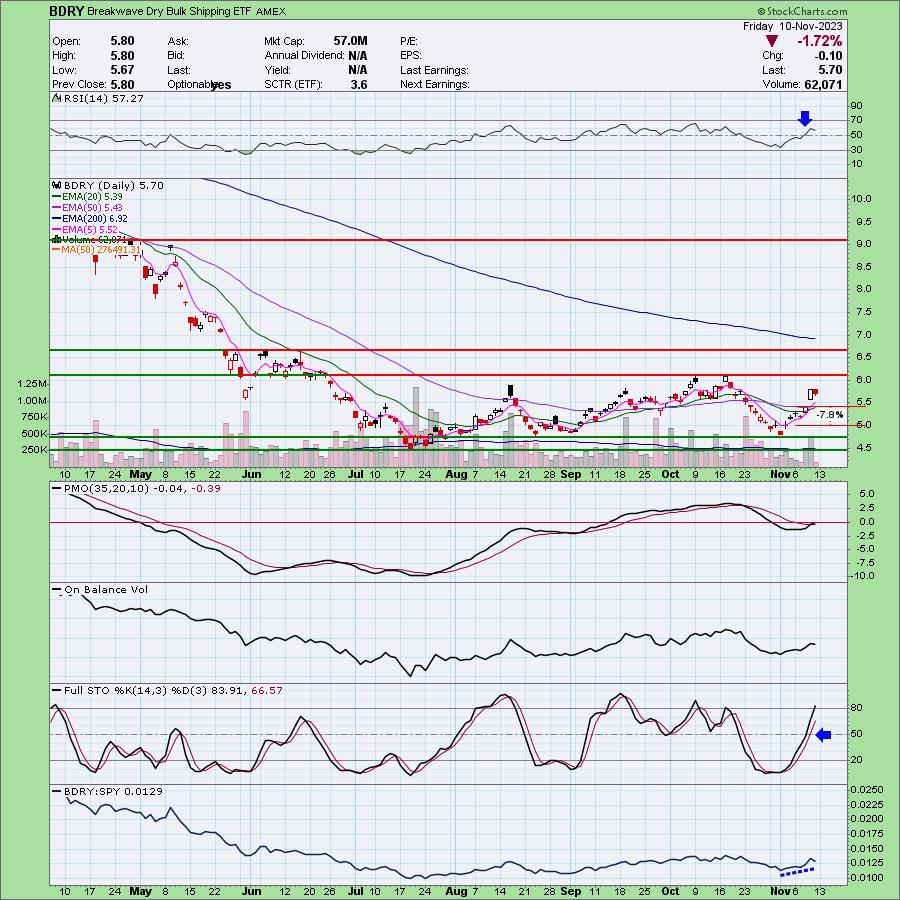
Here is today's chart:
The main reason BDRY was this week's "Darling" was due to its strong 7%+ rally on Thursday. Today it took back some of that, but I do expect it to pick back up next week. The PMO has given us a Crossover BUY Signal now and Stochastics are above 80. I like this one moving forward.
Don't forget, on Thursdays I look at reader-requested symbols, so shoot me an email at erin@decisionpoint.com. I read every email I receive and try to answer them all!
Dud:
Cable One, Inc. (CABO)
EARNINGS: 02/22/2024 (AMC)
Cable One, Inc. engages in the provision of data, video, and voice services to residential and business customers. It provides consumers with an array of communications and entertainment services, including Internet and wireless fiber solutions, cable television and phone service under the brand name Sparklight. The company was founded in 1986 and is headquartered in Phoenix, AZ.
Predefined Scans Triggered: Bullish MACD Crossovers.
Below are the commentary and chart from 11/7:
"CABO is down -0.07% in after hours trading. I liked today's breakout above both the 20-day EMA and horizontal support at the May low. Next up is the 50-day EMA. The RSI is positive and not overbought. The PMO is nearing a Crossover BUY Signal and Stochastics are rising in positive territory. The group is performing in line with the SPY. CABO is beginning to outperform the group and the SPY. The stop is set at 7.2%, about halfway down the trading range, around $562.13."
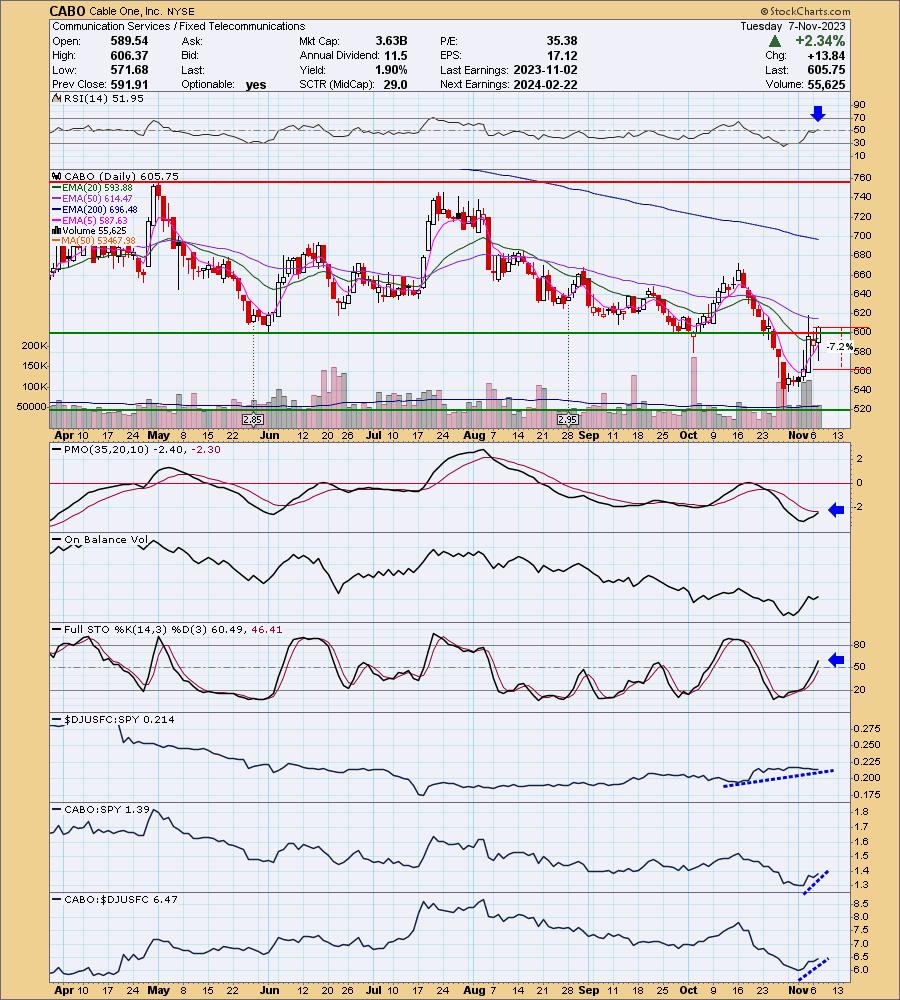
Here is today's chart:
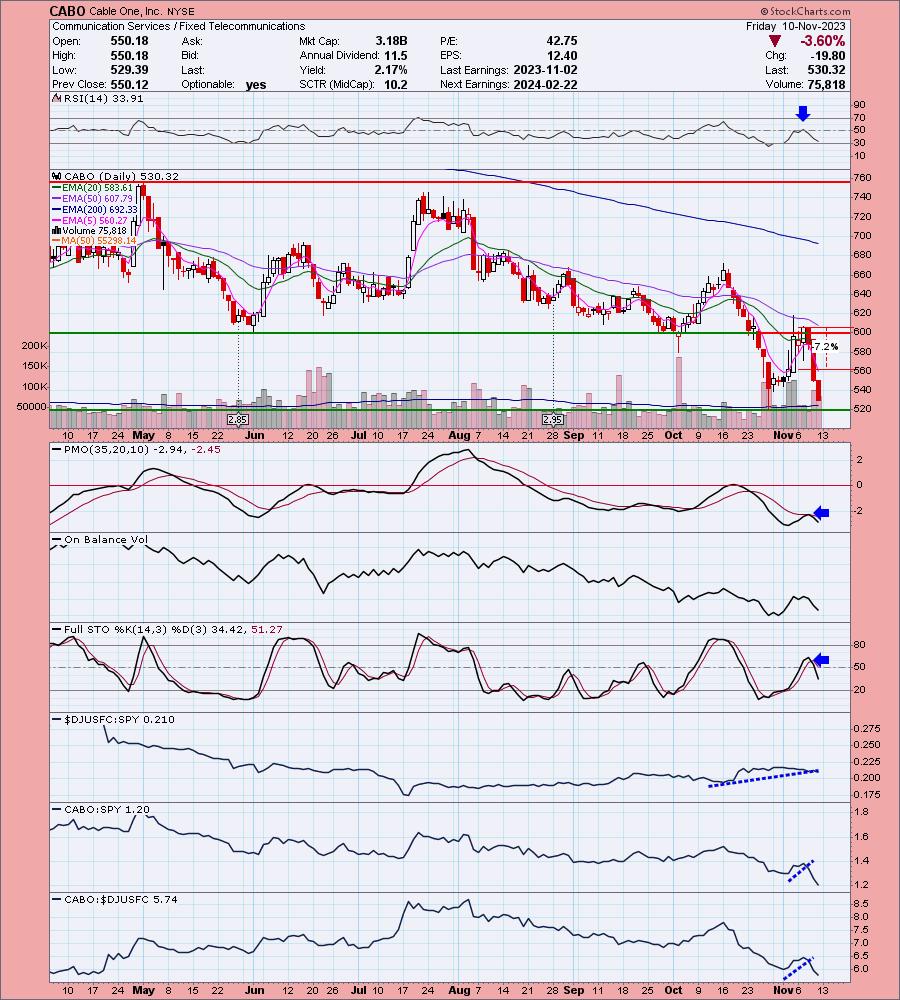
This one completely failed starting the day after I picked it. Technically, I didn't seen anything wrong with the chart, so I can't say we had warning on this one. I trust my analysis process, this one just didn't fulfill as it should have.
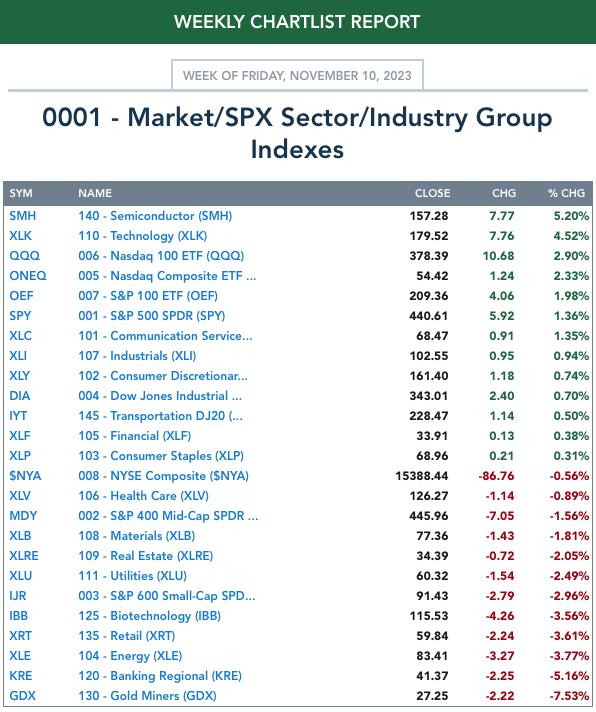
THIS WEEK's Performance:
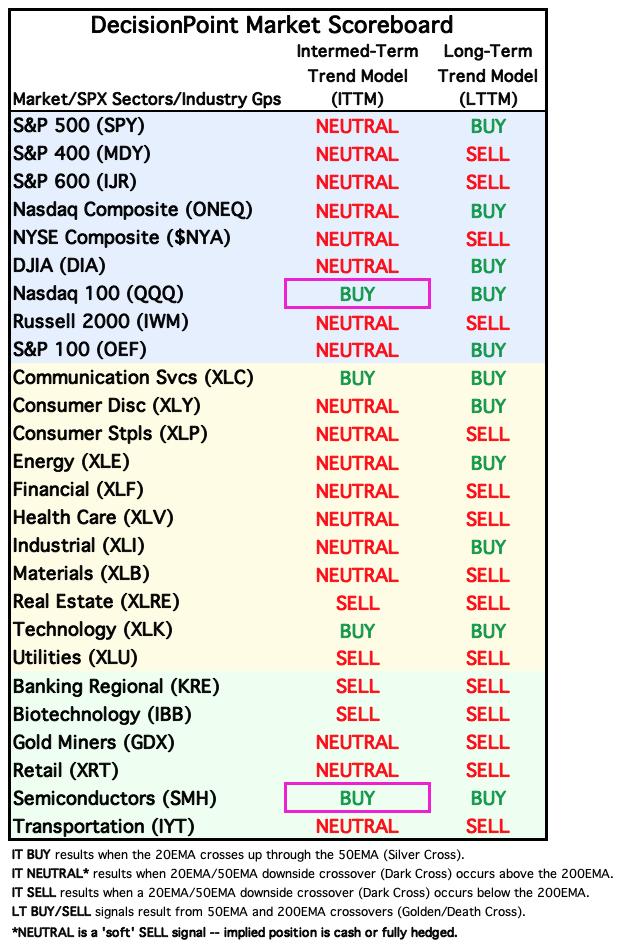
DecisionPoint Market Scoreboard (Mechanical Trend Model Signals):
Friday's signal changes are outlined in purple.
Click Here to view Carl's annotated "Under the Hood" ChartList!
Sector to Watch: Financial (XLF)
I liked the price pattern best on XLF. We have a clear bull flag and today saw a breakout from the flag. Rather than pulling back, price has spent time consolidating above the 200-day EMA. Participation is robust with %Stocks > 20/50EMAs above our bullish 50% threshold. The Silver Cross Index is rising above its signal line and yesterday, the Golden Cross Index had a Bullish Shift, moving above its signal line. Stochastics have turned up above 80. I think that Technology (XLK) will be too sensitive to any short-term weakness in the market so this is a good alternative. It could still struggle with the rest of the market, but at least we have some good participation to hopefully prevent a big short-term decline.
Industry Group to Watch: Recreational Services ($DJUSST)
I see the development of a reverse head and shoulders pattern which is bullish. Price hasn't broken out yet, but I like the rising PMO and positive RSI. Stochastics look particularly bullish as they have reversed in positive territory. Relative strength could be better, but I have to say as we looked at the charts within this group, I was very impressed so I'll sacrifice the relative strength line. The symbols you should look at are: ARES, KKR, PAYS, MCO and SPGI. They are on my radar for next week.
Go to our Under the Hood ChartList on DecisionPoint.com to get an in-depth view of all the sectors. On StockCharts.com you can find the Industry Summary.
Good Luck & Good Trading!
- Erin
erin@decisionpoint.com
Full Disclosure: I'm 55% long, 0% short.
Watch the latest episode of the DecisionPoint Trading Room with Carl & Erin Swenlin on Mondays 3:00p EST!
Technical Analysis is a windsock, not a crystal ball. --Carl Swenlin
NOTE: The stocks reported herein are from mechanical trading model scans that are based upon moving average relationships, momentum and volume. DecisionPoint analysis is then applied to get selections from the scans. The selections given should prompt readers to do a chart review using their own analysis process. This letter is not a call for a specific action to buy, sell or short any of the stocks provided. There are NO sure things or guaranteed returns on the selection of "diamonds in the rough."
Helpful DecisionPoint Links:
DecisionPoint Shared ChartList and DecisionPoint Chart Gallery
Price Momentum Oscillator (PMO)
Swenlin Trading Oscillators (STO-B and STO-V)
(c) Copyright 2023 DecisionPoint.com