
I had a fairly large selection of candidates to review from my scans today. It had me relooking at two sectors that weren't on my radar.
Energy looks like it may be in the process of reversing somewhat as I did see fairly good representation in the scan results. Within Healthcare I saw a theme of Healthcare Providers so I picked one that looked good.
I hate to pick stocks that are reporting soon, but the charts looked very constructive. I have one reporting Thursday and one that reports tomorrow. It's tough during earnings season to avoid. Hopefully we don't have a Boston Beer (SAM) situation as we did last week.
I mentioned Steel on Friday and I had a few Steel stocks arrive in my scans. I liked US Steel (X), but it is in the midst of merger talks and has been since August so be careful with that one. I opted to pick Timken (TMST) which also looks positive.
Good Luck & Good Trading,
Erin
Today's "Diamonds in the Rough": CI, MELI, RRC and TMST.

RECORDING LINK (10/27/2023):
Topic: DecisionPoint Diamond Mine (10/27/2023) LIVE Trading Room
Passcode: October#27
REGISTRATION for 11/3/2023:
When: Nov 3, 2023 09:00 AM Pacific Time (US and Canada)
Topic: DecisionPoint Diamond Mine (11-3-2023) LIVE Trading Room
Register in advance for this webinar HERE
After registering, you will receive a confirmation email containing information about joining the webinar.

Here is the last recording from 10/30:
Welcome to DecisionPoint Diamonds, wherein I highlight ten "Diamonds in the Rough" per week. These are selected from the results of my DecisionPoint Scans which search for stocks that could benefit from the trend and condition of the market. Remember, these are not recommendations to buy or sell, but are the most interesting of the stocks that surfaced in my scans. My objective is to save you the work of the initial, tedious culling process, but you need to apply your own analysis to see if these stocks pique your interest as well. There are no guaranteed winners here!
"Predefined Scans Triggered" are taken from StockCharts.com using the "Symbol Summary" option instead of a "SharpChart" on the workbench.
Stop levels are all rounded down.
CIGNA Corp. (CI)
EARNINGS: 11/02/2023 (BMO) ** Reports Thursday! **
The Cigna Group is engaged in the provision of global health services. It operates through the following segments: Evernorth, U.S. Medical, International Markets, and Group Disability and Other. The Evernorth segment includes a broad range of coordinated and point solution health services, including pharmacy solutions, benefits management solutions, care solutions and intelligence solutions. The U.S. Medical segment includes Cigna's U.S. Commercial and U.S. Government businesses that provide comprehensive medical and coordinated solutions to clients and customers. The International Markets segment includes supplemental health, life and accident insurance products and health care coverage in international markets, as well as health care benefits to globally mobile employees of multinational organizations. The Group Disability and Other segment represents group disability and life, corporate-owned life insurance, and run-off business consisting of reinsurance, settlement authority, and individual life insurance and annuity and retirement benefits business. The company was founded in 1792 and is headquartered in Bloomfield, CT.
Predefined Scans Triggered: Elder Bar Turned Green, Improving Chaikin Money Flow and Ichimoku Cloud Turned Green.
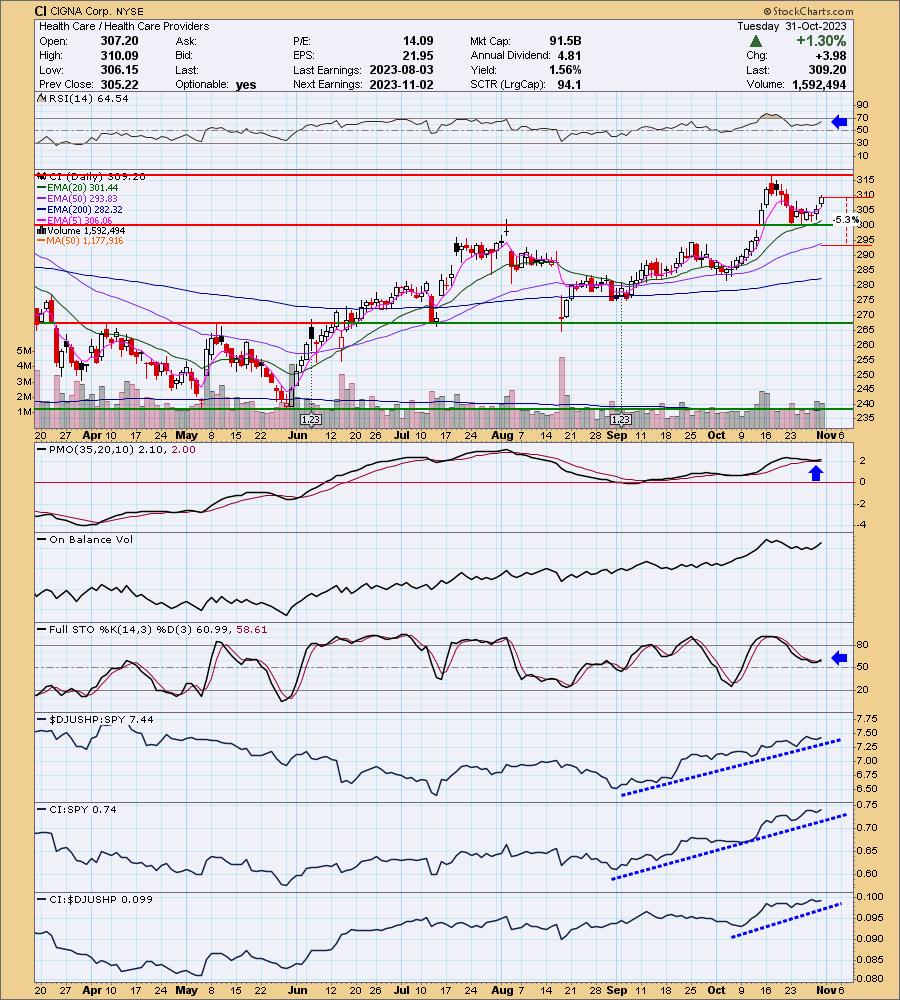
CI is unchanged in after hours trading. I like the way price found support and is now pulling away, breaking the short-term declining trend. The RSI is positive and there is a PMO Surge above the signal line. Stochastics have turned up in positive territory. Relative strength has been hot for two months on this group and CI is one of the better performers. It has certainly been outpacing the SPY. The one issue is that it does report earnings on Thursday so you may want to hold off on it until you see how it reacts. The stop is set close to the 50-day EMA at 5.3% or $292.81.
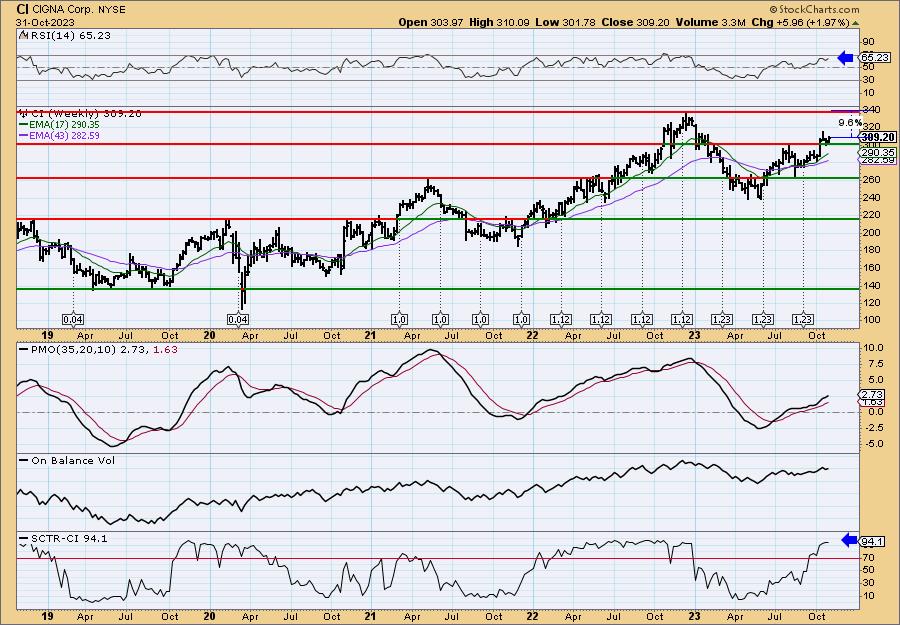
The weekly chart is quite favorable and suggests this one could be an intermediate-term investment not just a short-term trade. The weekly RSI is positive and not overbought. The weekly PMO is rising and is also not overbought. The StockCharts Technical Rank (SCTR) is at the top of the hot zone* above 70. It is near 52-week highs so consider an upside target of about 17% to $361.76.
*If a stock is in the "hot zone" above 70, it implies that it is stronger than 70% of its universe (large-, mid-, small-caps and ETFs) primarily in the intermediate to long terms.
MercadoLibre Inc. (MELI)
EARNINGS: 11/01/2023 (AMC) ** REPORTS TOMORROW **
MercadoLibre, Inc. engages in the development of an online commerce platform with a focus on e-commerce and related services. It operates through the following geographical segments: Brazil, Argentina, Mexico, and Other Countries. The Other Countries segment refers to Chile, Colombia, Costa Rica, Dominican Republic, Ecuador, Panama, Peru, Bolivia, Honduras, Nicaragua, El Salvador, Guatemala, Paraguay, Uruguay, and the United States of America. Its products provide a mechanism for buying, selling, and paying as well as collecting, generating leads, and comparing lists through e-commerce transactions. The company was founded by Marcos Eduardo Galperin on October 15, 1999 and is headquartered in Montevideo, Uruguay.
Predefined Scans Triggered: P&F Double Top Breakout.
MELI is down -0.08% in after hours trading. I like the breakout from the declining trend. It managed to trade above the 50-day EMA today. The 20/50-day EMAs are above the 200-day EMA so it does have a slightly bullish bias. The RSI is positive and rising. There is a new PMO Crossover BUY Signal in oversold territory. Stochastics are rising in positive territory. The group is seeing outperformance and MELI is outperforming both the group and the SPY. I set the stop beneath that last low at 6.1% or $1165.05.

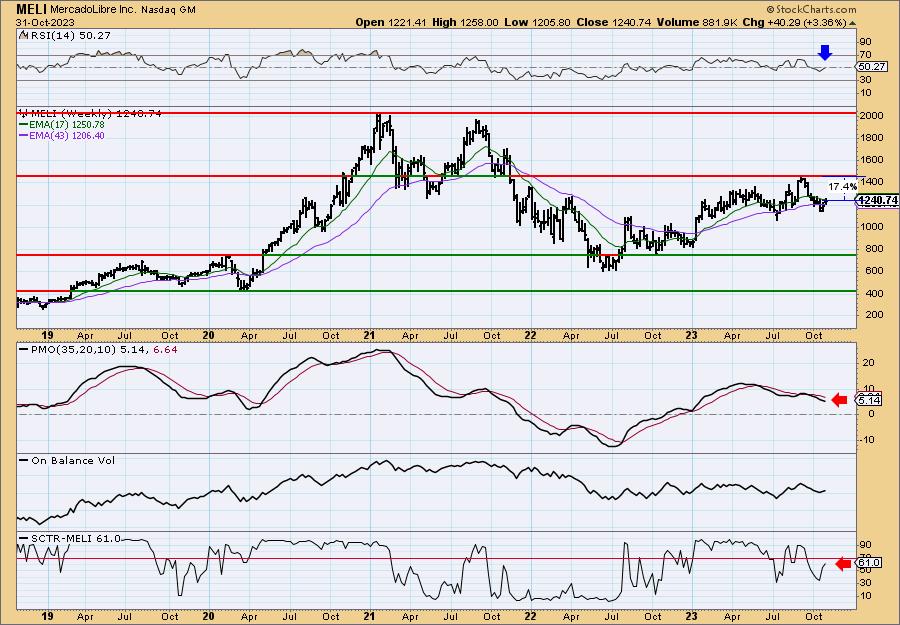
The weekly chart is mixed so keep this one in the short-term timeframe. The weekly RSI just moved into positive territory, but the weekly PMO is in decline. The SCTR is rising but isn't in the hot zone yet. I would set my upside target along resistance.
Range Resources Corp. (RRC)
EARNINGS: 02/26/2024 (AMC)
Range Resources Corp. engages in the exploration, development and acquisition of natural gas and oil properties in the Appalachian and Midcontinent regions. The company was founded in 1976 and is headquartered in Fort Worth, TX.
Predefined Scans Triggered: Elder Bar turned Green, Improving Chaikin Money Flow, New 52-week Highs, Stocks in a New Uptrend (Aroon), Moved Above Upper Price Channel, Parabolic SAR Buy Signals, P&F Ascending Triple Top Breakout and P&F Double Top Breakout.
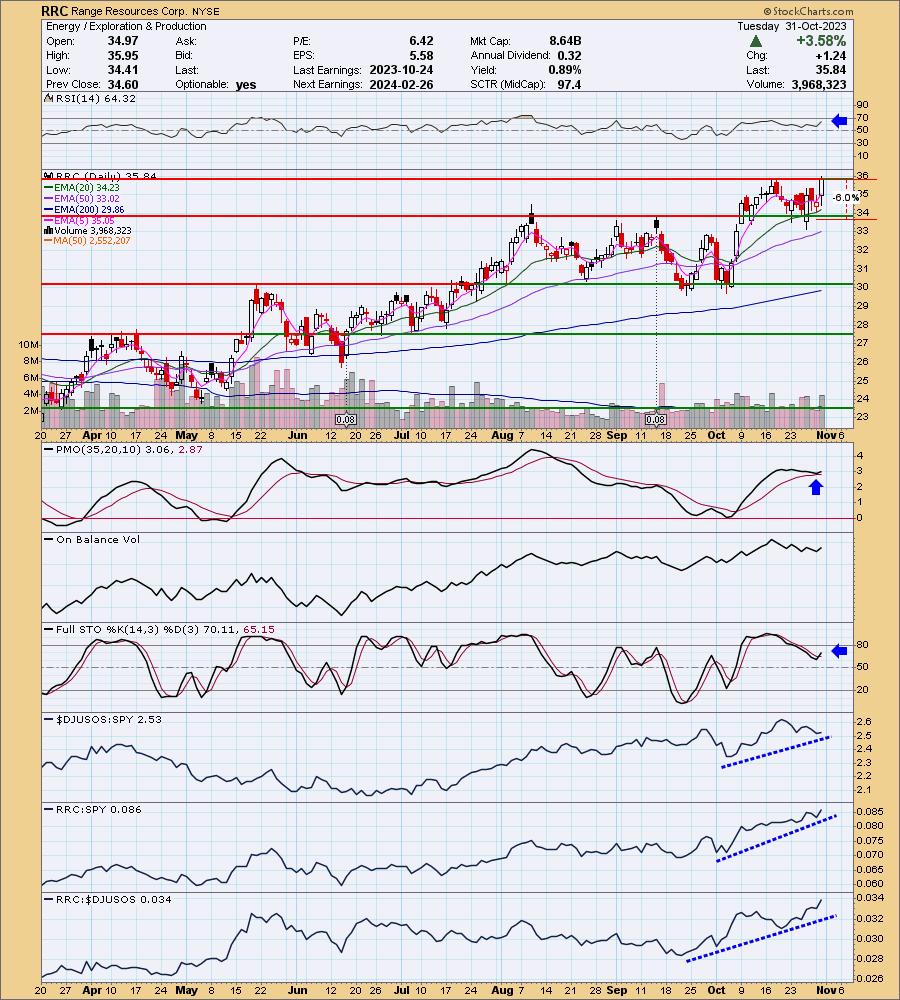
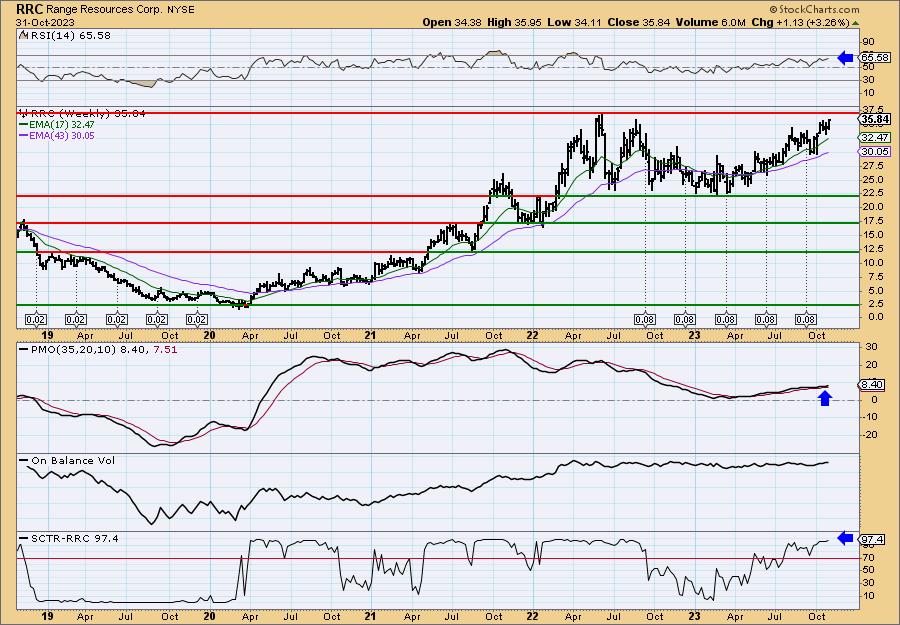
RRC is up +0.31% in after hours trading. It broke out today after a brief period to consolidate the prior rally. I like that the EMAs are configured bullishly with the fastest on top and slowest on the bottom. This is a stock with a clear bullish bias. The PMO has surged above the signal line. Stochastics have turned back up. The group hasn't performed that well the last part of this month, but overall it is still outpacing the SPY. RRC is showing great relative strength. The stop is set below support at 6% or $33.68.
The weekly chart suggests this could be an intermediate-term investment. All of the indicators are configured positively. The weekly RSI is in positive territory and isn't overbought. The weekly PMO is rising on a Crossover BUY Signal. The SCTR is at the top of the hot zone. Consider an upside target around 17% or $41.93.
Timken Steel Corp. (TMST)
EARNINGS: 11/02/2023 (AMC) ** Reports Thursday **
TimkenSteel Corp. engages in the manufacture of alloy, carbon and micro-alloy steel products. The firm's products includes special bar quality steel, seamless mechanical tubing, gears, grades of steel, jumbo bloom vertical caster, TimkenSteel ultrapremium technology, and TimkenSteel endurance steels. Its services include thermal treatment, value added components, technical support and testing, supply chain, and TimkenSteel portal. The company was founded on October 24, 2013 and is headquartered in Canton, OH.
Predefined Scans Triggered: Bullish MACD Crossovers.
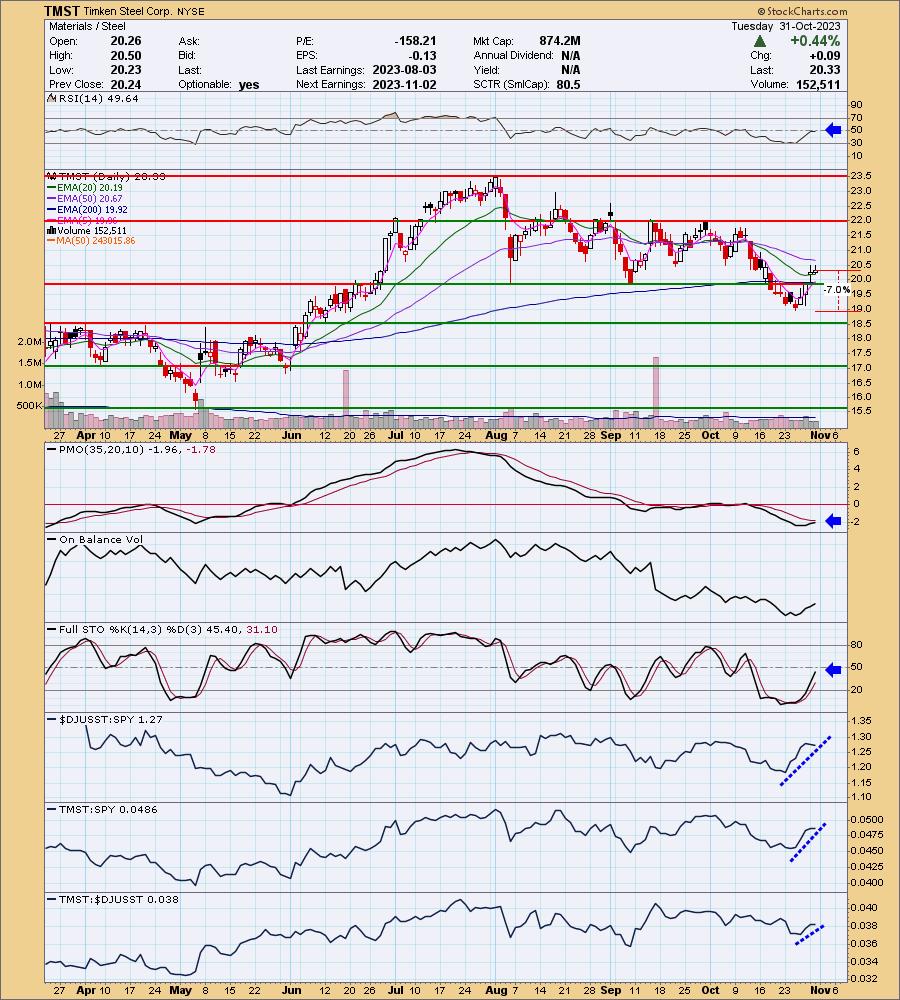
TMST is unchanged in after hours trading. This wasn't one of the symbols I mined on Friday, but it came up in two of my scans today. I note that it is showing some new relative strength against the group. The RSI is not positive yet, but another rally day and it will be. The PMO is nearing a Crossover BUY Signal. Stochastics are rising strongly. As already noted, the group is outperforming and TMST is outperforming it and consequently the SPY. The stop is set below support at 7% or $18.90.
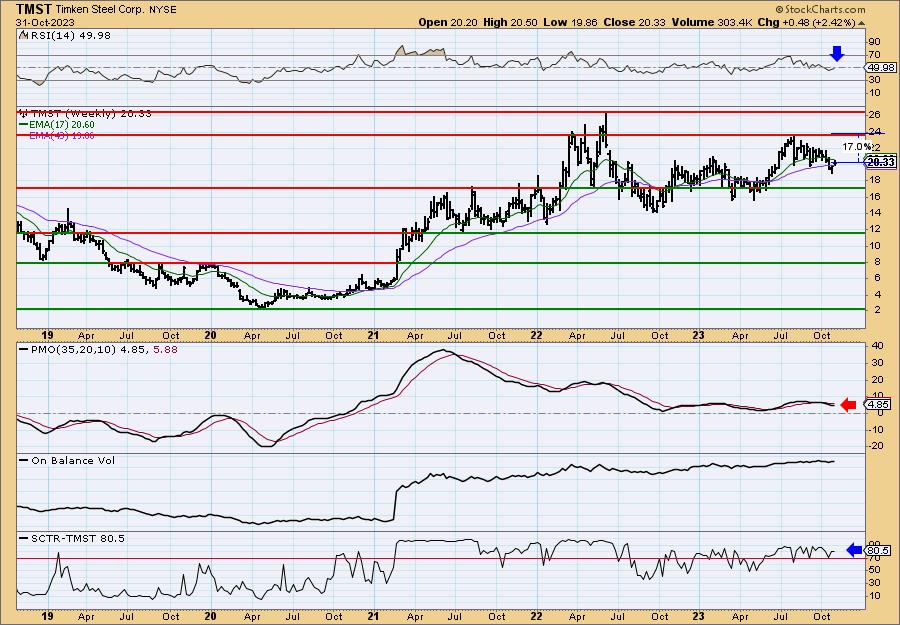
The weekly chart could use some help given the weekly PMO is on a Crossover SELL Signal, but it isn't terrible. I'd still keep this one in the short-term timeframe. The RSI is negative, although it is nearly in positive territory. The SCTR is in the hot zone, so we could see some improvement. If it can recapture the 2023 top it would be a 17% gain.
Don't forget, on Thursdays I look at reader-requested symbols, click HERE to send me an email. I read every email I receive and try to answer them all!
Current Market Outlook:
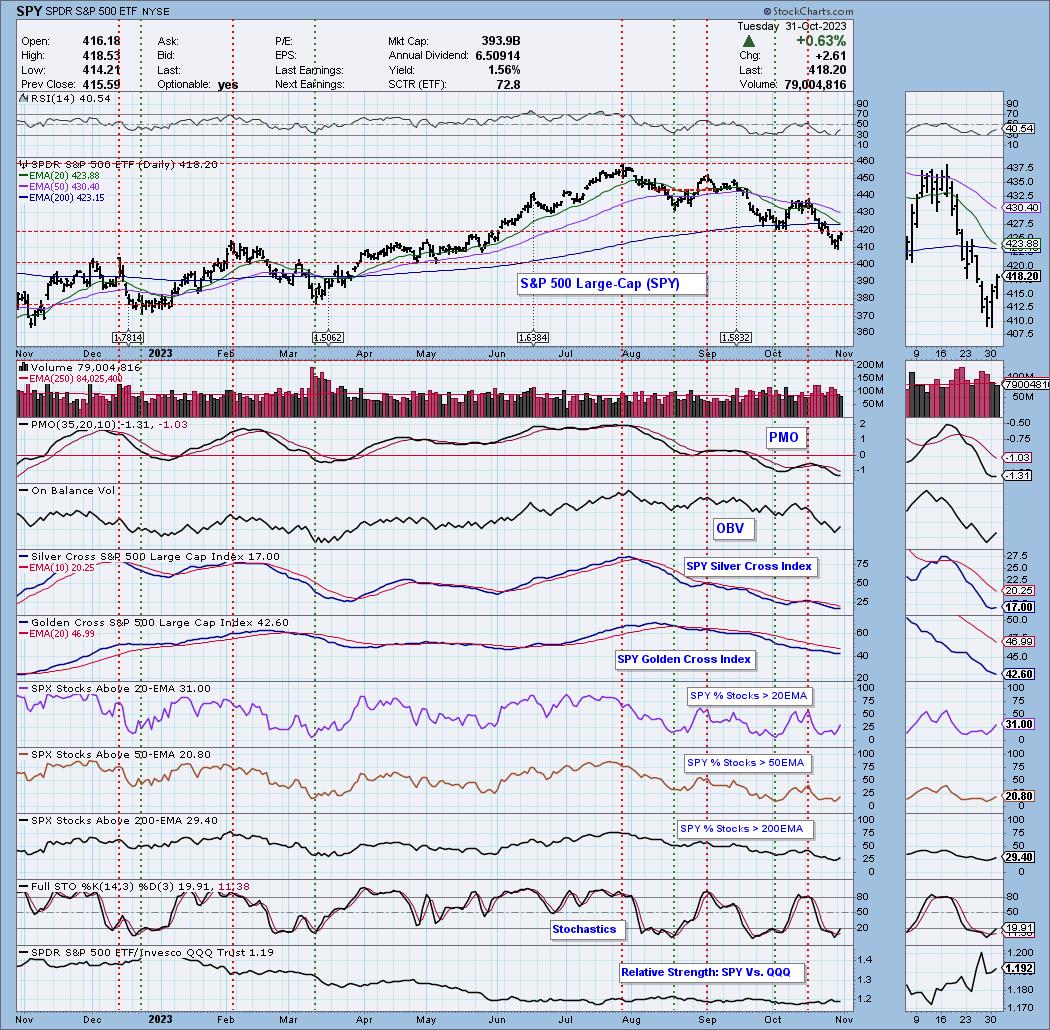
Market Environment: It is important to consider the odds for success by assessing the market tides. The following chart uses different methodologies for objectively showing the depth and trend of participation for intermediate- and long-term time frames.
- The Silver Cross Index (SCI) shows the percentage of SPX stocks on IT Trend Model BUY signals (20-EMA > 50-EMA)
- The Golden Cross Index (GCI) shows the percentage of SPX stocks on LT Trend Model BUY signals (50-EMA > 200-EMA)
Don't forget that as a "Diamonds" member, you have access to our GCI/SCI curated ChartList on DecisionPoint.com. You'll find it under "Members Only" links on the left side on the Blogs and Links Page.
Here is the current chart:
Full Disclosure: I am 20% long, 10% short.
I'm required to disclose if I currently own a stock I mention and/or may buy/short it within the next 72 hours.
"Technical Analysis is a windsock, not a crystal ball." - Carl Swenlin
(c) Copyright 2023 DecisionPoint.com
Watch the latest episode of DecisionPoint Trading Room with Carl & Erin Swenlin on Mondays 3:00p EST or on the DecisionPoint playlist on the StockCharts TV YouTube channel here!
NOTE: The stocks reported herein are from mechanical trading model scans that are based upon moving average relationships, momentum and volume. DecisionPoint analysis is then applied to get five selections from the scans. The selections given should prompt readers to do a chart review using their own analysis process. This letter is not a call for a specific action to buy, sell or short any of the stocks provided. There are NO sure things or guaranteed returns on the daily selection of "Diamonds in the Rough."
Regarding BUY/SELL Signals: The signal status reported herein is based upon mechanical trading model signals and crossovers. They define the implied bias of the price index/stock based upon moving average relationships and momentum, but they do not necessarily call for a specific action. They are information flags that should prompt chart review. Further, they do not call for continuous buying or selling during the life of the signal. For example, a BUY signal will probably (but not necessarily) return the best results if action is taken soon after the signal is generated. Additional opportunities for buying may be found as price zigzags higher, but the trader must look for optimum entry points. Conversely, exit points to preserve gains (or minimize losses) may be evident before the model mechanically closes the signal.
Helpful DecisionPoint Links:
Price Momentum Oscillator (PMO)
Swenlin Trading Oscillators (STO-B and STO-V)
For more links, go to DecisionPoint.com