
The market had a great breakout yesterday and today it consolidated the move. We are in the bearish camp for now, but our ready to pivot if necessary. The internals are still very weak so continue to be careful out there. As a reminder, I am only 16% long and I'm 7% short.
I decided after reviewing the charts that all of this week's "Diamonds in the Rough" have potential to move higher. Some aren't doing much, but in all cases, the PMO is still rising.
This week's "Darling" hit it big. Cracker Barrel (CBRL) was up 5.58% after being picked on Tuesday. We'll review why this chart was good and why it is getting better. This week's "Dud" was EQT Corp (EQT). Crude Oil likely had a big factor in the loss.
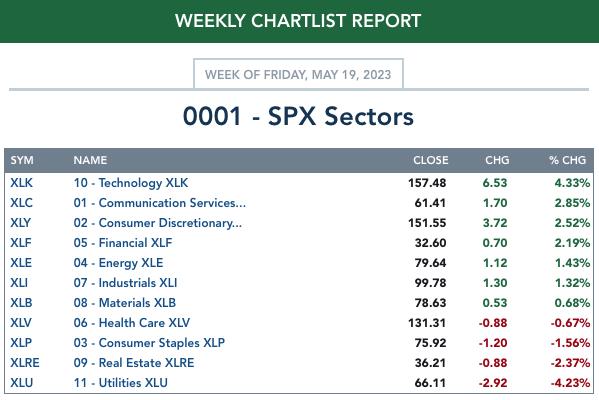
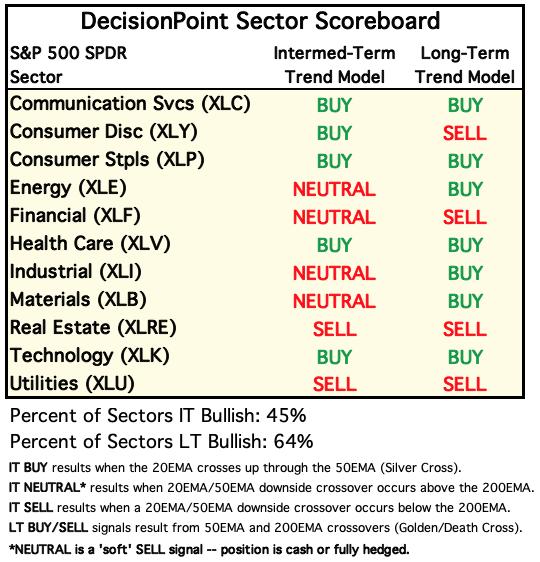
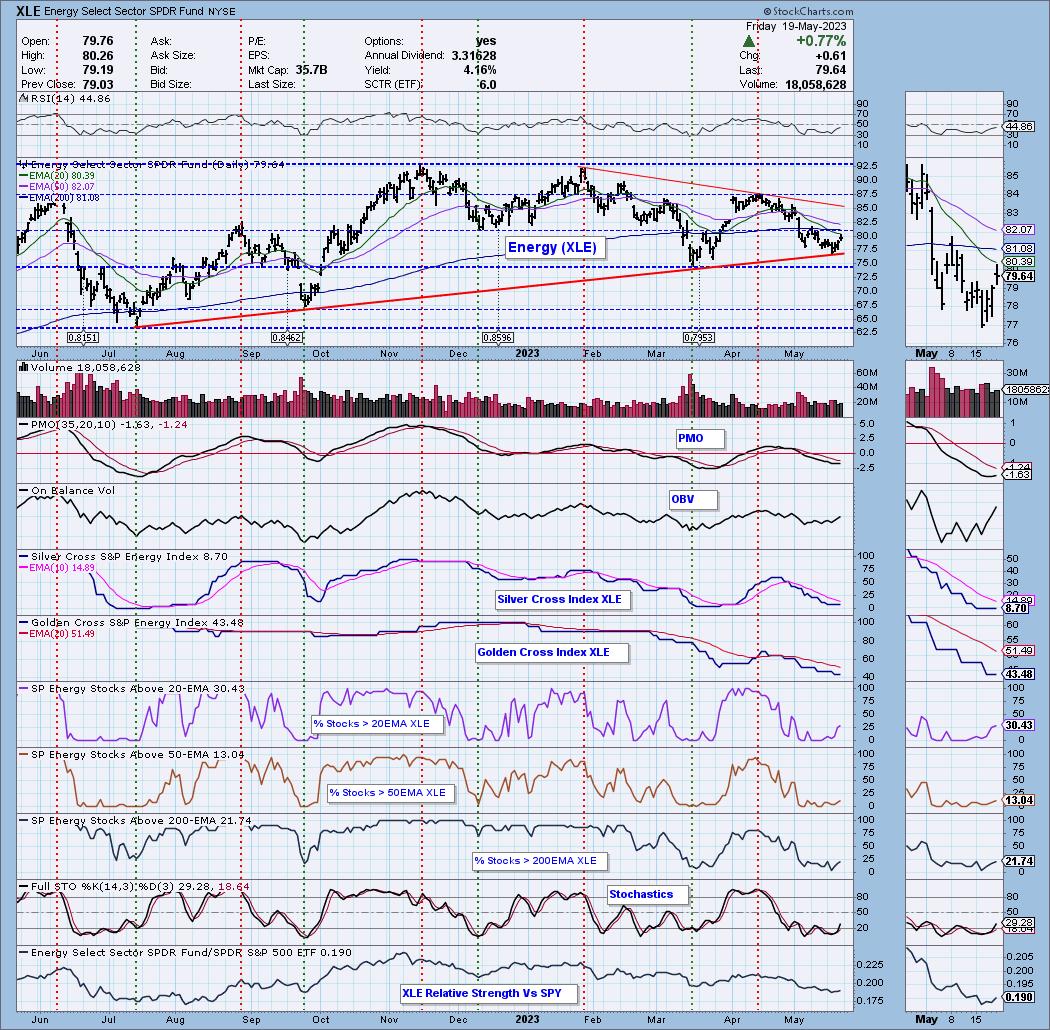
This week's Sector to Watch ultimately turned out to be Energy (XLE). Granted this sector has very low participation, but it is showing new momentum. The runner-up was Technology (XLK), but I decided that it looked too overbought.
Hope you have a great weekend!
Good Luck & Good Trading,
Erin

RECORDING LINK (5/19/2023):
Topic: DecisionPoint Diamond Mine (5/19/2023) LIVE Trading Room
Passcode: May#19th
REGISTRATION for 5/26/2023:
When: May 26, 2023 09:00 AM Pacific Time (US and Canada)
Topic: DecisionPoint Diamond Mine (5/26/2023) LIVE Trading Room
Register in advance for this webinar HERE
After registering, you will receive a confirmation email containing information about joining the webinar.

Our latest DecisionPoint Trading Room recording (5/15/2023):
A few items about the spreadsheet: I've put on the spreadsheet whether the RSI is positive (green) or negative (red). The PMO column tells you if it is rising (green) or falling (red). Finally I've added my own "Sparkle Factor" that gives you my assessment going forward, bullish (green), bearish (red) or neutral (gray). The Sparkle Factor is basically my thoughts on whether I expect it to rise or fall. A neutral means it could really go either way so it could be added to a watch list. If you're in a stock I consider "neutral" going forward, the ball is in your court.
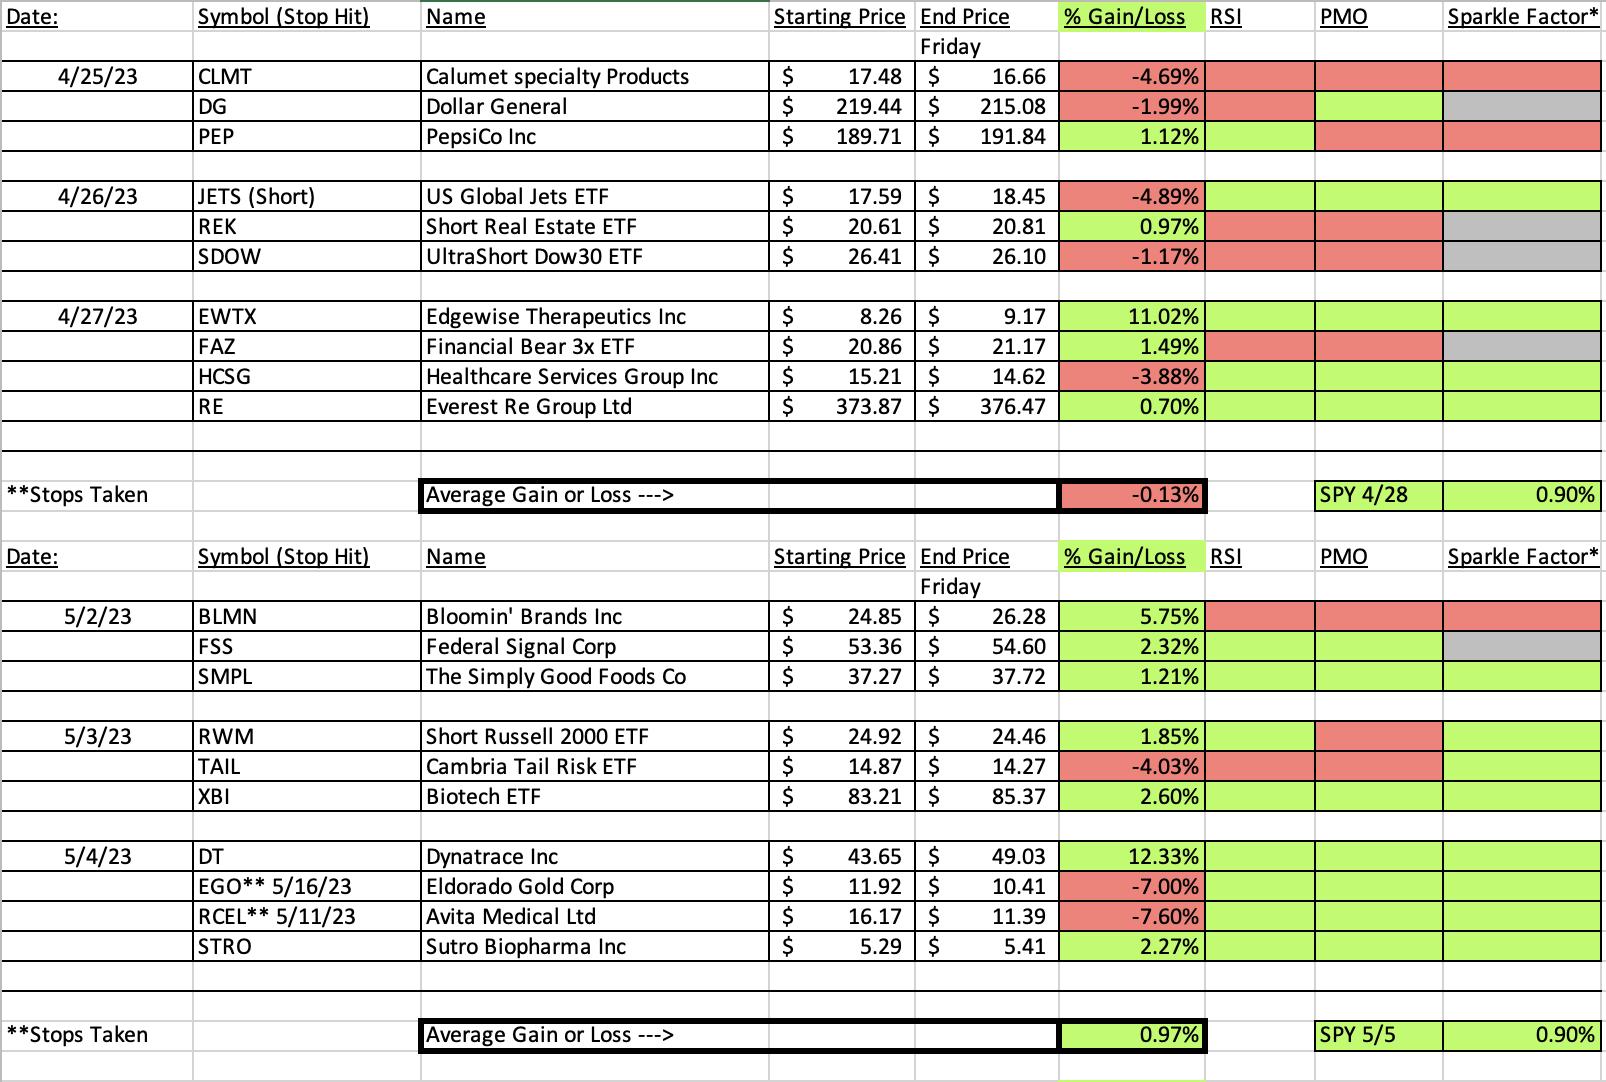
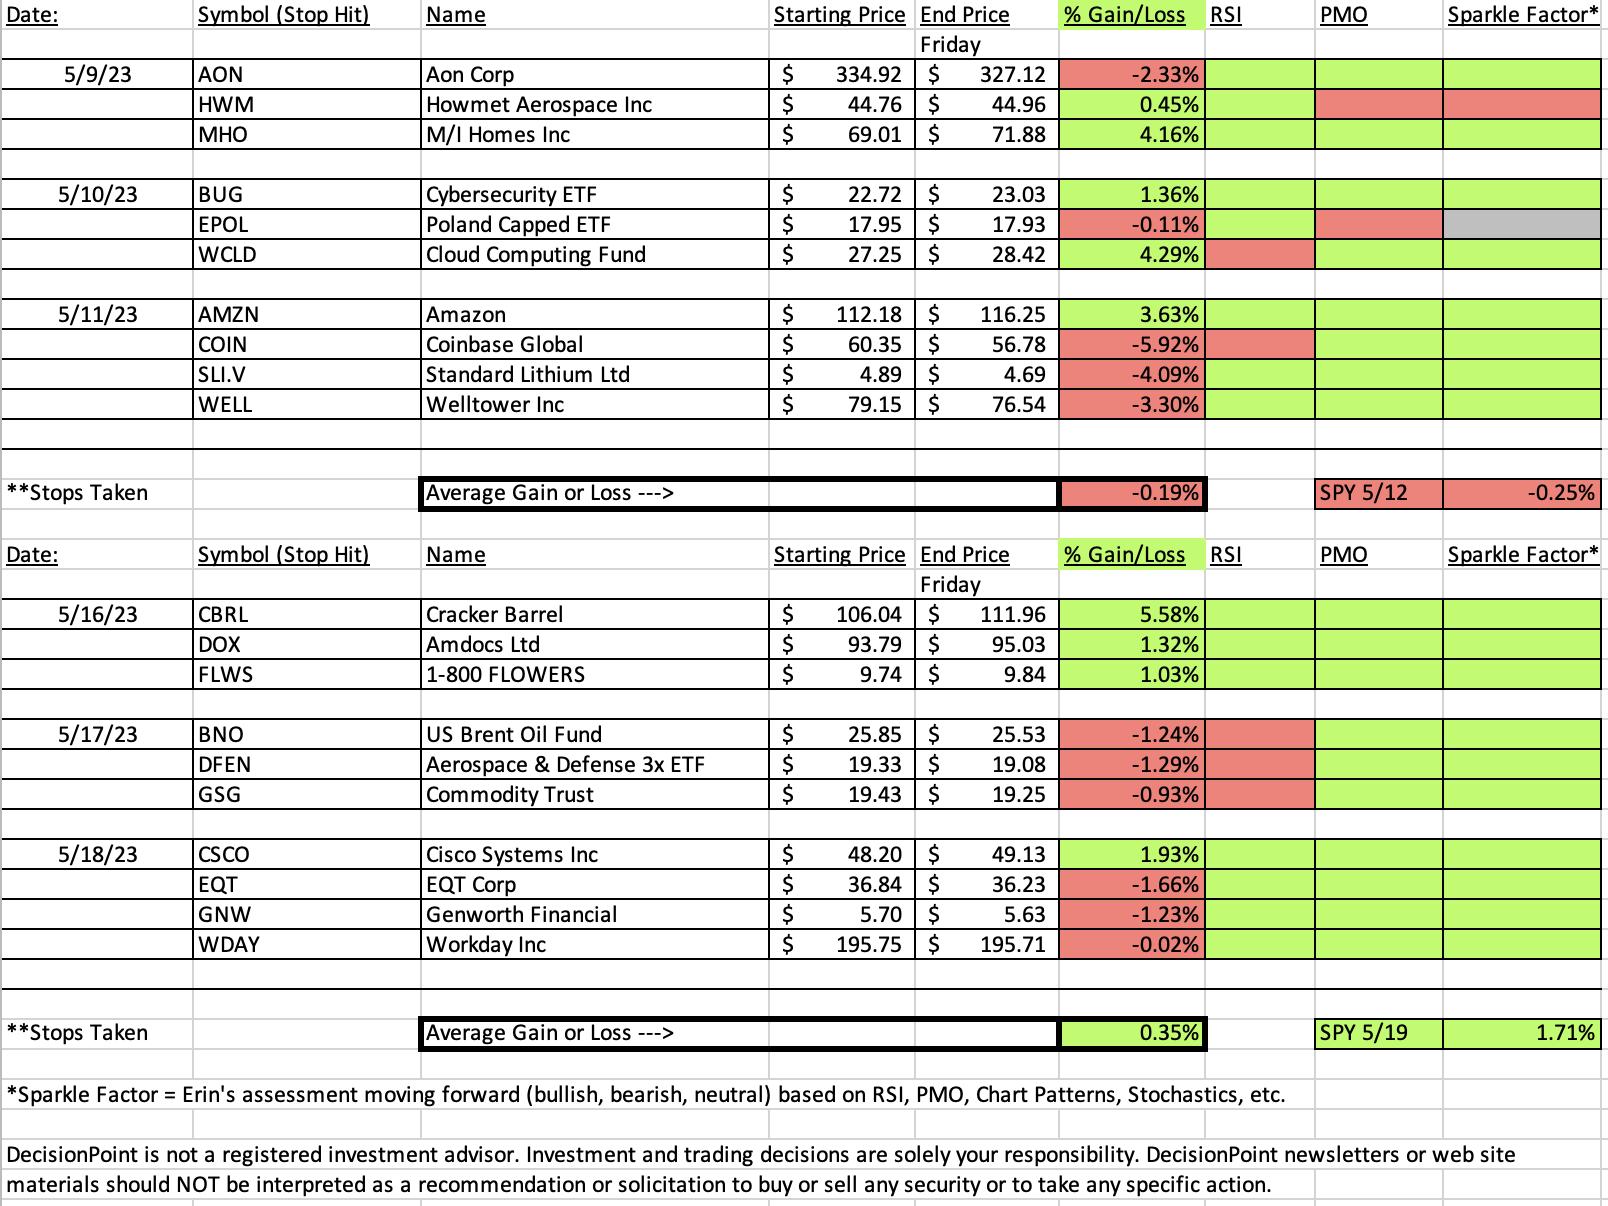
Darling:
Cracker Barrel Old Country Store, Inc. (CBRL)
EARNINGS: 06/07/2023 (BMO)
Cracker Barrel Old Country Store, Inc. engages in the operation and development of restaurant and retail outlets. The format of its stores consists of a trademarked rustic old country-store design that offers restaurant menu featuring home-style country food. The company was founded by Dan W. Evins on September 19, 1969 and is headquartered in Lebanon, TN.
Predefined Scans Triggered: Bearish Harami and P&F Low Pole.
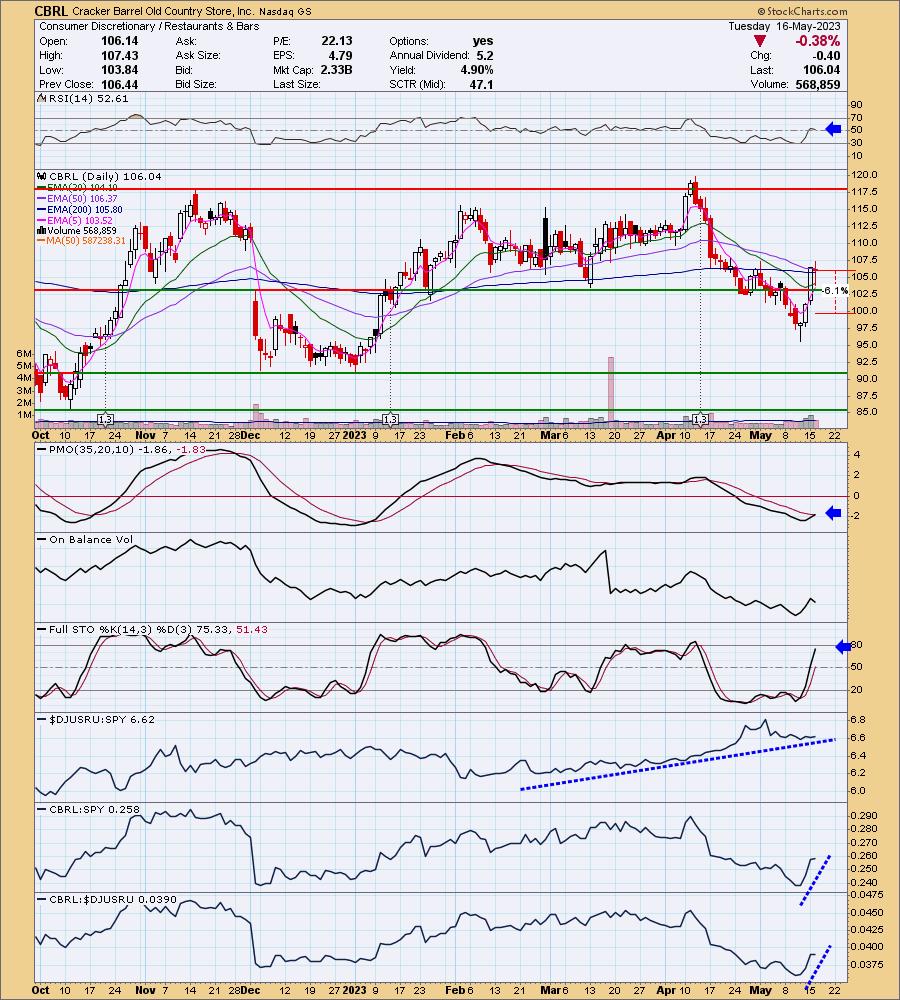
Below are the commentary and chart from Tuesday (5/16):
"CBRL is up +0.38% in after hours trading. This one has been in deep decline and is now forcefully rallying. This has formed a bullish "V" Bottom pattern. The expectation of the pattern once it retraces 1/3rd of the left side of the "V", you can then expect a breakout from resistance formed at the top of the left side of the "V". Other bullish characteristics are the positive RSI (in spite of a decline today), a PMO BUY Signal on tap and rising Stochastics in positive territory. Relative strength has reversed higher for CBRL and the industry group is outperforming the SPY. I've set the stop at about 6.1% or $99.57."
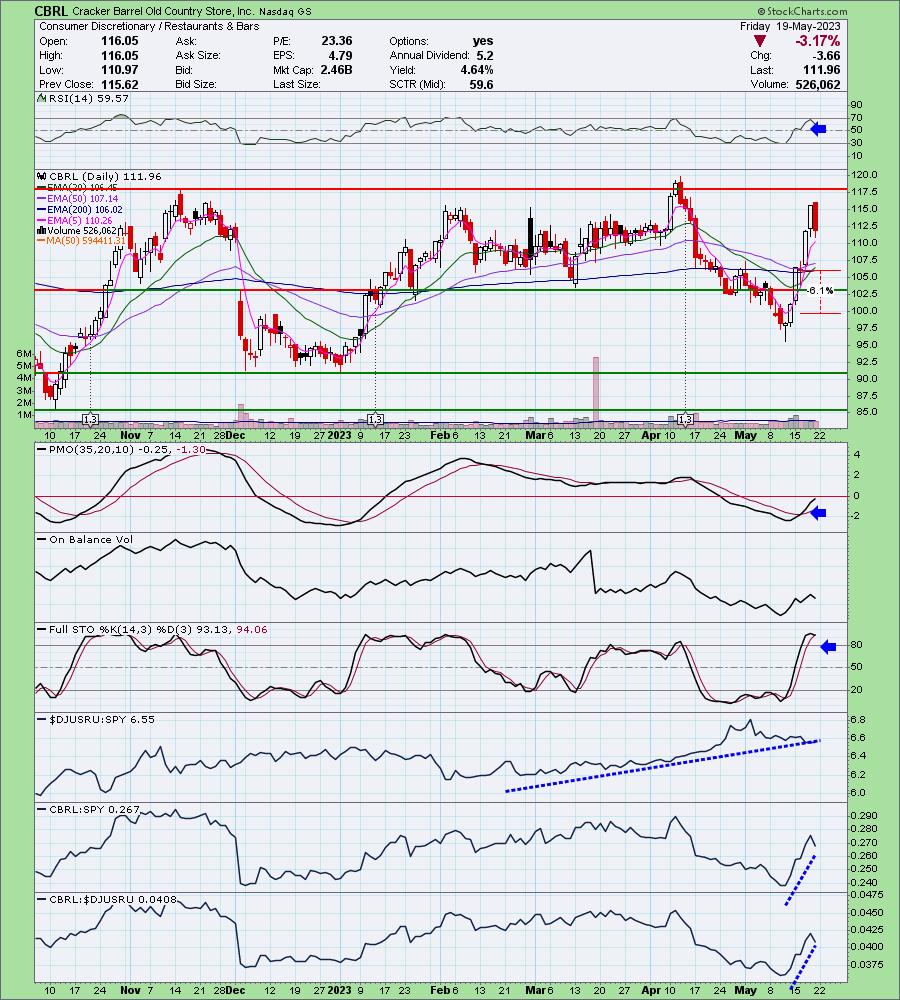
Here is today's chart:
I believe CBRL still has more rally to come, unfortunately today it formed a bearish engulfing candlestick which implies another day of decline on Monday. This could afford you an opportunity to get in at a better price. The "V" bottom is getting close to fulfilling its promise of a breakout above $120. The RSI has moved out of overbought territory and is still positive. The PMO was unperturbed by today's decline. Stochastics did top, but remain comfortably 93.
Don't forget, on Thursdays I look at reader-requested symbols, so shoot me an email at erin@decisionpoint.com. I read every email I receive and try to answer them all!
Dud:
EQT Corp. (EQT)
EARNINGS: 07/26/2023 (AMC)
EQT Corp. is a natural gas production company, which engages in the supply, transmission, and distribution of natural gas. The company was founded in 1888 and is headquartered in Pittsburgh, PA.
Predefined Scans Triggered: P&F Bullish Catapult, Moved Above Upper Keltner Channel, Stocks in a New Uptrend (ADX), Moved Above Upper Bollinger Band, Moved Above Upper Price Channel, P&F Ascending Triple Top Breakout and P&F Double Top Breakout.
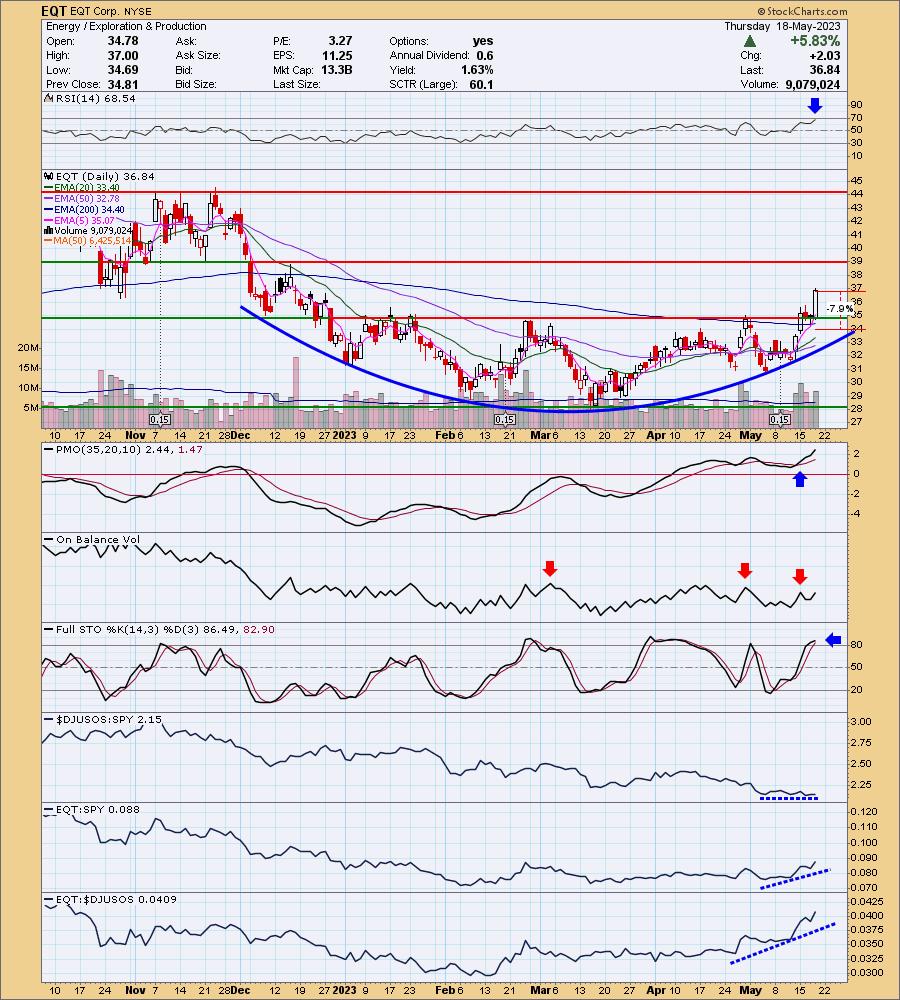
Below are the commentary and chart from Thursday (5/18):
"EQT is up +0.24% in after hours trading. There is a large saucer shaped bottom that is a bullish basing pattern. Today price broke out of the pattern. The RSI is positive and not yet overbought. The PMO is rising strongly on a Crossover BUY Signal. The OBV isn't confirming this breakout despite a high volume day. Why? The OBV is currently below its prior three tops. Price at those points was below the current price. That is a bearish reverse divergence. It isn't that strong, but it is there nonetheless. Stochastics are above 80. The group isn't outperforming yet, but EQT is doing just fine on its own which is no surprise given it is outperforming the group by a mile. The stop has to be set deeply due to today's big rally. I've chosen 7.9% or at $33.92."
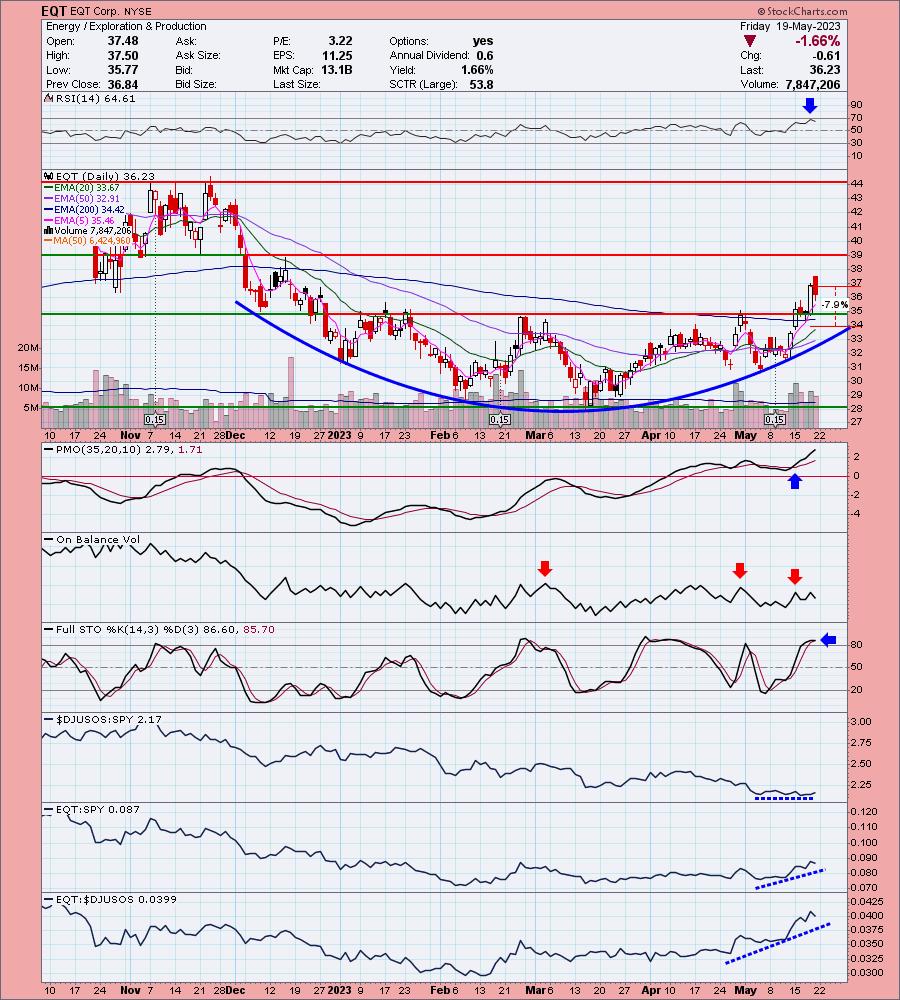
Here is today's chart:
EQT may not have had a great day, but the chart looks every bit as bullish as it did when it was picked yesterday. All of the bullish earmarks I discussed above are still there. The Energy sector looks ready to reverse so I believe this one still has plenty of upside potential.
THIS WEEK's Sector Performance:
DecisionPoint Sector Scoreboard (Mechanical Trend Model Signals):
Click Here to view Carl's annotated Under the Hood ChartList!
Sector to Watch: Energy (XLE)
This is a reversal play. Participation is weak with the Silver Cross Index reading below 9%. However, something is going on under the hood. Notice the new increase in stocks above their 20-day EMA. The rest of the indicators are maturing, but the PMO is now rising, as are Stochastics. Price has been in decline for some time so it makes sense that the RSI would be negative right now. It is on the rise. This is a very early pick, we don't have much in the way of confirmation of these new positive characteristics on the chart, but the ground work is being laid.
Industry Group to Watch: Exploration & Production (XOP)
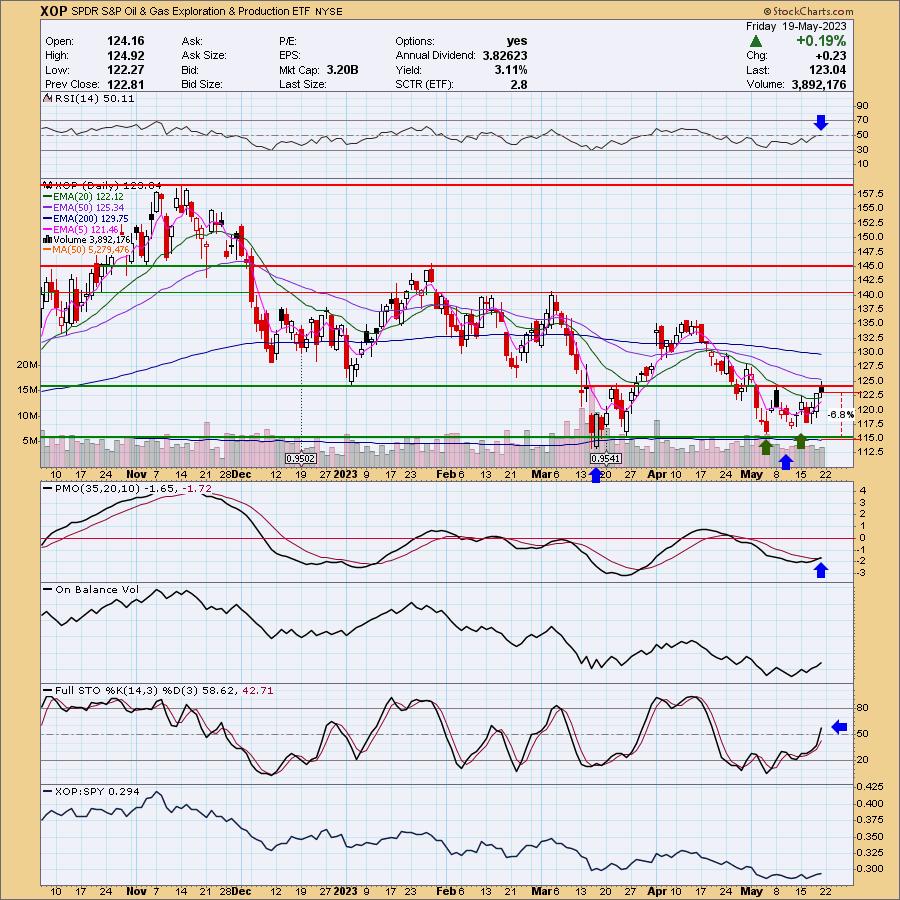
Fortunately, this industry group has a related ETF so I was able to offer that up today instead of the DJUS symbols which you can't trade. I spotted two bullish double-bottoms on the pattern. A short-term one that is denoted with green arrows and an intermediate-term one denoted by blue arrows. That's a pretty bullish setup. Add to that a brand new PMO Crossover BUY Signal, a now positive RSI and strongly rising Stochastics, and you have more evidence of an upcoming rally.
Go to our Sector ChartList on DecisionPoint.com to get an in-depth view of all the sectors. On StockCharts.com you can find the Industry Summary.
Good Luck & Good Trading!
- Erin
erin@decisionpoint.com
Full Disclosure: I'm 18% long, 7% short.
Watch the latest episode of the DecisionPoint Trading Room with Carl & Erin Swenlin on Mondays 3:00p EST!
Technical Analysis is a windsock, not a crystal ball. --Carl Swenlin
NOTE: The stocks reported herein are from mechanical trading model scans that are based upon moving average relationships, momentum and volume. DecisionPoint analysis is then applied to get selections from the scans. The selections given should prompt readers to do a chart review using their own analysis process. This letter is not a call for a specific action to buy, sell or short any of the stocks provided. There are NO sure things or guaranteed returns on the selection of "diamonds in the rough."
Helpful DecisionPoint Links:
DecisionPoint Shared ChartList and DecisionPoint Chart Gallery
Price Momentum Oscillator (PMO)
Swenlin Trading Oscillators (STO-B and STO-V)
(c) Copyright 2023 DecisionPoint.com