
Last Friday we selected Consumer Staples (XLP) as our "Sector to Watch". Utilities (XLU) is also performing well with plenty of strength beneath the surface. Both are defensive sectors and both are still producing some profitable trades. Today I'll be presenting two stocks from XLP that look bullish despite the bearish pall of the market right now.
The third stock is a Materials stock. I'm not thrilled with that sector, but the relative strength of the industry group to the sector is at relative lows and could be in a position to begin outperforming. The stock is certainly bullish enough, but as we know the path will often be cleared of possible stumbling blocks if the sector and the group are performing well already.
The market is looking very bearish overall to us right now, so be careful with expanding your portfolio. Personally, I'm happy at 34% exposure (includes 4% hedge) and have tightened some stops. I sense that until summer, the market will decline overall. Be careful out there!
Good Luck & Good Trading,
Erin
Today's "Diamonds in the Rough": CLMT, DG and PEP.
Runner-ups: EME, GWW, POST, MNST and TT.
** JULY VACATION **
I will be in Europe 7/14 - 7/27 so there will not be any Diamonds reports or trading rooms during that time. All subscribers with active subscriptions on 7/27 will be compensated with two weeks added to their renewal date.

RECORDING LINK (4/21/2023):
Topic: DecisionPoint Diamond Mine (4/21/2023) LIVE Trading Room
Passcode: April#21
REGISTRATION for 4/28/2023:
When: Apr 28, 2023 09:00 AM Pacific Time (US and Canada)
Topic: DecisionPoint Diamond Mine (4/28/2023) LIVE Trading Room
Register in advance for this webinar HERE
After registering, you will receive a confirmation email containing information about joining the webinar.

Here is the last recording (4/24):
Welcome to DecisionPoint Diamonds, wherein I highlight ten "Diamonds in the Rough" per week. These are selected from the results of my DecisionPoint Scans which search for stocks that could benefit from the trend and condition of the market. Remember, these are not recommendations to buy or sell, but are the most interesting of the stocks that surfaced in my scans. My objective is to save you the work of the initial, tedious culling process, but you need to apply your own analysis to see if these stocks pique your interest as well. There are no guaranteed winners here!
"Predefined Scans Triggered" are taken from StockCharts.com using the "Symbol Summary" option instead of a "SharpChart" on the workbench.
Stop levels are all rounded down.
Calumet Specialty Products Partners L.P. (CLMT)
EARNINGS: 05/05/2023 (BMO)
Calumet Specialty Products Partners LP engages in the production of specialty hydrocarbon products. It operates through the following segments: Specialty Products, Fuel Products and Corporate. The Specialty Products segment produces lubricating oils, solvents, waxes, synthetic lubricants and other products. The Fuel Products segment is involved in the processing of crude oil into fuel and fuel-related products, including unleaded gasoline, diesel, and jet fuel, asphalt and other products. The Corporate segment consists of general and administrative expenses not allocated to the specialty products or fuel products segments. The company was founded on September 27, 2005 and is headquartered in Indianapolis, IN.
Predefined Scans Triggered: New CCI Buy Signals, P&F High Pole, Parabolic SAR Buy Signals and Hanging Man.
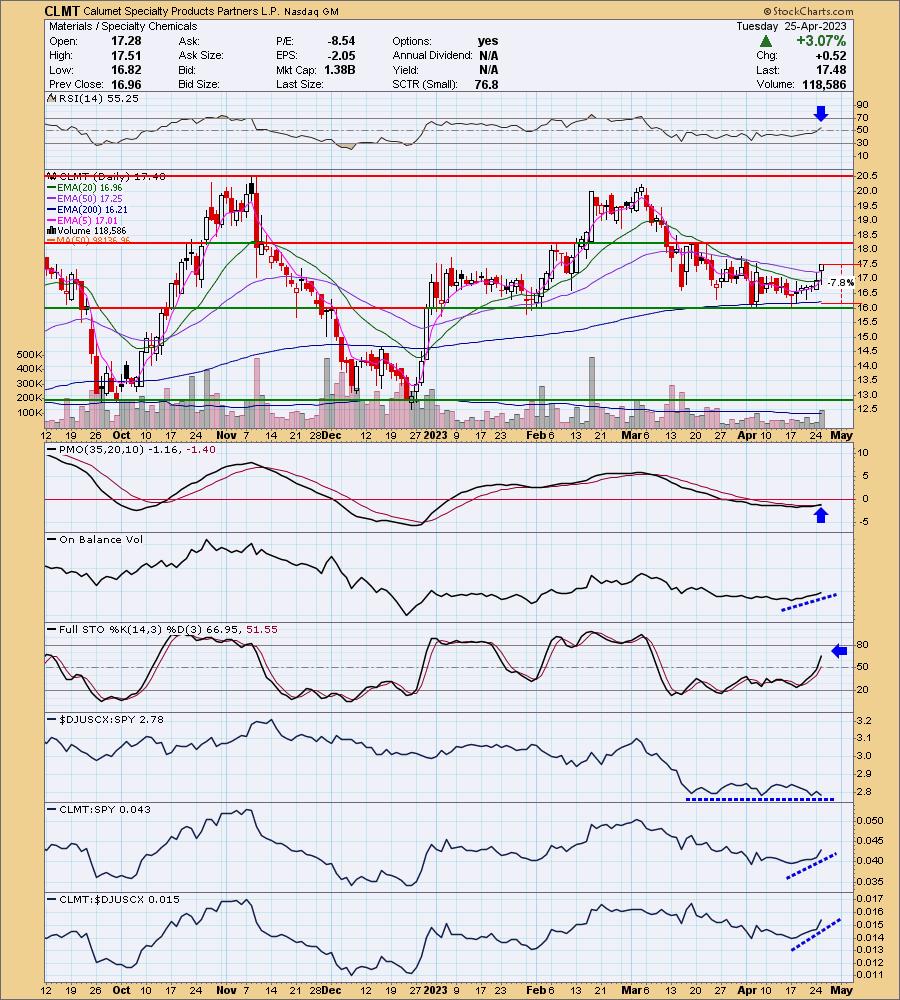
CLMT is down -2.23% in after hours trading. It appears to be taking much of today's gain back in after hours trading. Price broke the recent short-term declining trend on a thrust upward in price. This has moved the RSI into positive territory and the PMO has triggered a Crossover BUY Signal. The OBV is confirming the rally with a rise of its own. Stochastics are rising strongly. Relative strength is excellent for this stock. Relative strength of the group could definitely be better. However, the relative strength line is now at relative lows so a rebound relative strength is certainly possible here. The stop is set at 7.8% below the 200-day EMA or at $16.11.
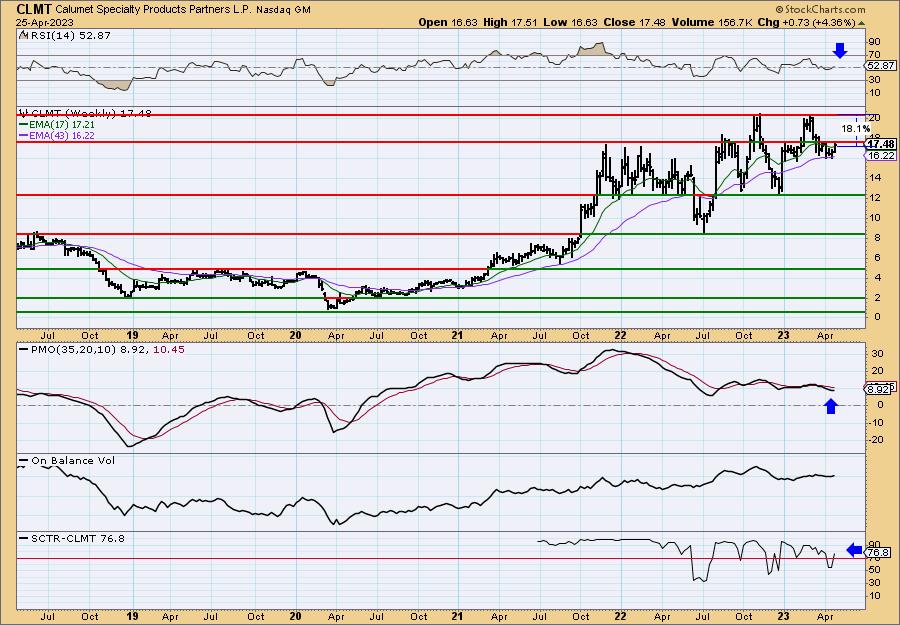
There is a long-term rising trend on the weekly chart. The weekly PMO is turning back up and the weekly RSI hit positive territory again. The SCTR is rising in the "hot zone"* above 70. Upside potential if it can reach this year's highs or all-time highs is over 18%.
*We call it the "hot zone" because it implies that the stock/ETF is in the top 30% of its "universe" (large-, mid-, small-caps and ETFs) as far as trend and condition, particularly in the intermediate and long terms.
Dollar General Corp. (DG)
EARNINGS: 05/25/2023 (BMO)
Dollar General Corp. engages in the operation of merchandise stores. Its offerings include food, snacks, health and beauty aids, cleaning supplies, basic apparel, housewares, and seasonal items. It sells brands including Clorox, Energizer, Procter & Gamble, Hanes, Coca-Cola, Mars, Unilever, Nestle, Kimberly-Clark, Kellogg's, General Mills, and PepsiCo. The company was founded by J. L. Turner and Hurley Calister Turner Sr. in 1939 and is headquartered in Goodlettsville, TN.
Predefined Scans Triggered: Elder Bar Turned Blue and P&F Low Pole.
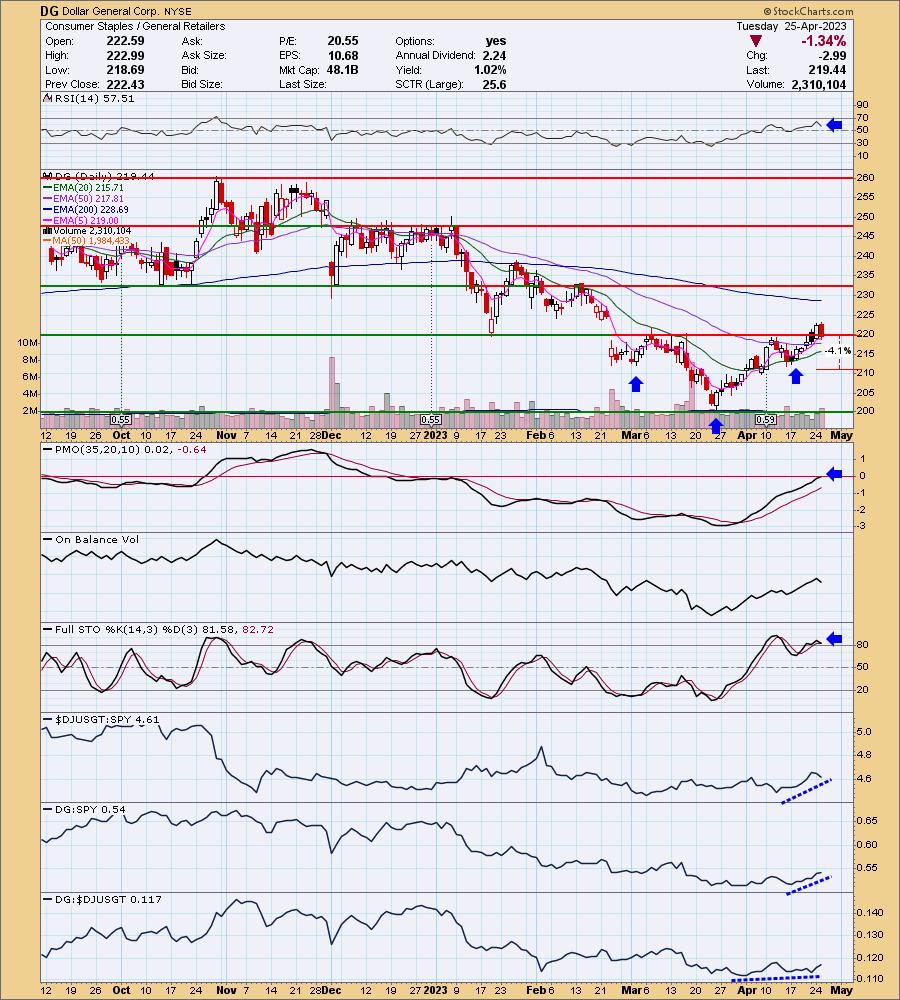
DG is down -0.02% in after hours trading. I mentioned this one to you on Friday. It is still bullish enough for a write up today. The nearly textbook reverse head and shoulders really caught my eye when I was reviewing the charts. It held support on today's pullback. The RSI is positive and today the PMO entered positive territory. Stochastics are oscillating above 80. The sector and group are outperforming, but most importantly, DG is outperforming the market right now. The stop can be set thinly at 4.1% or $210.44.
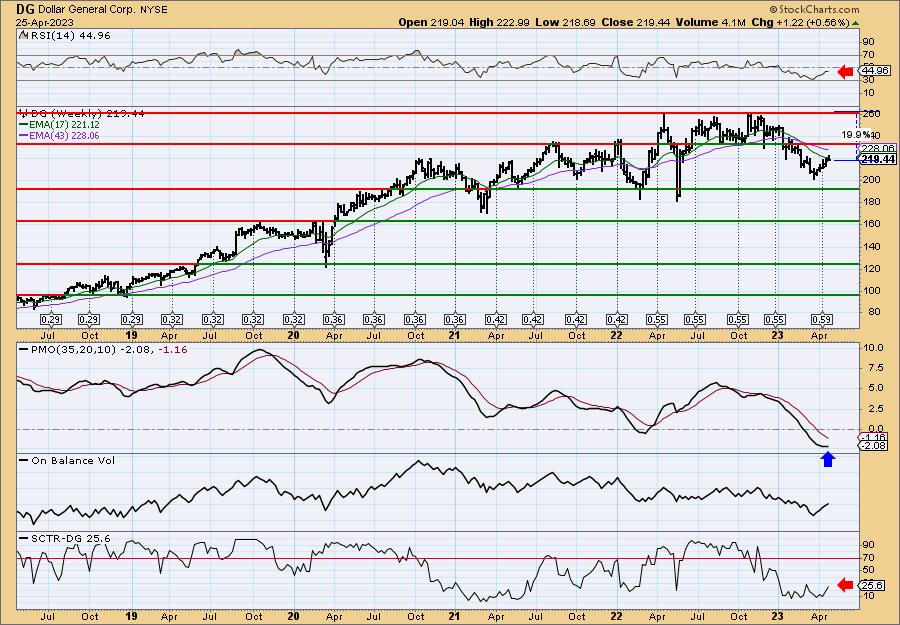
The weekly RSI is negative, but rising. I like that the PMO is turning up slowly in oversold territory. The SCTR is still very low so I would consider this more of a short-term investment...at least until the weekly RSI gets positive. If it can reach its all-time high, it would be an over 19.5% gain.
PepsiCo, Inc. (PEP)
EARNINGS: 04/25/2023 (BMO) ** REPORTED TODAY **
PepsiCo, Inc. engages in the manufacture, marketing, distribution, and sale of beverages, food, and snacks. It operates through the following business segments: Frito-Lay North America (FLNA), Quaker Foods North America (QFNA), PepsiCo Beverages North America (PBNA), Latin America (LatAm), Europe, Africa, Middle East, and South Asia (AMESA), and Asia Pacific, Australia and New Zealand, and China Region (APAC). The FLNA segment consists of branded convenient food businesses in the United States and Canada. The QFNA segment includes cereals, rice, and pasta under the Quaker, Pearl Milling Company, Quaker Chewy, Cap'n Crunch, Life, and Rice-A-Roni brands. The PBNA segment is composed of beverage concentrates, fountain syrups, and finished goods under various beverage brands such as Pepsi, Gatorade, Mountain Dew, Diet Pepsi, Aquafina, Diet Mountain Dew, Sierra Mist, and Mug. The LatAm segment covers beverage, food, and snack businesses in the Latin American region. The Europe segment offers beverage, food, and snack goods in Europe and Sub-Saharan Africa regions. The AMESA segment deals with all beverage and convenient food businesses in Africa, the Middle East, and South Asia. The APAC segment refers to all business operations in the Asia Pacific, Australia and New Zealand, and China region. The company was founded by Donald M. Kendall, Sr. and Herman W. Lay in 1965 and is headquartered in Purchase, NY.
Predefined Scans Triggered: Elder Bar Turned Green, Moved Above Upper Keltner Channel, New 52-week Highs, P&F Spread Triple Top Breakout, Moved Above Upper Bollinger Band, Moved Above Upper Price Channel and P&F Double Top Breakout.
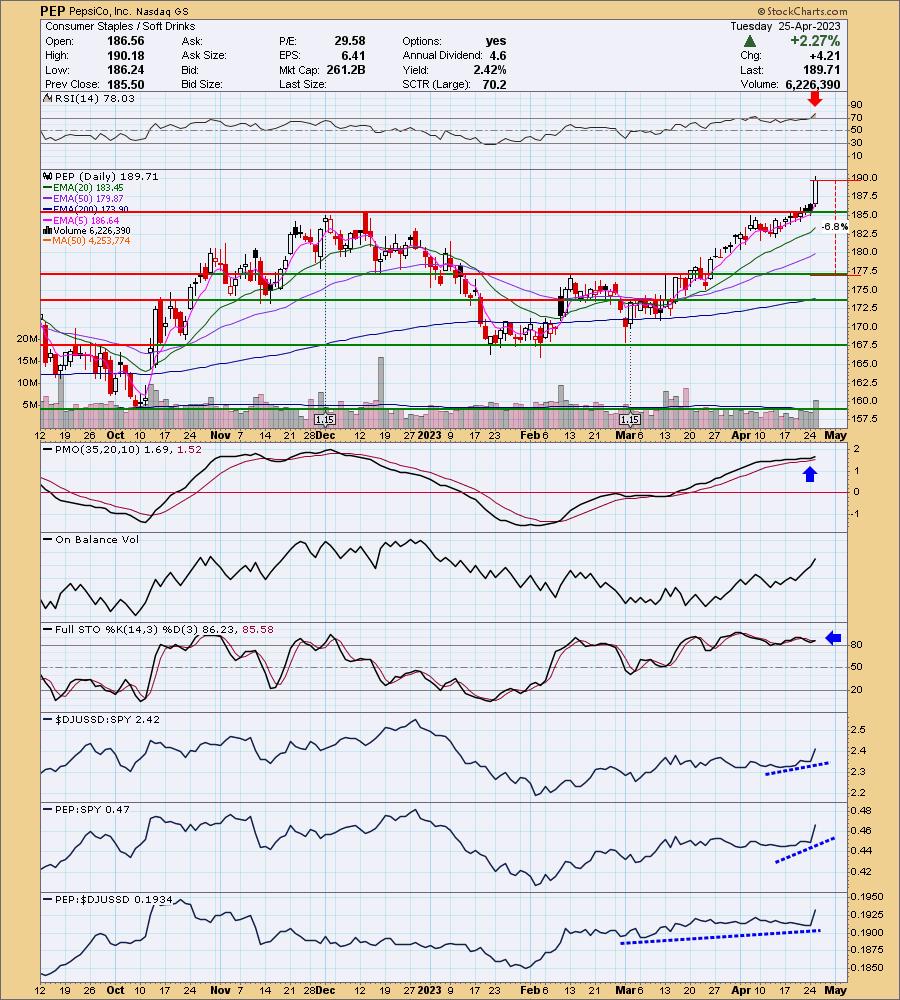
PEP is down -0.37% in after hours trading. Today's big rally can be attributed to earnings reported today. Investors liked what they saw/heard. The only problem with this chart is the very overbought RSI. The RSI is still rising though and this does have the appearance of a winner that will keep on winning. We have a PMO "Surge" or bottom above the signal line. The OBV is confirming the rally. Stochastics are rising and have been above 80 since March. Relative strength is kicking into high gear for the group and PEP. The stop is set below support at the February high at 6.8% or $176.80.
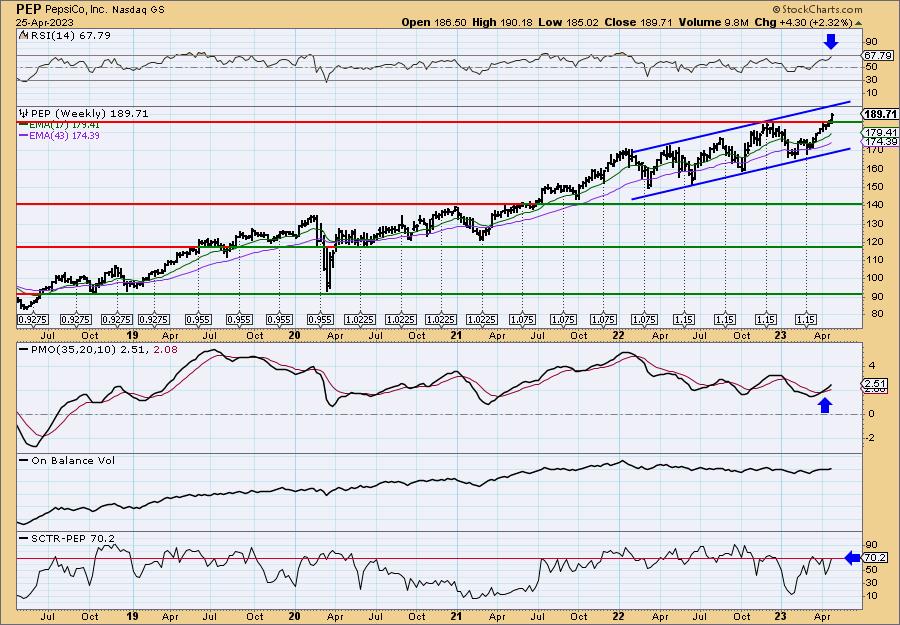
The weekly chart is strong so you may be able to hold PEP in the intermediate term. It has been in a nice rising trend channel. My one concern is it is near the top of the channel and may need a trip lower once it hits that level. The weekly RSI is positive, rising and not overbought. The weekly PMO is on an oversold Crossover BUY Signal. The SCTR just entered the "hot zone". I would consider a 17% upside target around $221.96.
Don't forget, on Thursdays I look at reader-requested symbols, click HERE to send me an email. I read every email I receive and try to answer them all!
Current Market Outlook:
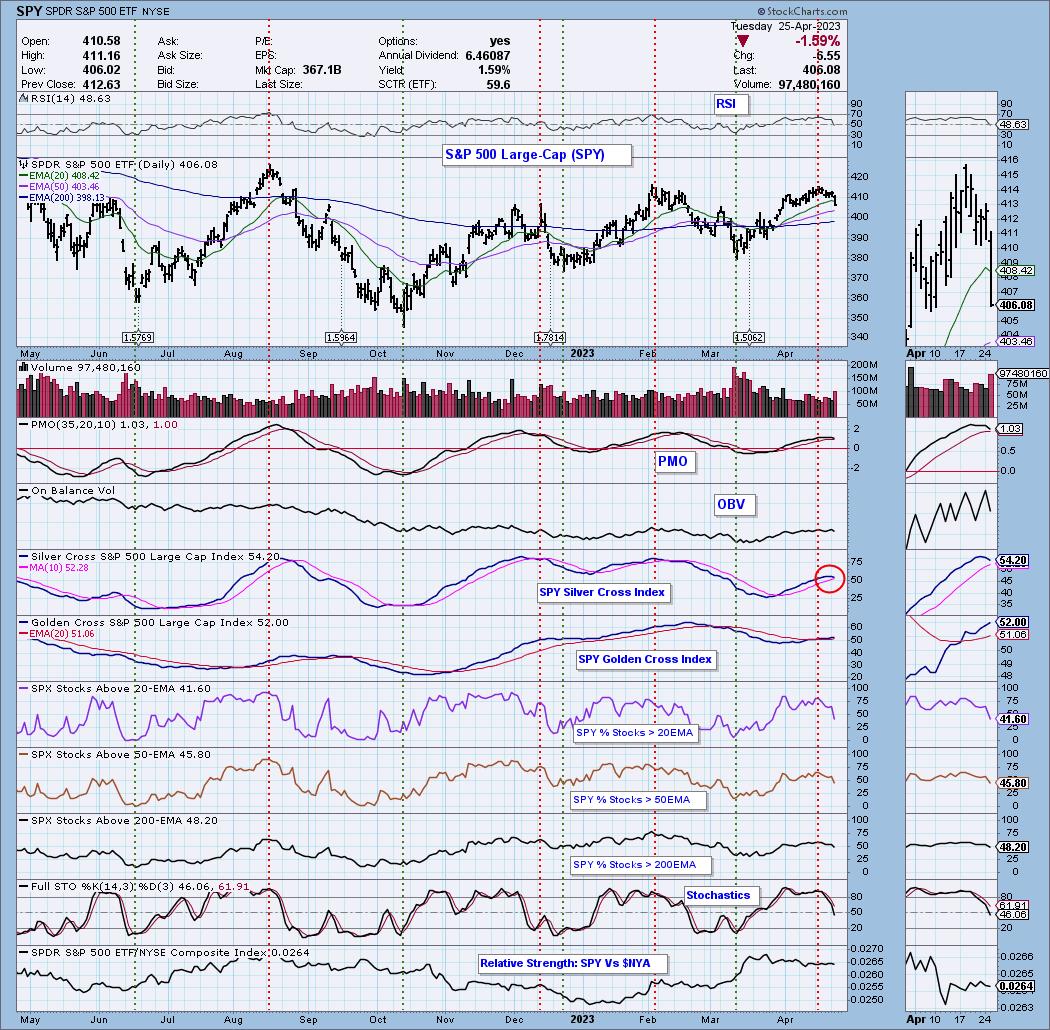
Market Environment: It is important to consider the odds for success by assessing the market tides. The following chart uses different methodologies for objectively showing the depth and trend of participation for intermediate- and long-term time frames.
- The Silver Cross Index (SCI) shows the percentage of SPX stocks on IT Trend Model BUY signals (20-EMA > 50-EMA)
- The Golden Cross Index (GCI) shows the percentage of SPX stocks on LT Trend Model BUY signals (50-EMA > 200-EMA)
Don't forget that as a "Diamonds" member, you have access to our GCI/SCI curated ChartList on DecisionPoint.com. You'll find it under "Members Only" links on the left side on the Blogs and Links Page.
Here is the current chart:
Full Disclosure: I am 30% long, 4% short.
I'm required to disclose if I currently own a stock I mention and/or may buy/short it within the next 72 hours.
"Technical Analysis is a windsock, not a crystal ball." - Carl Swenlin
(c) Copyright 2023 DecisionPoint.com
Watch the latest episode of DecisionPoint Trading Room with Carl & Erin Swenlin on Mondays 7:00p EST or on the DecisionPoint playlist on the StockCharts TV YouTube channel here!
NOTE: The stocks reported herein are from mechanical trading model scans that are based upon moving average relationships, momentum and volume. DecisionPoint analysis is then applied to get five selections from the scans. The selections given should prompt readers to do a chart review using their own analysis process. This letter is not a call for a specific action to buy, sell or short any of the stocks provided. There are NO sure things or guaranteed returns on the daily selection of "Diamonds in the Rough."
Regarding BUY/SELL Signals: The signal status reported herein is based upon mechanical trading model signals and crossovers. They define the implied bias of the price index/stock based upon moving average relationships and momentum, but they do not necessarily call for a specific action. They are information flags that should prompt chart review. Further, they do not call for continuous buying or selling during the life of the signal. For example, a BUY signal will probably (but not necessarily) return the best results if action is taken soon after the signal is generated. Additional opportunities for buying may be found as price zigzags higher, but the trader must look for optimum entry points. Conversely, exit points to preserve gains (or minimize losses) may be evident before the model mechanically closes the signal.
Helpful DecisionPoint Links:
DecisionPoint Shared ChartList and DecisionPoint Chart Gallery
Price Momentum Oscillator (PMO)
Swenlin Trading Oscillators (STO-B and STO-V)
For more links, go to DecisionPoint.com