
Reader requests this week definitely have potential. Interestingly, the majority are in the Healthcare Sector (XLV) and one in the Industrials Sector (XLI). I did find potential in four of today's requests so I didn't have to add any of my own. However, I still wanted to test out the Surge Scan I've developed. It turned out about 15 results today and I found four with potential. I'll list them under today's "Diamonds in the Rough" symbols so you can take a look.
The DP Scan Alert System will be available very soon, but before we release it, we'd like to have a few Beta testers from the Diamonds community so we can tighten up the product. At the end of the test period, those who give us feedback will be offered the new service at a discount. If you're interested, email support@decisionpoint.com.
Don't forget to sign up for tomorrow's Diamond Mine trading room!
Good Luck & Good Trading,
Erin
Today's "Diamonds in the Rough": ANNX, FERG, MCRB and SITE.
Other requests (good and bad): FMS, KURA, STLD, CBAY, ARCB, VTYX and OCUL.
PMO Surge Scan Picks: ABBV, AVA, HLN and MDLZ.
** JULY VACATION **
I will be in Europe 7/14 - 7/27 so there will not be any Diamonds reports or trading rooms during that time. All subscribers with active subscriptions on 7/27 will be compensated with two weeks added to their renewal date.

RECORDING LINK (4/14/2023):
Topic: DecisionPoint Diamond Mine (4/14/2023) LIVE Trading Room
Passcode: April@14th
REGISTRATION for 4/21/2023:
When: Apr 21, 2023 09:00 AM Pacific Time (US and Canada)
Topic: DecisionPoint Diamond Mine (4/21/2023) LIVE Trading Room
Register in advance for this webinar HERE
After registering, you will receive a confirmation email containing information about joining the webinar.

Here is the last recording (4/10):
Welcome to DecisionPoint Diamonds, wherein I highlight ten "Diamonds in the Rough" per week. These are selected from the results of my DecisionPoint Scans which search for stocks that could benefit from the trend and condition of the market. Remember, these are not recommendations to buy or sell, but are the most interesting of the stocks that surfaced in my scans. My objective is to save you the work of the initial, tedious culling process, but you need to apply your own analysis to see if these stocks pique your interest as well. There are no guaranteed winners here!
"Predefined Scans Triggered" are taken from StockCharts.com using the "Symbol Summary" option instead of a "SharpChart" on the workbench.
Stop levels are all rounded down.
Annexon Inc. (ANNX)
EARNINGS: 05/08/2023 (BMO)
Annexon, Inc. is a clinical-stage biopharmaceutical company, which develops a pipeline of novel therapies for patients with classical complement-mediated disorders of the body, eye and brain. It offers drugs that control or target huntington's and alzheimer's disease, multiple sclerosis, glaucoma, parkinson's disease, and spinal muscular atrophy. The company was founded by Ben Barres and Arnon Rosenthal on March 3, 2011 and is headquartered in Brisbane, CA.
Predefined Scans Triggered: Elder Bar Turned Blue and Moved Above Upper Keltner Channel.
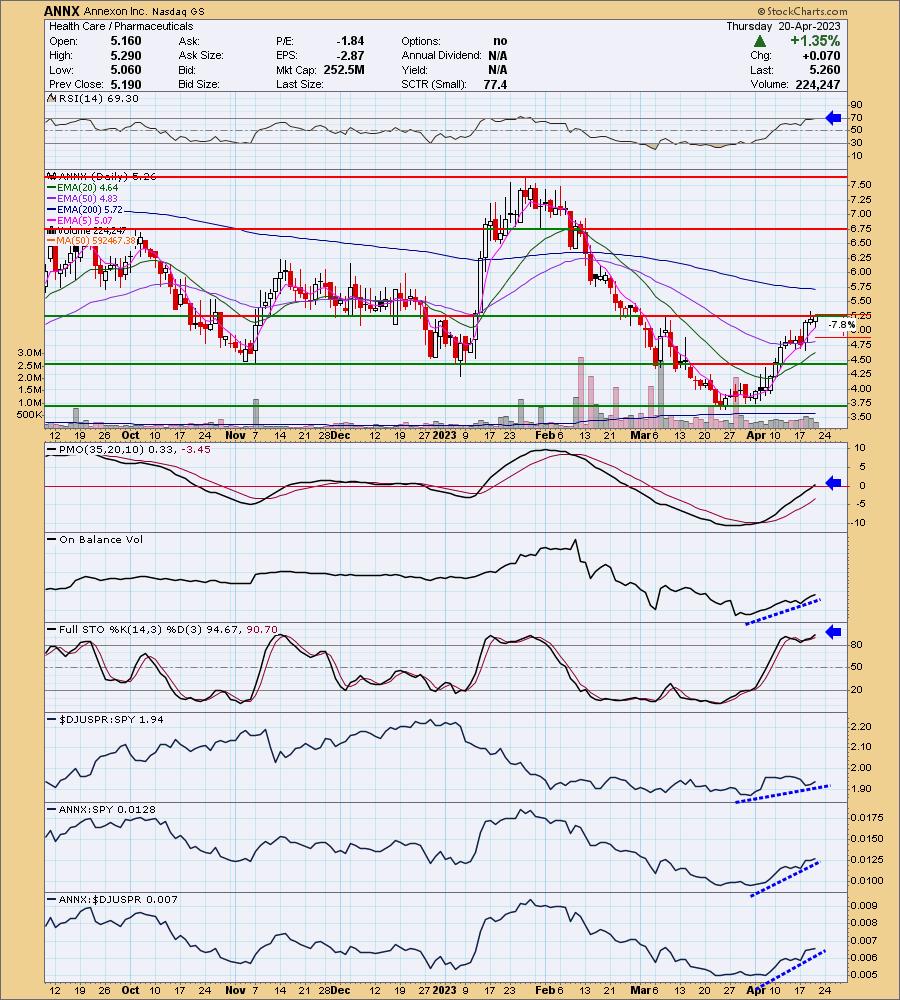
ANNX is down -2.09% in after hours trading. It could be that it is pulling back after hours since it's hit overhead resistance. I would look for a breakout. The RSI is positive and not quite overbought. The PMO just hit positive territory and is on an oversold Crossover BUY Signal. The OBV is confirming the rising trend and Stochastics are very strong as they rise above 90 not just 80. Overall, relative strength is increasing against the SPY and the group. The group is doing fairly well relatively speaking. The stop is set at the 50-day EMA at 7.8% or $4.84.
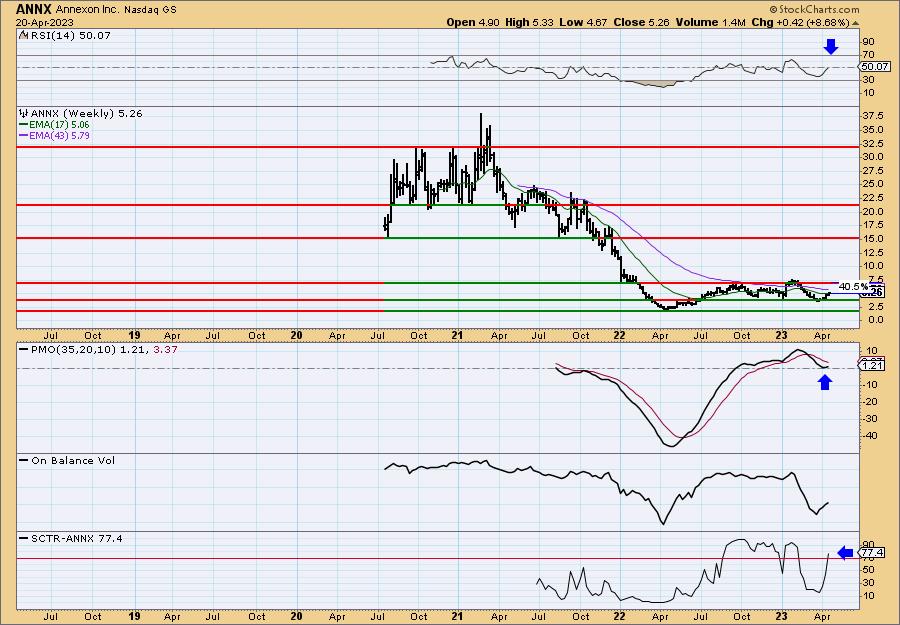
The weekly chart confirms the bullish daily chart. While this could be an intermediate-term investment, you would still need to babysit it given it is a volatile, low-priced Biotech stock. The weekly RSI just moved above net neutral (50) and the weekly PMO has turned up just above the zero line. Volume is coming in on the rally based on the OBV and the SCTR is now in the "hot zone"* above 70.
*We call it the "hot zone" because it implies that the stock/ETF is in the top 30% of its "universe" (large-, mid-, small-caps and ETFs) as far as trend and condition, particularly in the intermediate and long terms.
Ferguson Plc. (FERG)
EARNINGS: None Listed.
Ferguson Plc engages in the supply of plumbing and heating products to professional contractors and consumers, repair, maintenance and improvement and new construction markets through its subsidiaries. The company was founded in 1887 and is headquartered in Wokingham, the United Kingdom.
Predefined Scans Triggered: New CCI Buy Signals, Moved Above Upper Price Channel, P&F Double Top Breakout and P&F Triple Top Breakout.
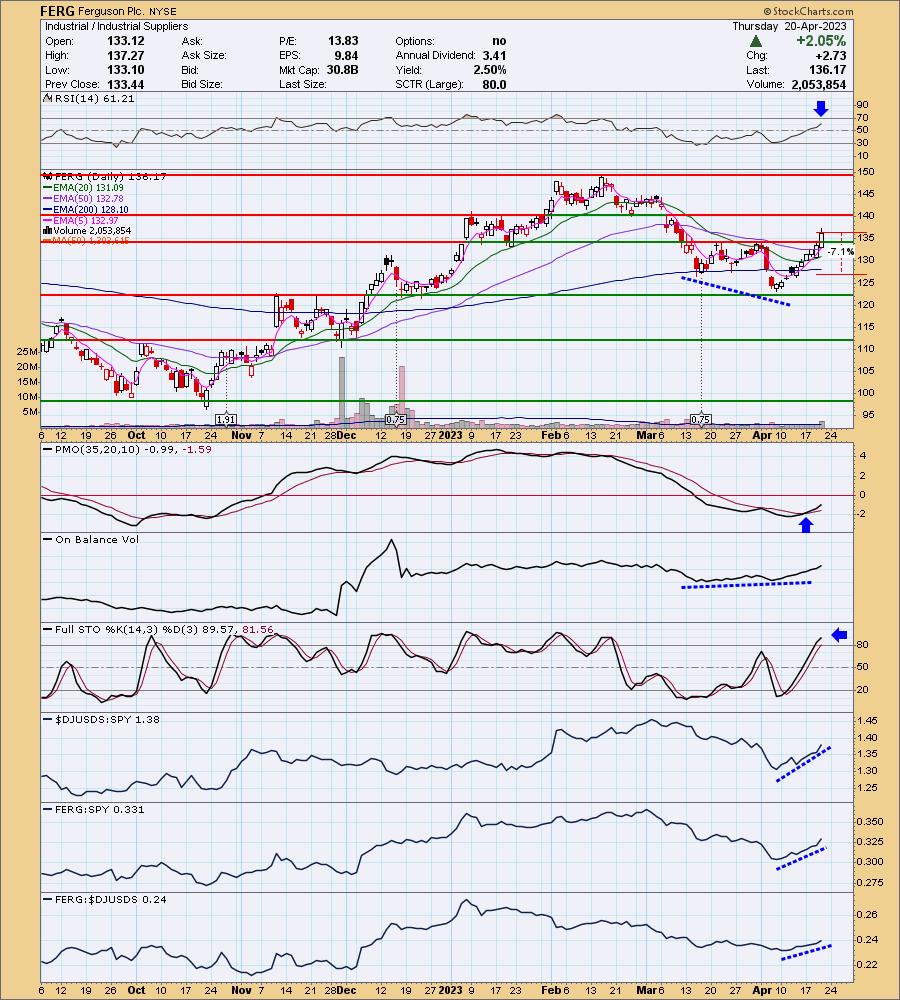
FERG is unchanged in after hours trading. Today price broke out strongly. There is a positive OBV divergence (rising OBV bottoms, falling price bottoms). The PMO was already on an oversold BUY Signal and continues to rise. The RSI is rising in positive territory and isn't overbought. Stochastics are above 80 and rising. Relative strength studies are excellent. The stop is set at 7.1% or $126.50.
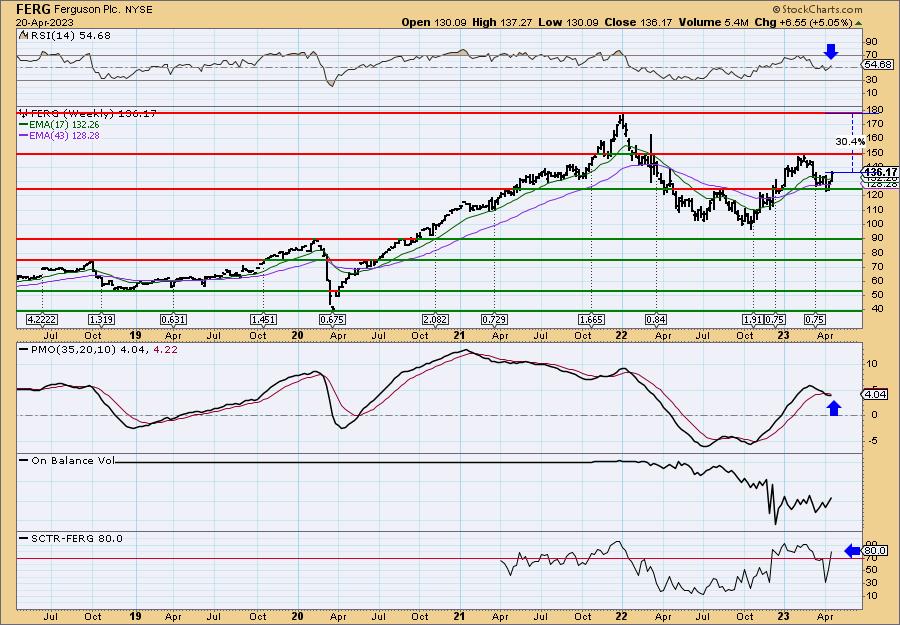
The weekly RSI just moved back into positive territory and the weekly PMO is decelerating its decline. It appears ready to turn back up. The SCTR has moved quickly back into the "hot zone" above 70. Upside potential is over 30%.
Seres Therapeutics, Inc. (MCRB)
EARNINGS: 05/10/2023 (BMO)
Seres Therapeutics, Inc. engages in the development of biological drugs through microbiome therapeutics platform. Its product pipeline includes SER-109, SER-287, SER-301, and SER-401. The company was founded by Geoffrey von Maltzahn, David A. Berry, and Noubar B. Afeyan on October 18, 2010 and is headquartered in Cambridge, MA.
Predefined Scans Triggered: None.
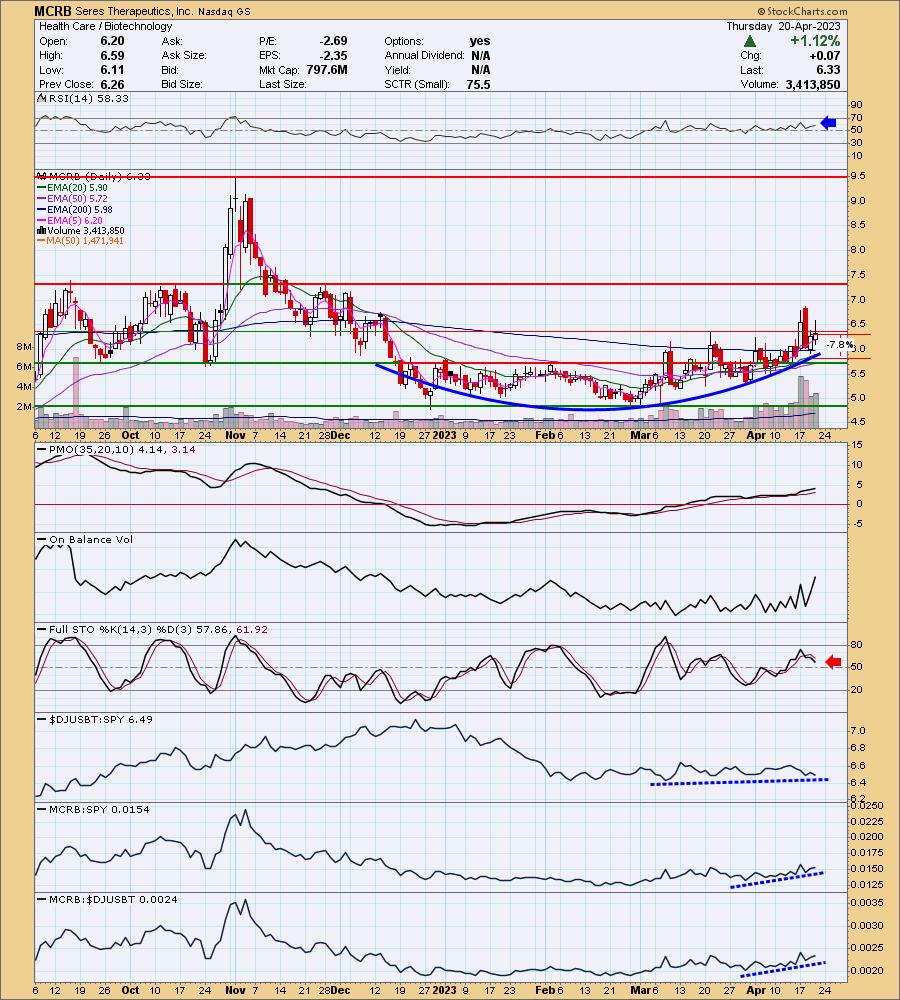
MCRB is up +0.63% in after hours trading. I noticed a nice cup shaped basing pattern. I'm not thrilled with how choppy this one trades, but it's a Biotech so it should be expected. Everything is going right on the chart with the exception of Stochastics which are falling. I'm forgiving that because they are 'twitchy' and not that decisive right now. Still it does add a bit of risk. The RSI is positive and has been all month. The PMO is rising on a BUY Signal and the OBV shows volume is coming in on this twitchy rally. Relative strength against the group and SPY is rising. The stop may need to be set a bit deeper given the volatility and low-price of this stock, but I have opted to set it at 7.8% or $5.83.
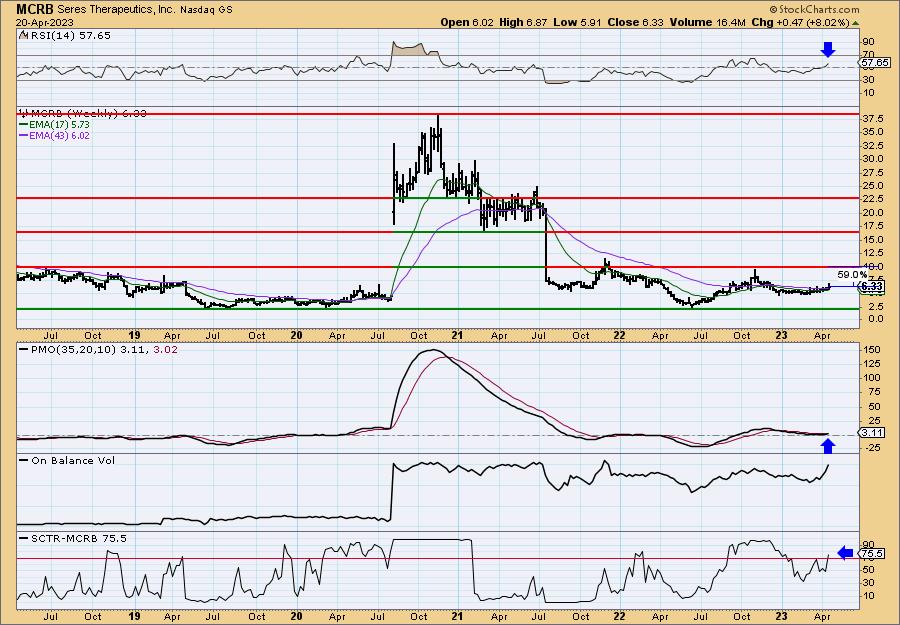
I like the way the weekly chart is shaping up. The weekly RSI is rising in positive territory and isn't overbought. The weekly PMO is triggering a Crossover BUY Signal. Volume is rising and the SCTR just entered the "hot zone". Upside potential is mouth-watering at 59%. I don't know if it will accomplish a move that high, but it isn't out of the realm of possibility.
SiteOne Landscape Supply, Inc. (SITE)
EARNINGS: 05/03/2023 (BMO)
SiteOne Landscape Supply, Inc. engages in the distribution of landscape supplies and residential. Its products include hardscapes, landscape accessories, nursery goods, outdoor lighting, and ice melt products to green industry professionals. The company was founded in 2001 and is headquartered in Roswell, GA.
Predefined Scans Triggered: Entered Ichimoku Cloud, P&F Double Top Breakout and P&F Bearish Signal Reversal.
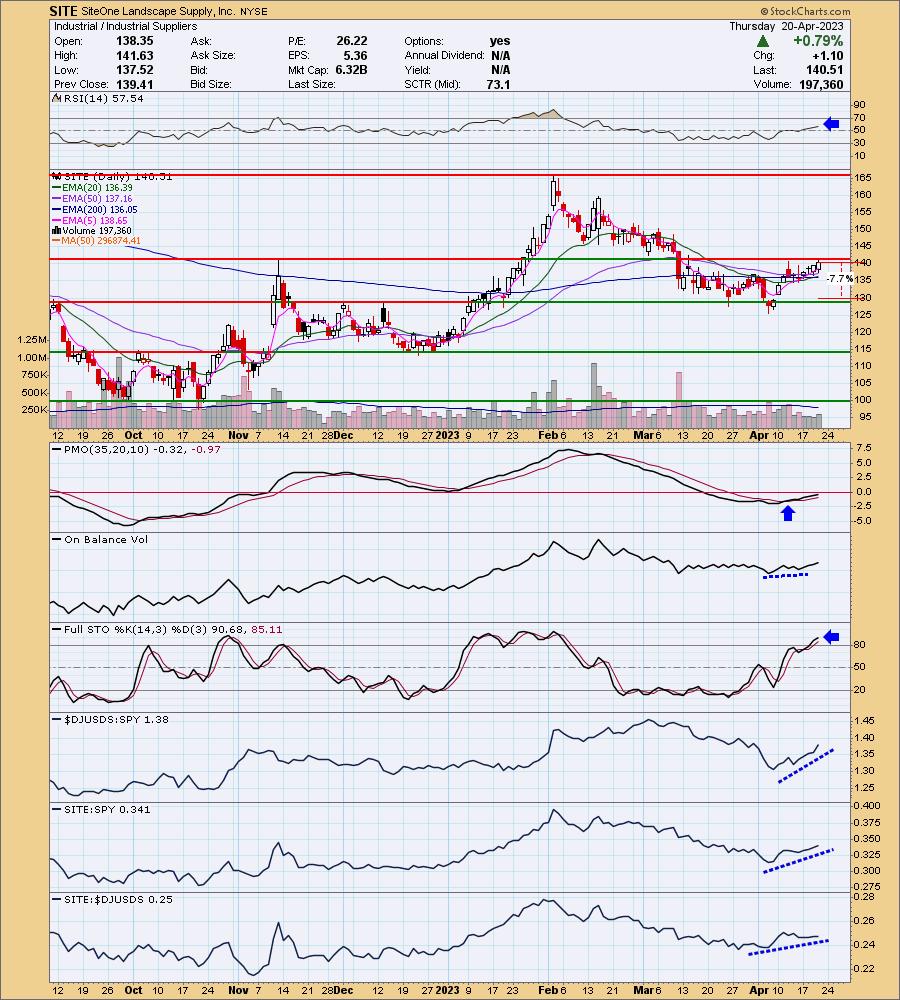
SITE is down -2.97% in after hours trading so you may get a better entry tomorrow. It could be struggling due to overhead resistance being met today. The indicators look great so I have to believe we will see a breakout soon. The RSI is now in positive territory and is rising. The PMO is rising on an oversold Crossover BUY Signal. The OBV is confirming the current rally with rising bottoms. Stochastics are above 80 and rising. Relative strength is excellent for the group and SITE against the SPY and its group. Homebuilders are looking good so maybe this stock will go along for the ride. The stop would be too deep if set below the April low. I got as close as I could with a 7.7% stop around $129.69.
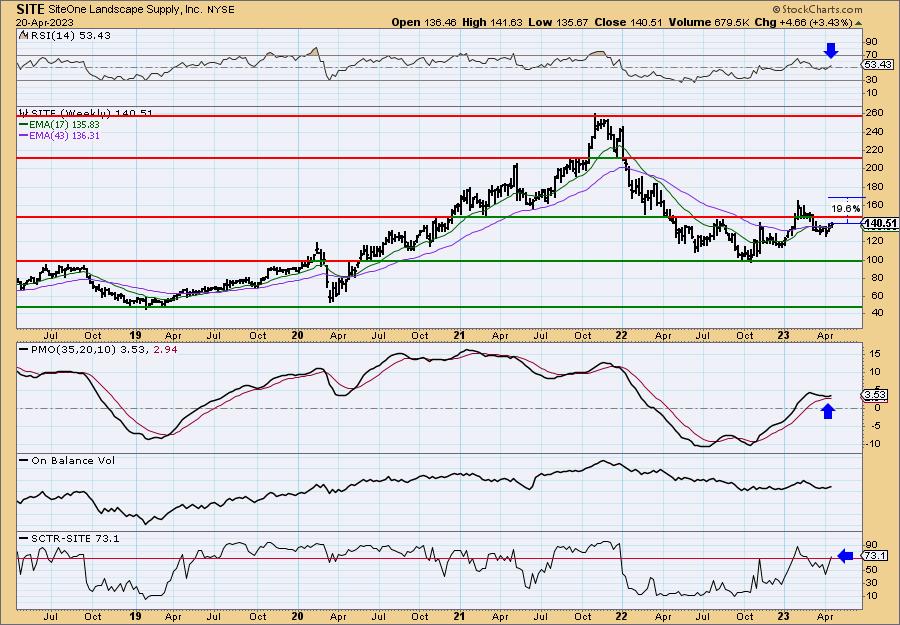
The weekly chart is favorable enough to consider this one a possible intermediate-term investment. The weekly RSI just returned to positive territory and the weekly PMO 'surged' as it formed a bottom above the signal line. We find bottoms above the signal line to be especially bullish. The SCTR just entered the "hot zone". Upside potential is very good at over 19%.
Don't forget, on Thursdays I look at reader-requested symbols, click HERE to send me an email. I read every email I receive and try to answer them all!
Current Market Outlook:
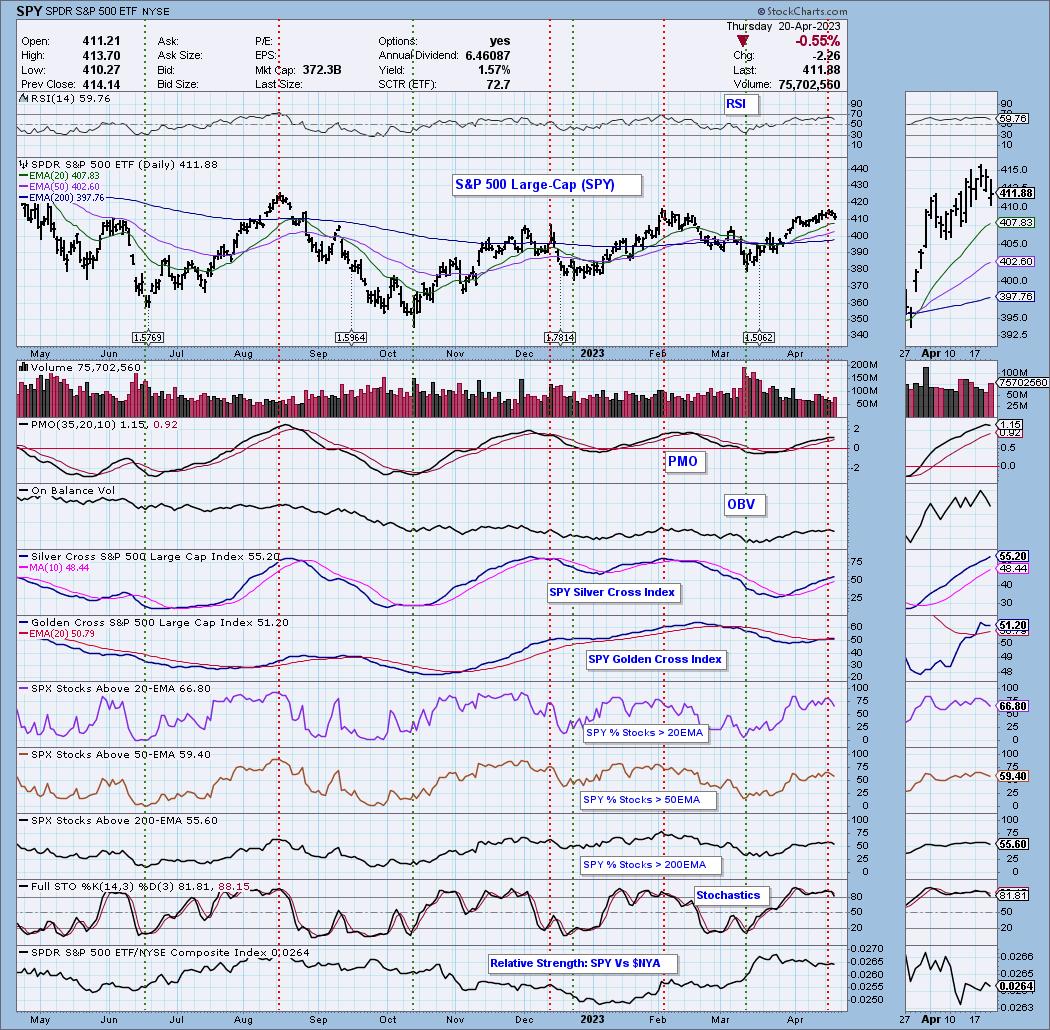
Market Environment: It is important to consider the odds for success by assessing the market tides. The following chart uses different methodologies for objectively showing the depth and trend of participation for intermediate- and long-term time frames.
- The Silver Cross Index (SCI) shows the percentage of SPX stocks on IT Trend Model BUY signals (20-EMA > 50-EMA)
- The Golden Cross Index (GCI) shows the percentage of SPX stocks on LT Trend Model BUY signals (50-EMA > 200-EMA)
Don't forget that as a "Diamonds" member, you have access to our GCI/SCI curated ChartList on DecisionPoint.com. You'll find it under "Members Only" links on the left side on the Blogs and Links Page.
Here is the current chart:
Full Disclosure: I am 30% long, 4% short. I added SARK today in addition to my already 2% hedge.
I'm required to disclose if I currently own a stock I mention and/or may buy/short it within the next 72 hours.
"Technical Analysis is a windsock, not a crystal ball." - Carl Swenlin
(c) Copyright 2023 DecisionPoint.com
Watch the latest episode of DecisionPoint Trading Room with Carl & Erin Swenlin on Mondays 7:00p EST or on the DecisionPoint playlist on the StockCharts TV YouTube channel here!
NOTE: The stocks reported herein are from mechanical trading model scans that are based upon moving average relationships, momentum and volume. DecisionPoint analysis is then applied to get five selections from the scans. The selections given should prompt readers to do a chart review using their own analysis process. This letter is not a call for a specific action to buy, sell or short any of the stocks provided. There are NO sure things or guaranteed returns on the daily selection of "Diamonds in the Rough."
Regarding BUY/SELL Signals: The signal status reported herein is based upon mechanical trading model signals and crossovers. They define the implied bias of the price index/stock based upon moving average relationships and momentum, but they do not necessarily call for a specific action. They are information flags that should prompt chart review. Further, they do not call for continuous buying or selling during the life of the signal. For example, a BUY signal will probably (but not necessarily) return the best results if action is taken soon after the signal is generated. Additional opportunities for buying may be found as price zigzags higher, but the trader must look for optimum entry points. Conversely, exit points to preserve gains (or minimize losses) may be evident before the model mechanically closes the signal.
Helpful DecisionPoint Links:
DecisionPoint Shared ChartList and DecisionPoint Chart Gallery
Price Momentum Oscillator (PMO)
Swenlin Trading Oscillators (STO-B and STO-V)
For more links, go to DecisionPoint.com