
Today I had almost 200 symbols to review as the scans produced like crazy. There were a few themes that were obvious and somewhat less obvious. The first obvious theme was Technology which has been showing leadership among its brethren. A less obvious theme was Medical Supplies and Medical Equipment. I haven't been a fan of the Healthcare sector in some time so I was surprised to see so many. I also noticed quite a few international ETFs in the results so more than likely I'll be presenting some for ETF Day tomorrow. The Singapore ETF (EWS) looked particularly interesting.
I did go off the reservation a bit with my last pick. It is in Consumer Discretionary. I don't know why, but I kept coming back to that chart over and over as I did my research. Finally, I decided to include it even though the industry group is not outperforming the market. We'll see if my intuition on that one was correct.
The market is positioned well to continue higher based on our indicators so it might be time to at least dip your toes in the water. I will be taking off my hedge tomorrow and likely adding one of today's "Diamonds in the Rough" barring a weird black swan event over the FOMC.
Good Luck & Good Trading,
Erin
Today's "Diamonds in the Rough": HAE, STE and OSTK.
Runner-ups: AON, EWS, EXTR, ADSK, ABC, DBX, DELL, EBAY, FRPT, MDT, QRVO, ZYME, DLO and TDOC.

RECORDING LINK (3/17/2023):
Topic: DecisionPoint Diamond Mine (3/17/2023) LIVE Trading Room
Passcode: March#17th
REGISTRATION for 3/24/2023:
When: Mar 24, 2023 09:00 AM Pacific Time (US and Canada)
Topic: DecisionPoint Diamond Mine (3/24/2023) LIVE Trading Room
Register in advance for this webinar HERE.
After registering, you will receive a confirmation email containing information about joining the webinar.

Here is the last recording (3/20):
Welcome to DecisionPoint Diamonds, wherein I highlight ten "Diamonds in the Rough" per week. These are selected from the results of my DecisionPoint Scans which search for stocks that could benefit from the trend and condition of the market. Remember, these are not recommendations to buy or sell, but are the most interesting of the stocks that surfaced in my scans. My objective is to save you the work of the initial, tedious culling process, but you need to apply your own analysis to see if these stocks pique your interest as well. There are no guaranteed winners here!
"Predefined Scans Triggered" are taken from StockCharts.com using the "Symbol Summary" option instead of a "SharpChart" on the workbench.
Stop levels are all rounded down.
Haemonetics Corp. (HAE)
EARNINGS: 05/09/2023 (BMO)
Haemonetics Corp. is a global healthcare company, which engages in the development and distribution of hematology products and solutions. It operates through the following segments: Plasma, Blood Center, Hospital, and Corporate. The Plasma segment offers automated plasma collection and donor management software systems. The Blood Center segment provides solutions for donor collection centers' ability to acquire blood, filter blood, and separate blood components. The Hospital segment includes hemostasis management, cell salvage, and transfusion management services that help decision makers in hospitals optimize blood acquisition, storage, and usage in critical settings. The company was founded by Allen Latham, Jr. in 1971 and is headquartered in Boston, MA.
Predefined Scans Triggered: P&F Double Top Breakout and P&F Bearish Signal Reversal.
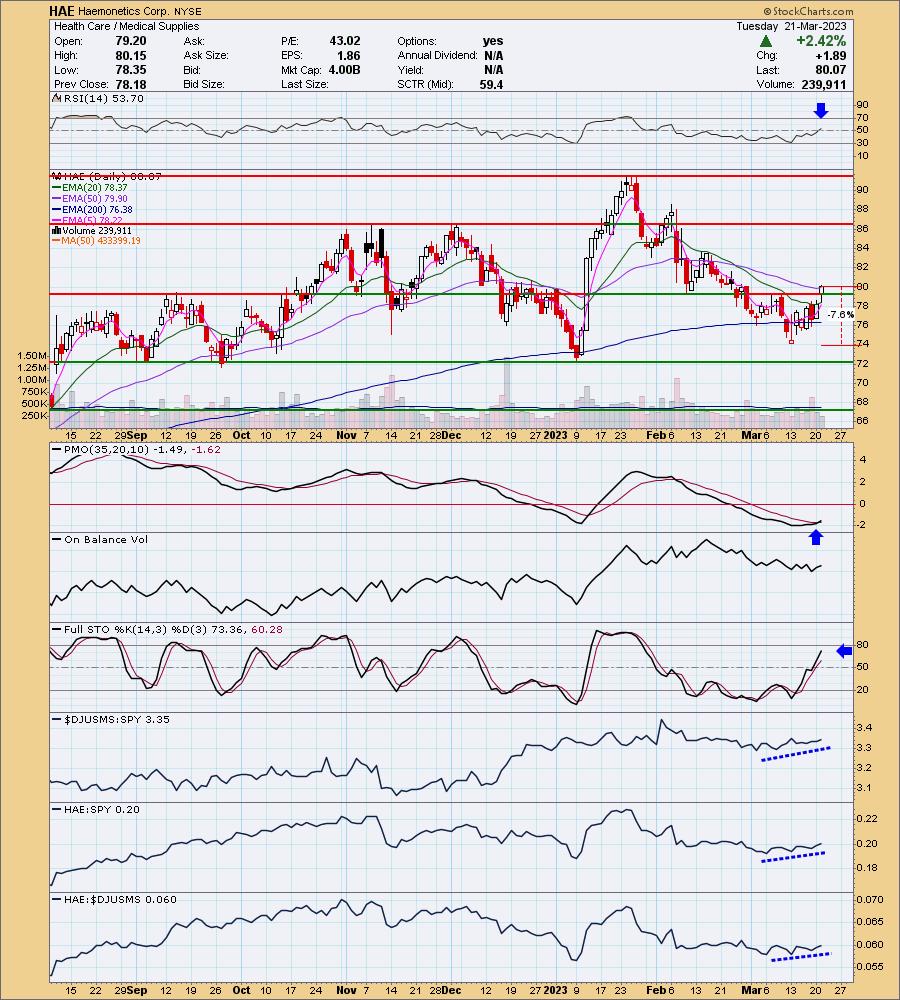
HAE is unchanged in after hours trading. This chart was almost a no-brainer. The only detractor would be the OBV angling lower. Other than that it is very strong and early. I like early movers and this one had a breakout today. The RSI just moved into positive territory and the PMO triggered a crossover BUY signal today. Stochastics are rising strongly and should move above 80 very soon. Relative strength is steadily moving higher. I'd like to see those rising trends on relative strength more steep. The stop can be set around 7.6% or $73.98.
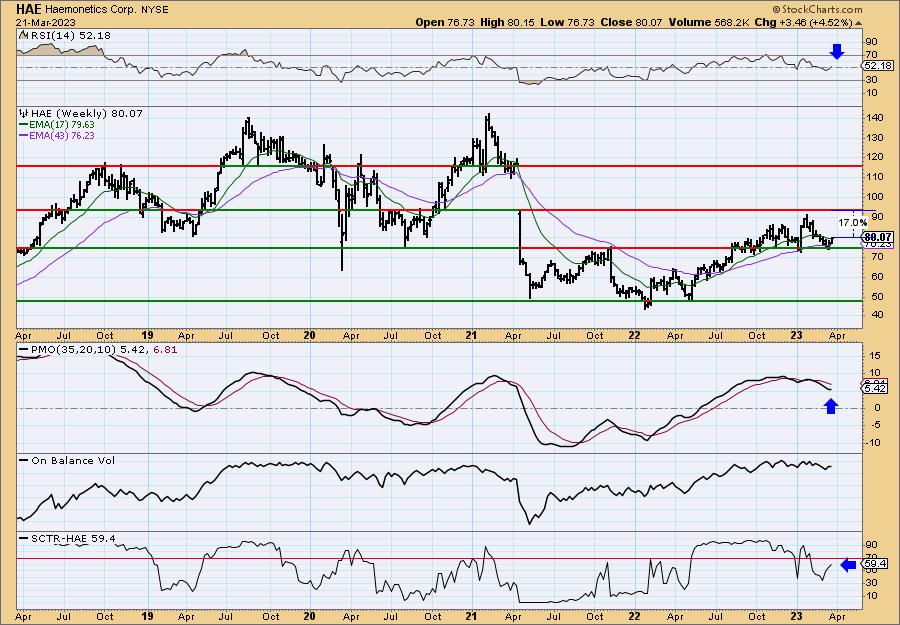
The weekly RSI is now back in positive territory above net neutral (50). The weekly PMO is turning up and the StockCharts Technical Rank (SCTR) is rising and should reach the "hot zone"* above 70 very soon. Upside potential if it makes it to gap resistance from 2021, it would be a 17% gain.
*We call it the "hot zone" because it implies that the stock/ETF is in the top 30% of its "universe" (large-, mid-, small-caps and ETFs) as far as trend and condition, particularly in the intermediate and long terms.
Overstock.com Inc. (OSTK)
EARNINGS: 04/27/2023 (BMO)
Overstock.com, Inc. operates an online shopping site. It also sells these products through www.overstock.com, www.o.com, and www.o.biz. It operates through the following business segments: Retail, tZERO, and MVI. The Retail Segment engages in e-commerce sales through its website. The tZERO Segment focuses on securities transaction through its broker-dealers. The MVI segment consists of the Medici business. The company was founded on May 5, 1997 and is headquartered in Midvale, UT.
Predefined Scans Triggered: New CCI Buy Signals.
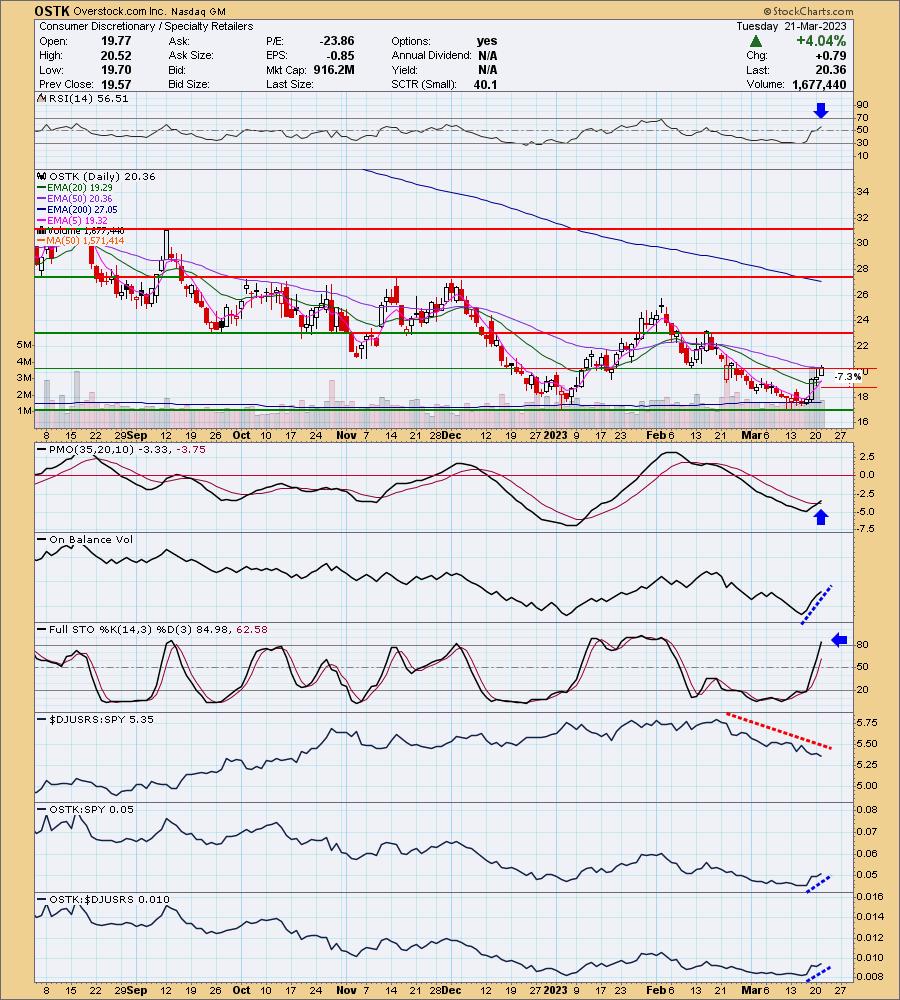
OSTK is down -0.74% in after hours trading so it appears it could be time for a pause after the strong rally of the past week. This could offer an entry better than the price set today. The RSI is positive, rising and not overbought. The PMO just triggered an oversold crossover BUY signal. Volume is coming in based on the OBV's steep rise. Stochastics are now above 80. As I mentioned in the opening, my biggest hesitation with this chart was the underperformance by the industry group. OSTK is showing new leadership and is starting to outperform the SPY. I wouldn't give it too much rope. I think a 7.3% stop is good. It could be adjusted lower based on your purchase price.
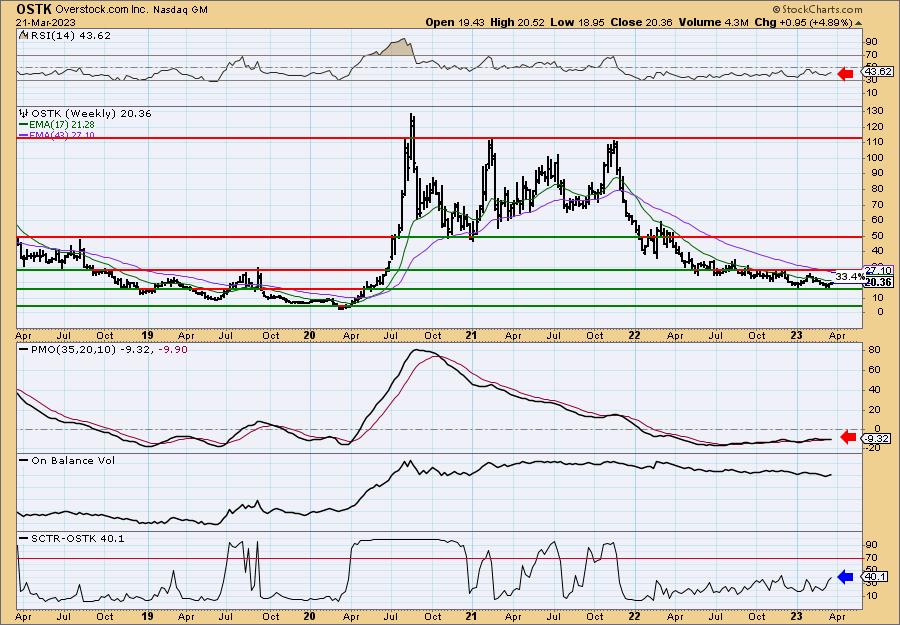
The weekly chart needs work given the weekly RSI is negative (although it's starting to rise) and the weekly PMO is very flat. The PMO is currently on a BUY signal so that's good news. The SCTR is below average, but it is rising. This stock seems like an interesting reversal play based on some serious upside potential (over 33%); however, as noted above, don't give it too much rope, this looks like a more short-term trade based on the weekly chart.
Steris plc (STE)
EARNINGS: 05/10/2023 (AMC)
STERIS Plc engages in the provision of healthcare and life science product and service solutions. It operates through the following segments: Healthcare, Life Sciences, Applied Sterilization Technologies, and Dental. The Healthcare segment provides a comprehensive offering for healthcare providers worldwide, focused on sterile processing departments and procedural centers, such as operating rooms and endoscopy suites. The Life Sciences segment designs, manufactures, and sells consumable products, equipment maintenance, specialty services, and capital equipment. The Applied Sterilization Technologies segment is involved in contract sterilization and testing services for medical device and pharmaceutical manufacturers. The Dental segment provides a comprehensive offering for dental practitioners and dental schools, offering instruments, infection prevention consumables and instrument management systems. The company was founded in 1985 and is headquartered in Mentor, OH.
Predefined Scans Triggered: Elder Bar Turned Green, Bullish MACD Crossovers and P&F Low Pole.
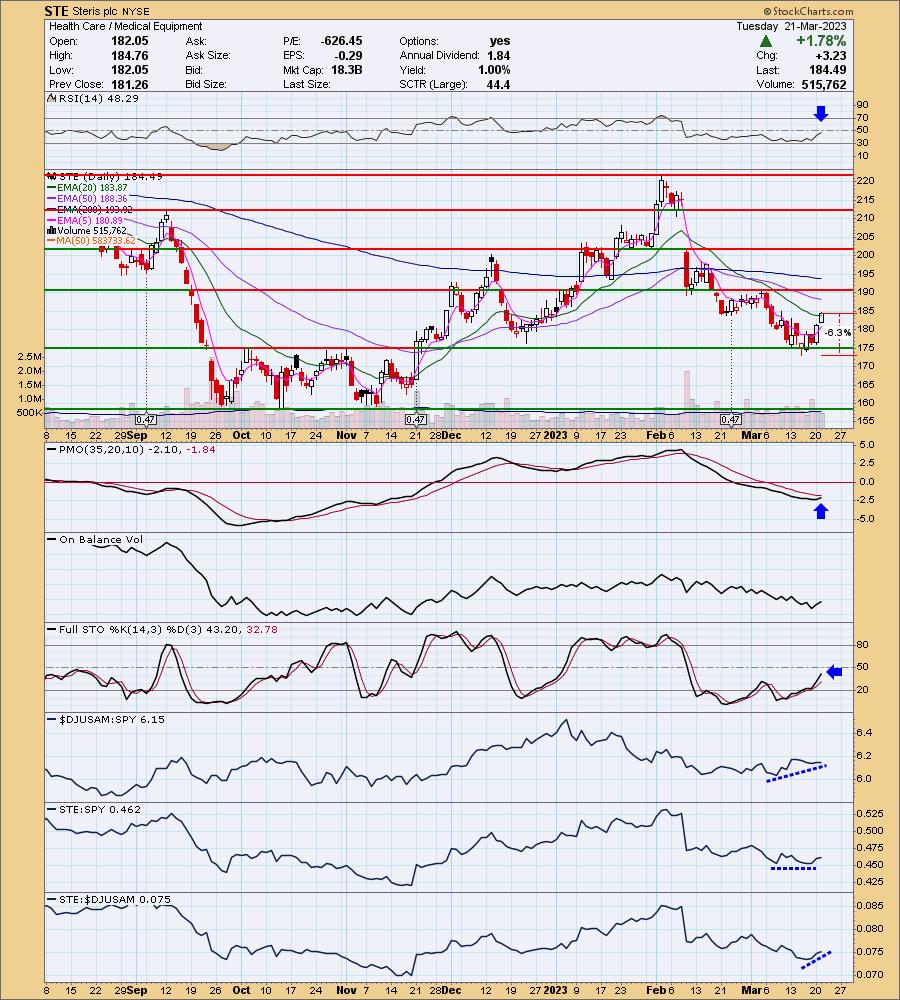
STE is unchanged in after hours trading. I like the current upside reversal that came right on strong support at late 2022 highs and the December low. Today it rallied above the 20-day EMA. The PMO has turned up and is going in for a crossover BUY signal. The RSI is in negative territory, but it is rising and if the rally continues, it will get above net neutral (50). Stochastics are rising more steeply, but do need to get above net neutral (50). The industry group is performing fine and STE is just now starting to see some outperformance against the group which should lead to better performance against the SPY. The stop can be set below support at 6.3% or $172.86.
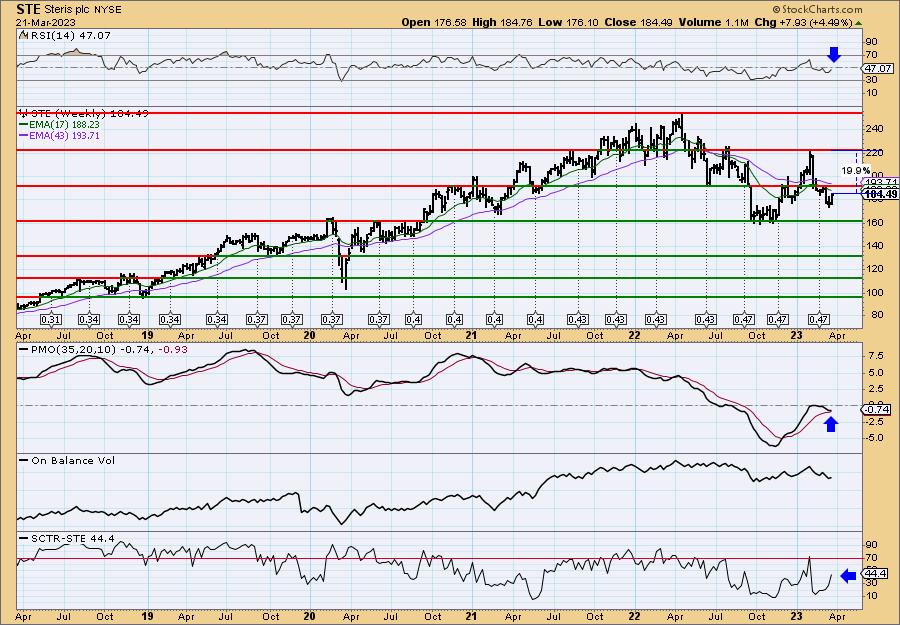
The price pattern on the weekly chart isn't great as price hasn't overcome resistance. However, it is beginning to improve. The weekly RSI is rising, although below net neutral. The weekly PMO is beginning to turn up above the signal line so a crossover SELL could be avoided. The SCTR isn't in the hot zone, but it is rising strongly. Upside potential is nearly 20%.
Don't forget, on Thursdays I look at reader-requested symbols, click HERE to send me an email. I read every email I receive and try to answer them all!
Current Market Outlook:
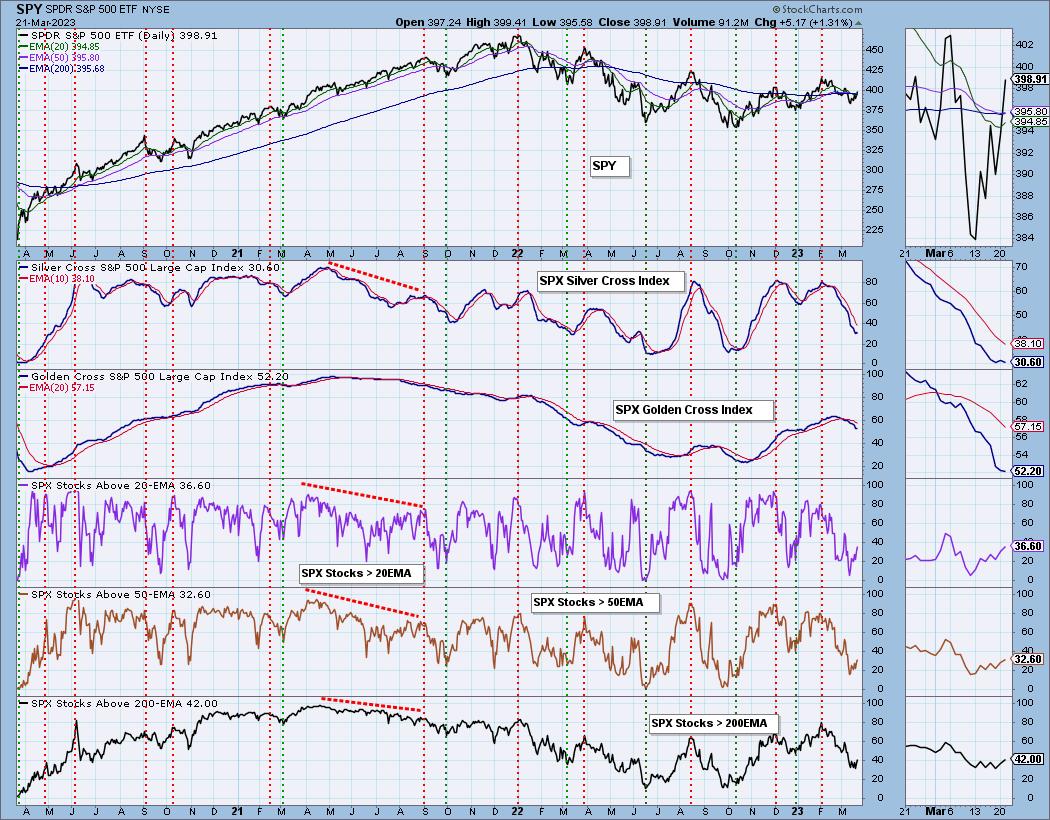
Market Environment: It is important to consider the odds for success by assessing the market tides. The following chart uses different methodologies for objectively showing the depth and trend of participation for intermediate- and long-term time frames.
- The Silver Cross Index (SCI) shows the percentage of SPX stocks on IT Trend Model BUY signals (20-EMA > 50-EMA)
- The Golden Cross Index (GCI) shows the percentage of SPX stocks on LT Trend Model BUY signals (50-EMA > 200-EMA)
Don't forget that as a "Diamonds" member, you have access to our GCI/SCI curated ChartList on DecisionPoint.com. You'll find it under "Members Only" links on the left side on the Blogs and Links Page.
Here is the current chart:
Full Disclosure: I am 13% long, 2% short. I'll likely add OSTK.
I'm required to disclose if I currently own a stock I mention and/or may buy/short it within the next 72 hours.
"Technical Analysis is a windsock, not a crystal ball." - Carl Swenlin
(c) Copyright 2023 DecisionPoint.com
Watch the latest episode of DecisionPoint Trading Room with Carl & Erin Swenlin on Mondays 7:00p EST or on the DecisionPoint playlist on the StockCharts TV YouTube channel here!
NOTE: The stocks reported herein are from mechanical trading model scans that are based upon moving average relationships, momentum and volume. DecisionPoint analysis is then applied to get five selections from the scans. The selections given should prompt readers to do a chart review using their own analysis process. This letter is not a call for a specific action to buy, sell or short any of the stocks provided. There are NO sure things or guaranteed returns on the daily selection of "Diamonds in the Rough."
Regarding BUY/SELL Signals: The signal status reported herein is based upon mechanical trading model signals and crossovers. They define the implied bias of the price index/stock based upon moving average relationships and momentum, but they do not necessarily call for a specific action. They are information flags that should prompt chart review. Further, they do not call for continuous buying or selling during the life of the signal. For example, a BUY signal will probably (but not necessarily) return the best results if action is taken soon after the signal is generated. Additional opportunities for buying may be found as price zigzags higher, but the trader must look for optimum entry points. Conversely, exit points to preserve gains (or minimize losses) may be evident before the model mechanically closes the signal.
Helpful DecisionPoint Links:
DecisionPoint Shared ChartList and DecisionPoint Chart Gallery
Price Momentum Oscillator (PMO)
Swenlin Trading Oscillators (STO-B and STO-V)
For more links, go to DecisionPoint.com