
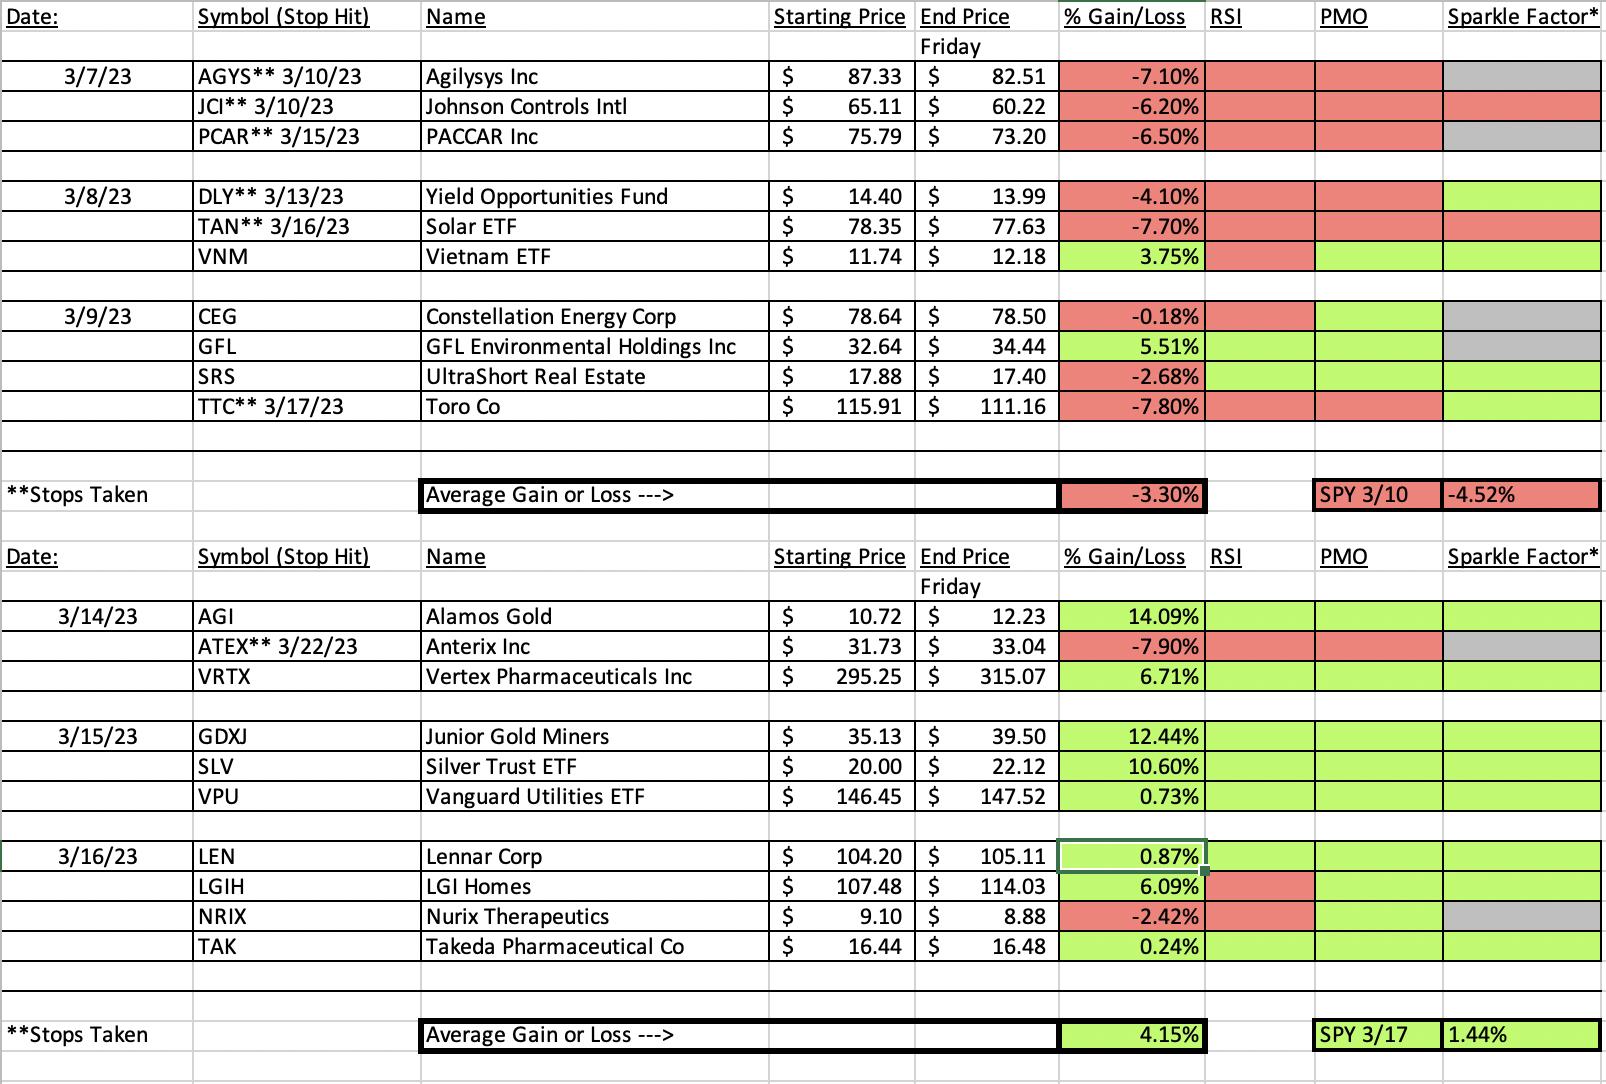
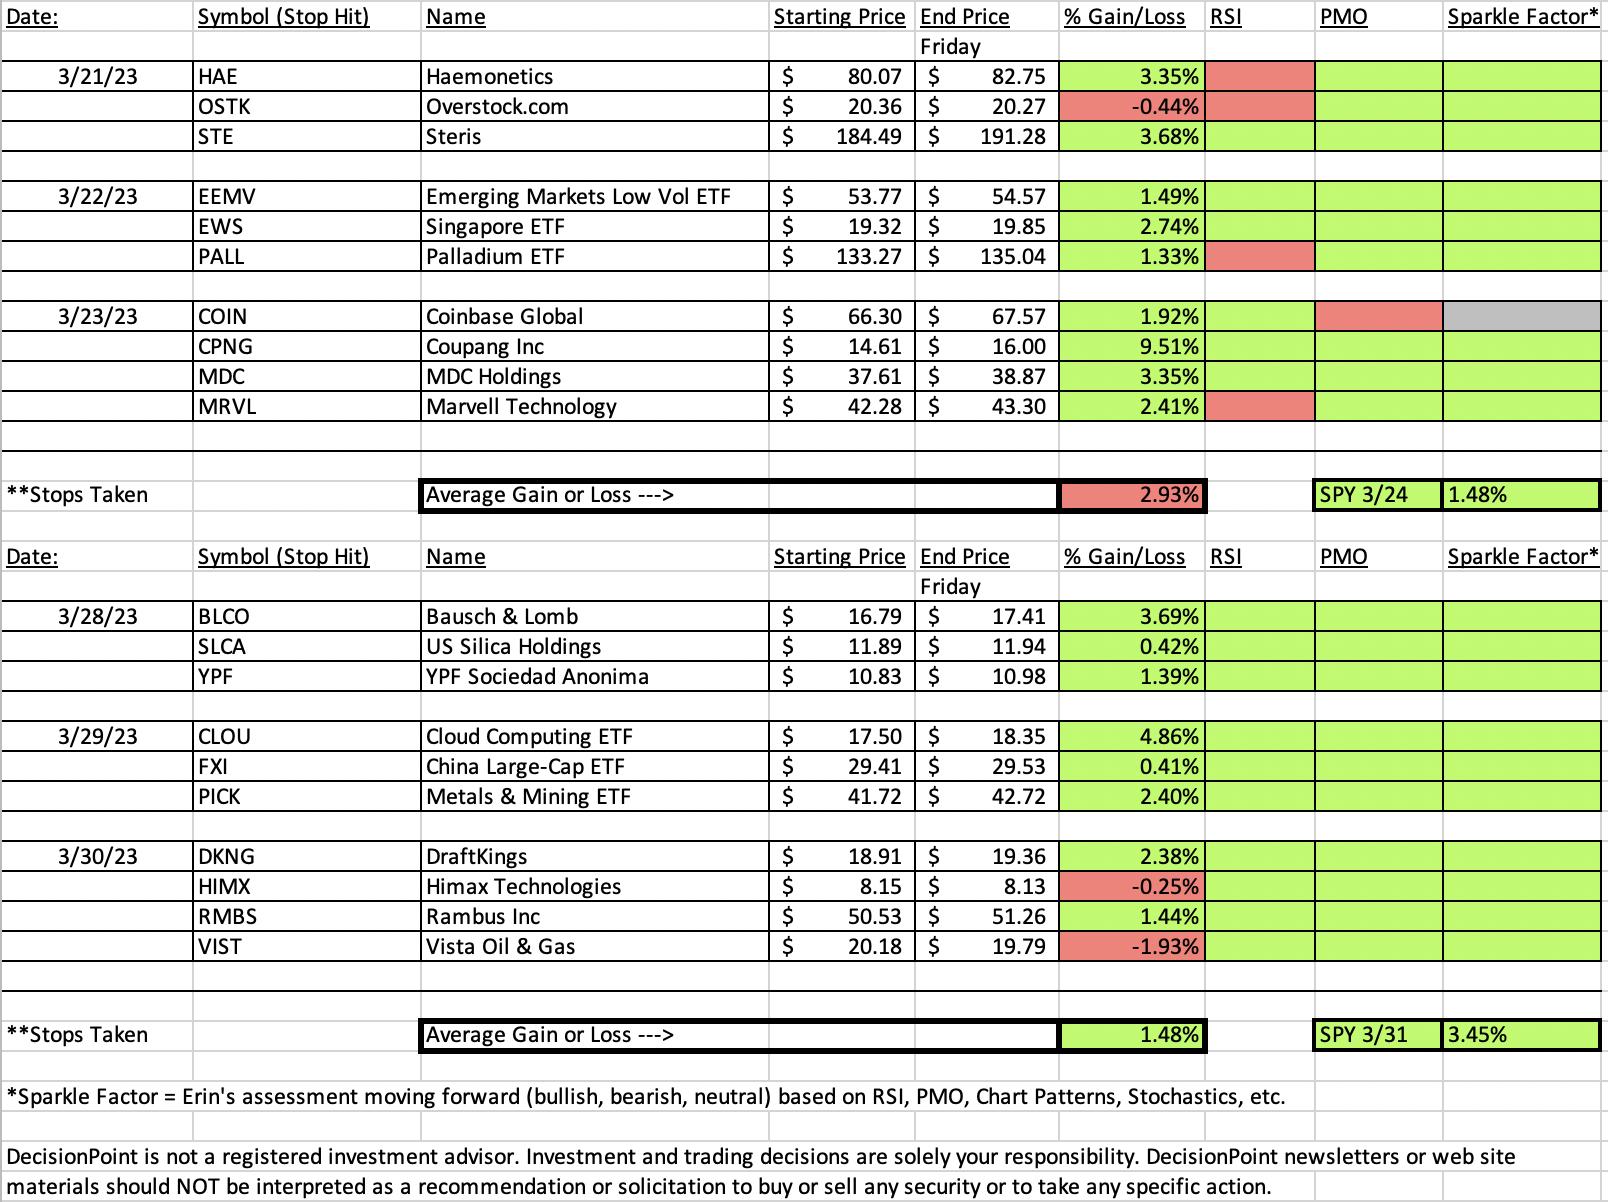
The market's short-term bullish bias has been working well for "Diamonds in the Rough". The past three weeks have only seen five stocks move lower of the 30 picked. The declines on those five averaged out to only -2.6%. On average, the remaining 25 stocks are up +4.1%. The biggest winner these past three weeks has been Alamos Gold (AGI) which is currently up +14.09% since being picked. Last week's pick Coupang (CPNG) is up +9.51%.
Take a close look at the spreadsheet. The first week listed fell prey to the large decline before this current bull market move. The others are looking good. I did review all of them.
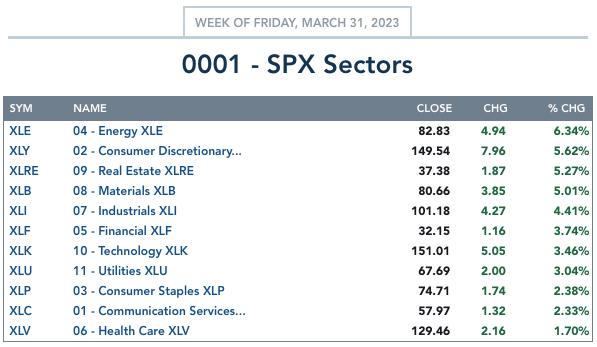
I did an about face on the Sector to Watch today. I was leaning toward Consumer Discretionary (XLY) and Materials (XLB), but after reviewing the sector charts I felt that Real Estate (XLRE) is the Sector to Watch. We're seeing new momentum and tremendous upside potential given how beat down that sector has been. I reviewed all of the industry groups within and it was a hard choice. Of the nine groups, one didn't look very healthy, but the other eight all had potential. This looks like an interesting place to drop a fishing line next week.
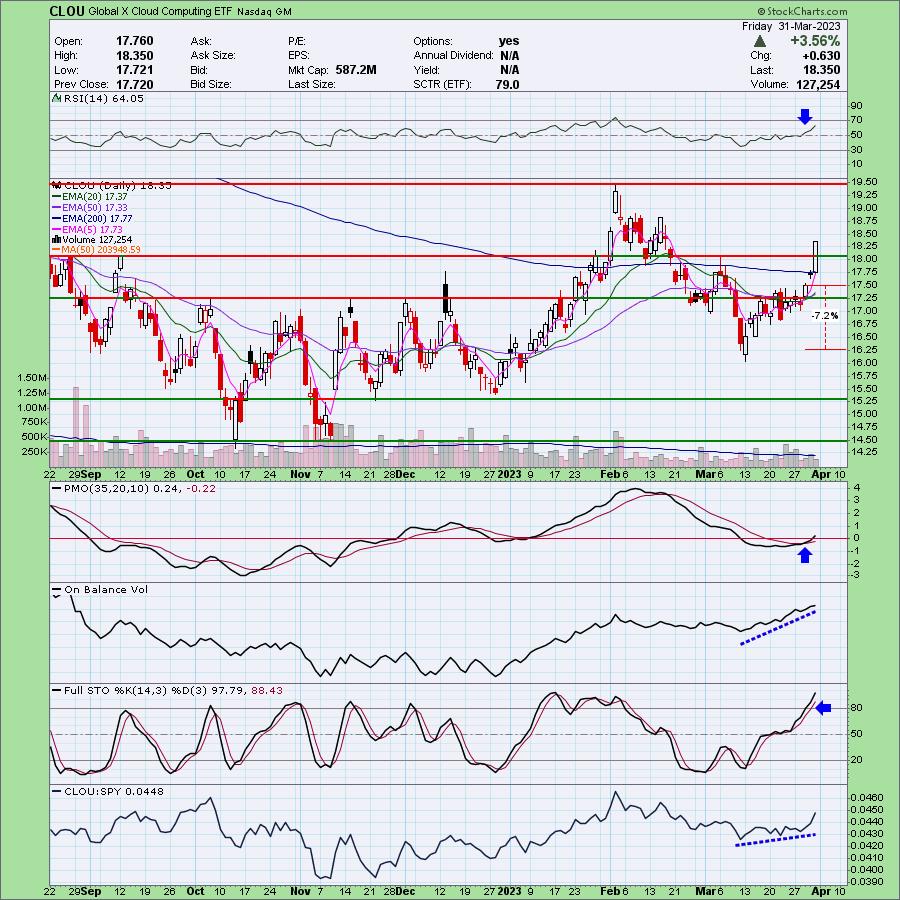
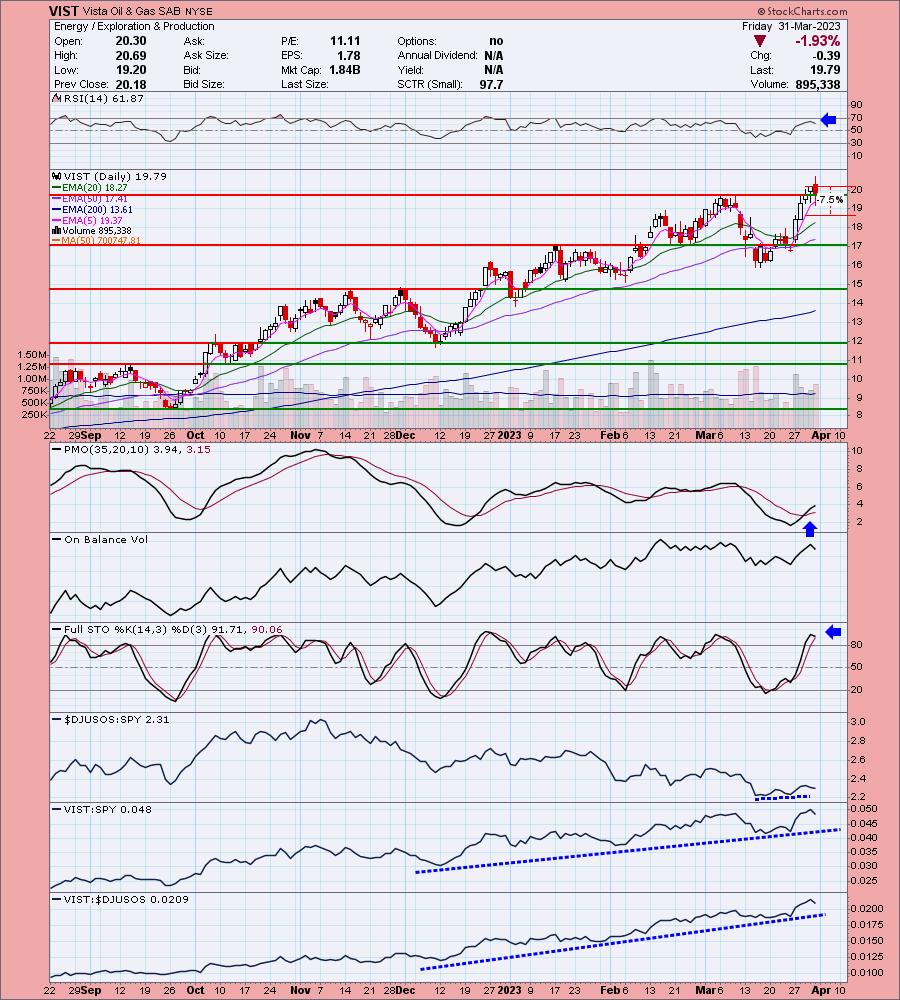
This week's "Darling" turned out to be the Cloud Computing ETF (CLOU) which was up +4.86%. The "Dud" was Vista Oil & Gas (VIST) which was down -1.93%. The chart is still constructive and Crude Oil is still bullish so while it was a "Dud", I believe it still has potential. It just had a bad day.
Have a great weekend!
Good Luck & Good Trading,
Erin

RECORDING LINK (3/31/2023):
Topic: DecisionPoint Diamond Mine (3/31/2023) LIVE Trading Room
Passcode: March#31
REGISTRATION for 4/3/2023:
When: Apr 3, 2023 09:00 AM Pacific Time (US and Canada)
Topic: DecisionPoint Diamond Mine (4/3/2023) LIVE Trading Room
Register in advance for this webinar HERE
After registering, you will receive a confirmation email containing information about joining the webinar.

Our latest DecisionPoint Trading Room recording (3/27/2023):
A few items about the spreadsheet: I've put on the spreadsheet whether the RSI is positive (green) or negative (red). The PMO column tells you if it is rising (green) or falling (red). Finally I've added my own "Sparkle Factor" that gives you my assessment going forward, bullish (green), bearish (red) or neutral (gray). The Sparkle Factor is basically my thoughts on whether I expect it to rise or fall. A neutral means it could really go either way so it could be added to a watch list. If you're in a stock I consider "neutral" going forward, the ball is in your court.
Darling:
Global X Cloud Computing ETF (CLOU)
EARNINGS: N/A
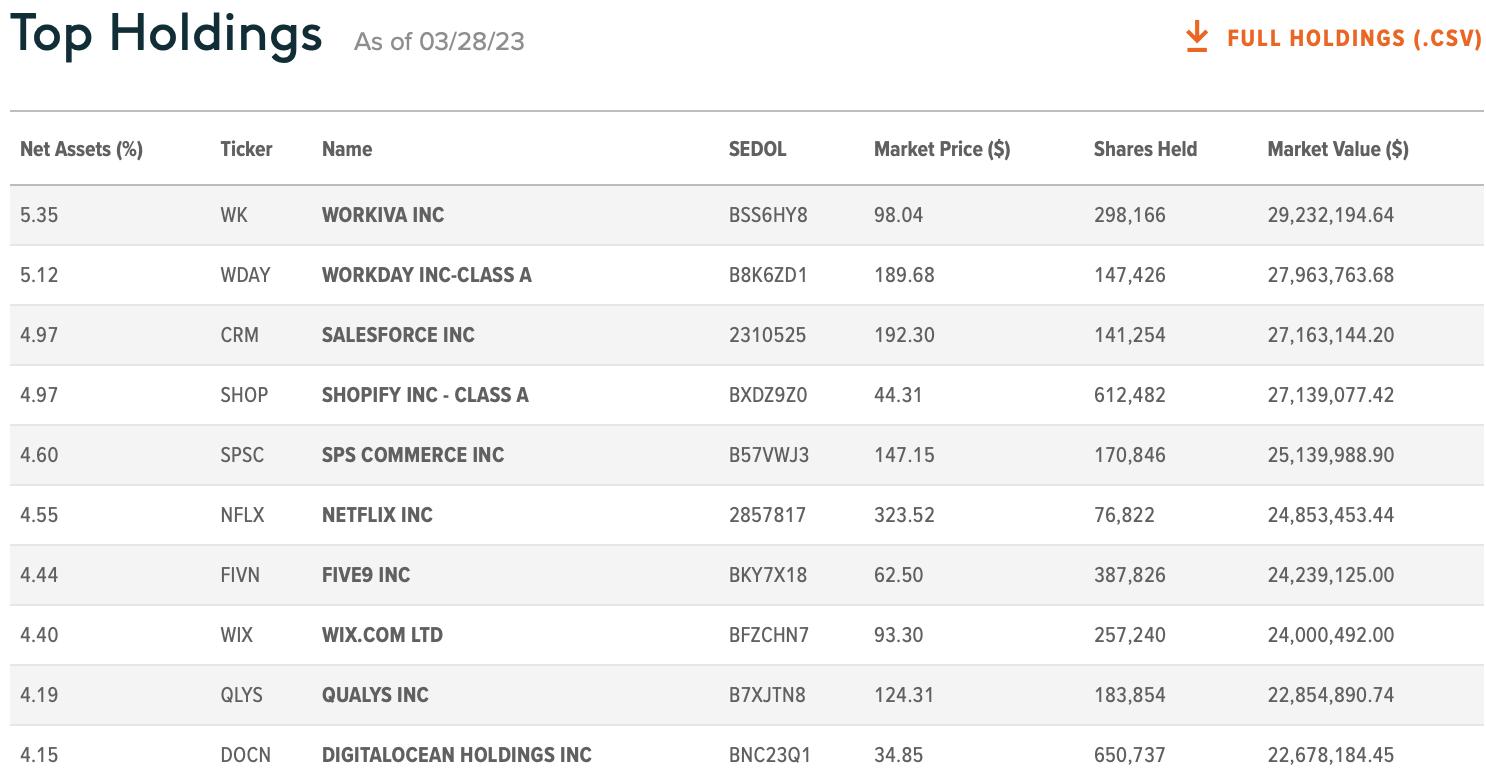
CLOU provides exposure to a market-cap weighted global equity index of companies involved in the cloud computing industry. Click HERE for more information.
Predefined Scans Triggered: Elder Bar Turned Green, P&F High Pole and Entered Ichimoku Cloud.
Below are the commentary and chart from Wednesday (3/29):
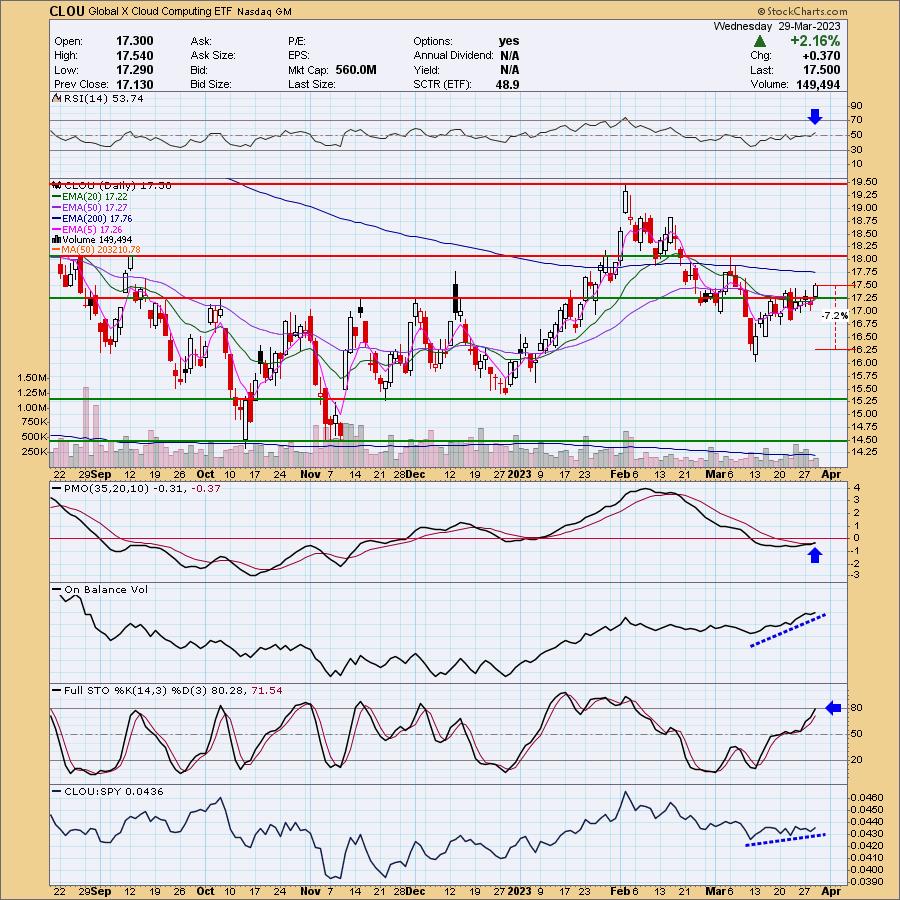
"CLOU is up +0.40% in after hours trading. CLOU saw a nice breakout today above the 5/20/50-day EMAs. It is maintaining its rising trend and with today's move above those key moving averages, we had a positive crossover. The 5-day EMA moved above the 20-day EMA for a ST Trend Model BUY Signal. The 20-day EMA is getting very close to the 50-day EMA. It will be a "Silver Cross" if it gets above and that would trigger an IT Trend Model BUY Signal. The RSI has moved into positive territory and the PMO generated a crossover BUY Signal. The OBV is confirming the rising trend. Stochastics just moved above 80 and relative strength is slightly better than the SPY right now. You could set a deeper stop, but really if it drops below $16.75, you won't really want it anymore. I have it set at 7.2% or $16.24."
Here is today's chart:
CLOU had a big day and that pushed it to the top of the list to be this week's "Darling". Everything was lined up on this chart and it followed-through beautifully. This speaks to the importance of relative strength, but the RSI, PMO and Stochastics were configured very bullishly. There is still plenty of upside potential so I would consider an entry on a pullback to support.
Don't forget, on Thursdays I look at reader-requested symbols, so shoot me an email at erin@decisionpoint.com. I read every email I receive and try to answer them all!
Dud:
Vista Oil & Gas SAB (VIST)
EARNINGS: 04/25/2023 (AMC)
Vista Energy SAB de CV is an oil and gas company, which engages in the exploration and production of oil and gas. It operates through Argentina and Mexico geographical segments. The firm's assets include Vaca Muerta, the largest shale oil and gas play under development outside North AMerica. The company was founded on March 22, 2017 and is headquartered in Miguel Hidalgo, Mexico.
Predefined Scans Triggered: Moved Above Upper Keltner Channel, New 52-week Highs and P&F Double Top Breakout.
Below are the commentary and chart from Thursday (3/30):
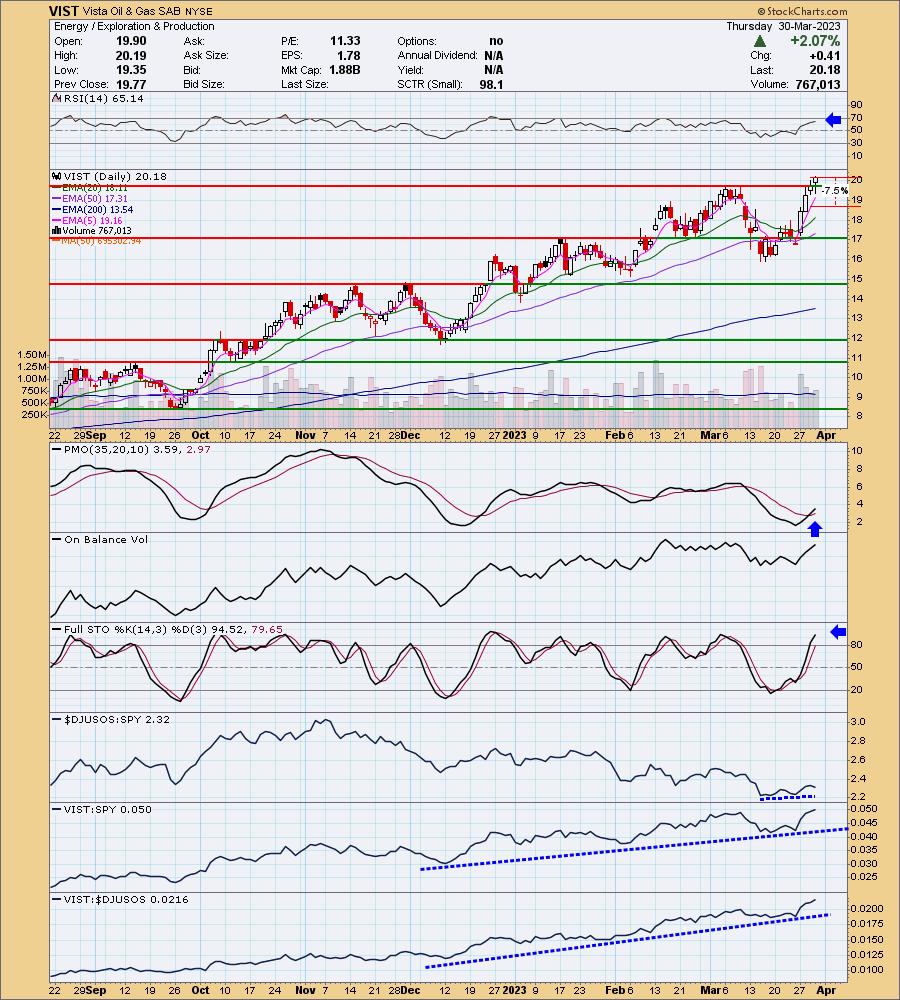
"VIST is down -0.10% in after hours trading. If you're going fishing in Exploration & Production, you couldn't do much better than VIST given its outperformance of the group for months. It also outperformed the SPY during that period. Today it broke out to new 52-week highs. The RSI is positive and the PMO looks great as it has generated a crossover BUY signal above the zero line. Volume is coming in. Stochastics are above 80. The group isn't outperforming the SPY right now, but nor is it underperforming. The stop is set about halfway down the prior trading range at 7.5% or $18.66."
Here is today's chart:
I mentioned yesterday that the group was not outperforming, that would be the one negative on the chart. Today saw a bearish engulfing candlestick. We really need to see this support level hold. Crude Oil is still looking healthy enough, but it may be cooling for a few days. I still like this one moving forward.
THIS WEEK's Sector Performance:
DecisionPoint Sector Scoreboard (Mechanical Trend Model Signals):
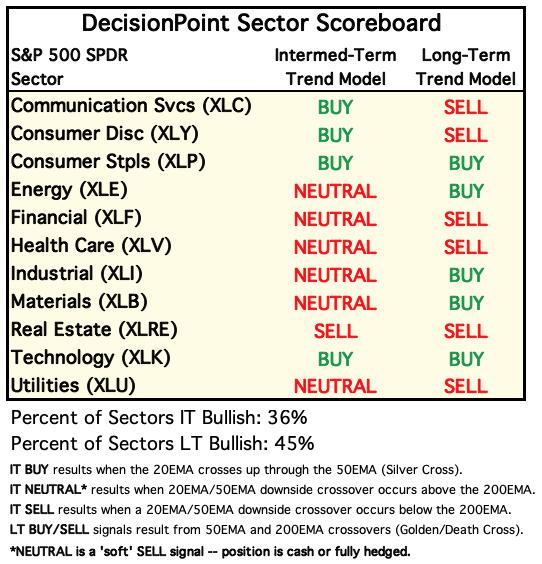
Click Here to view Carl's annotated Sector ChartList!
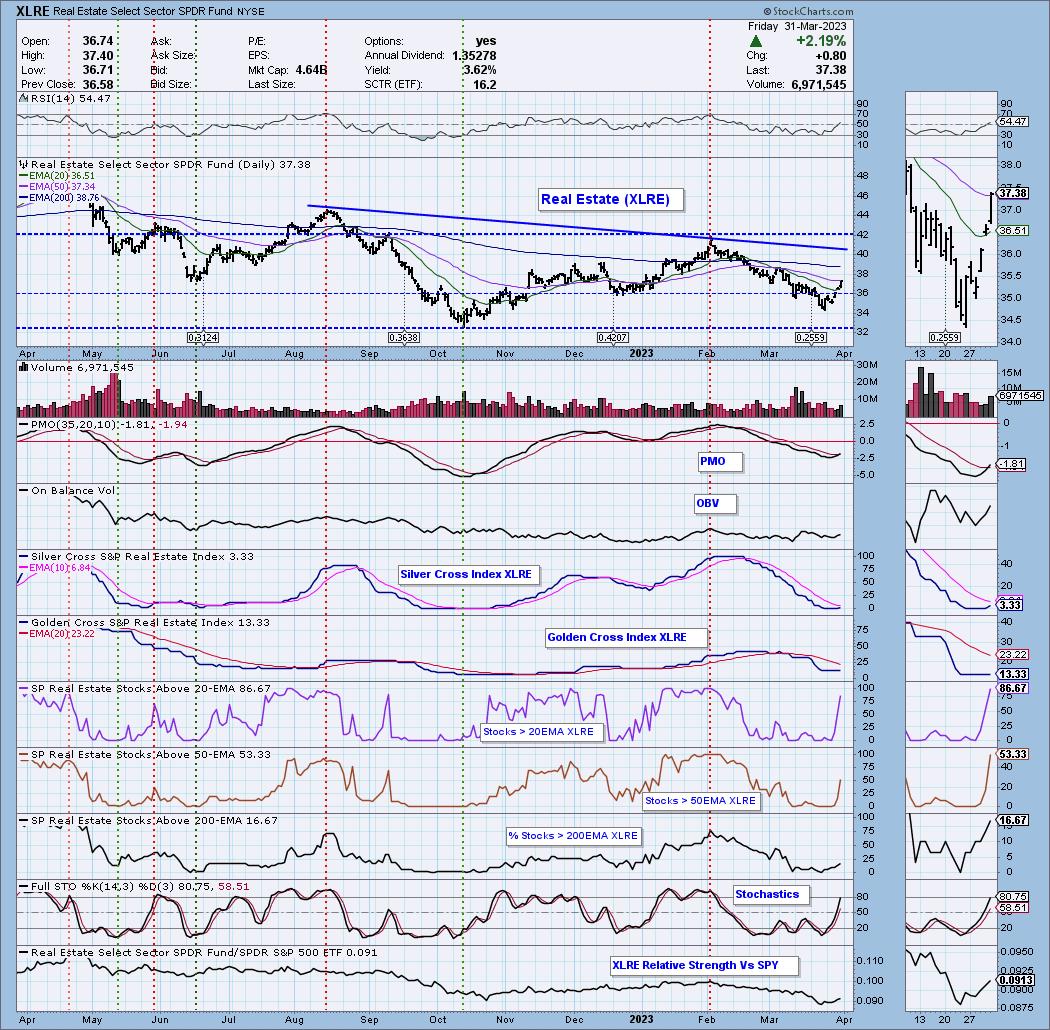
Sector to Watch: Real Estate (XLRE)
I noted the rally occurring today on XLRE, but I don't believe it had overcome resistance at the 50-day EMA. It did end up closing above which put it on the radar. A review under the hood shows bullish participation of stocks above their 20/50-day EMA and while %Stocks > 200-day EMA is small, it is improving. The Silver Cross Index has turned up. The RSI is positive and the PMO triggered a crossover BUY signal today. I also note that it is outperforming the SPY, something a lot of sectors can't say.
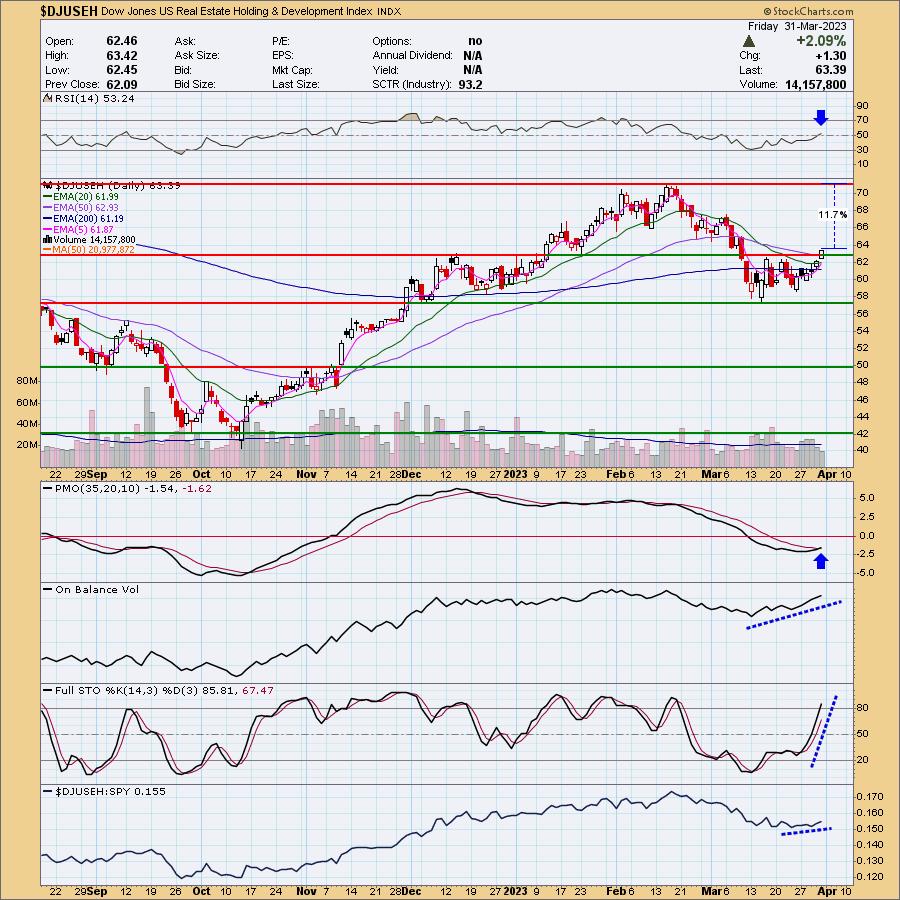
Industry Group to Watch: Real Estate Holding & Development ($DJUSEH)
As I discussed in the opening, most all of the industry groups within Real Estate look good so it shouldn't be as hard to find a winner. This group broke from a bullish ascending triangle (flat top, rising bottoms) and has plenty of upside potential. Volume is coming into this group based on the OBV and it is beginning to outperform. The RSI just moved positive and the PMO triggered a crossover BUY signal today. Stochastics are above 80. A few stocks you can review from this group: RDFN and FOR. During the trading room today I also pointed out the following stocks from Consumer Discretionary (XLY) which I thought would end up being the sector to watch: CPS, MOD, PAG and GPI.
Go to our Sector ChartList on DecisionPoint.com to get an in-depth view of all the sectors. On StockCharts.com you can find the Industry Summary.
Good Luck & Good Trading!
- Erin
erin@decisionpoint.com
Full Disclosure: I'm 28% long, 2% short.
Watch the latest episode of the DecisionPoint Trading Room with Carl & Erin Swenlin on Mondays 3:00p EST!
Technical Analysis is a windsock, not a crystal ball. --Carl Swenlin
NOTE: The stocks reported herein are from mechanical trading model scans that are based upon moving average relationships, momentum and volume. DecisionPoint analysis is then applied to get selections from the scans. The selections given should prompt readers to do a chart review using their own analysis process. This letter is not a call for a specific action to buy, sell or short any of the stocks provided. There are NO sure things or guaranteed returns on the selection of "diamonds in the rough."
Helpful DecisionPoint Links:
DecisionPoint Shared ChartList and DecisionPoint Chart Gallery
Price Momentum Oscillator (PMO)
Swenlin Trading Oscillators (STO-B and STO-V)
(c) Copyright 2023 DecisionPoint.com