
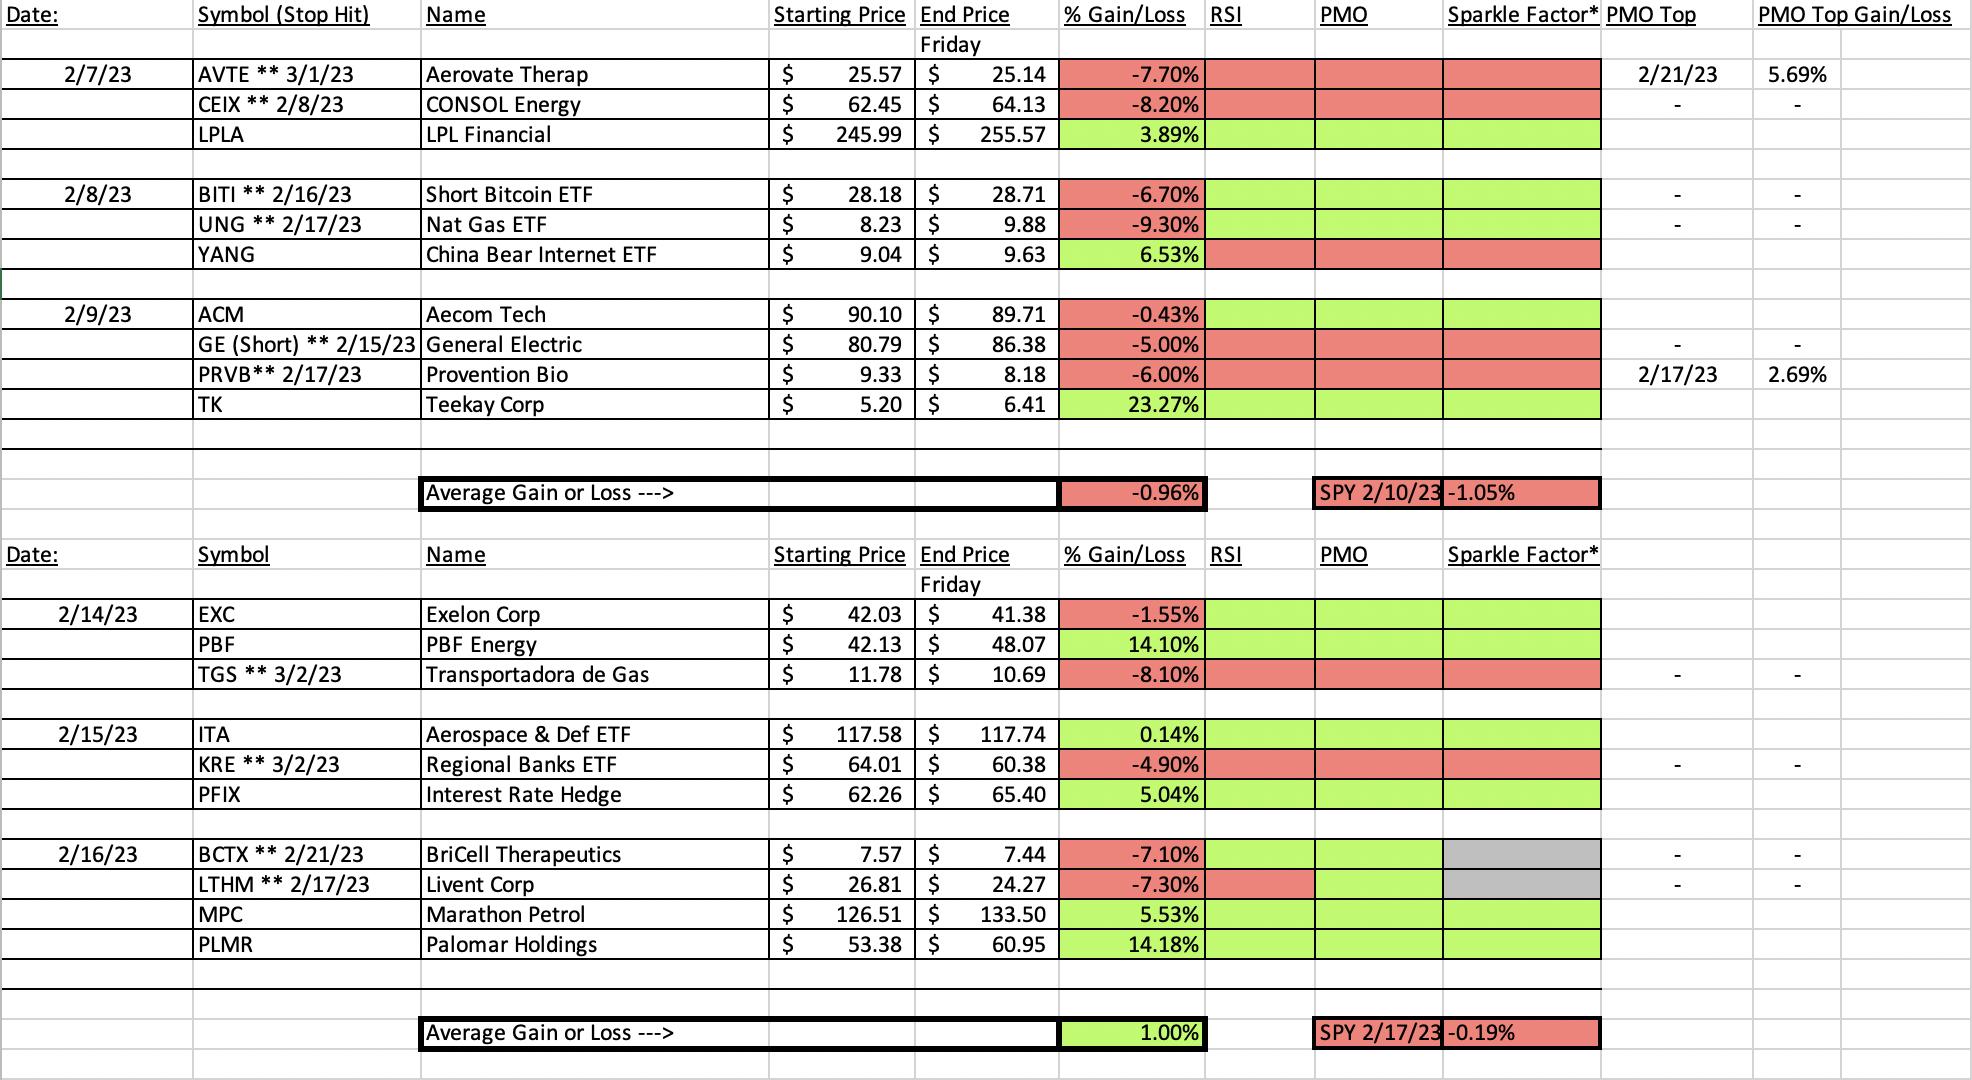
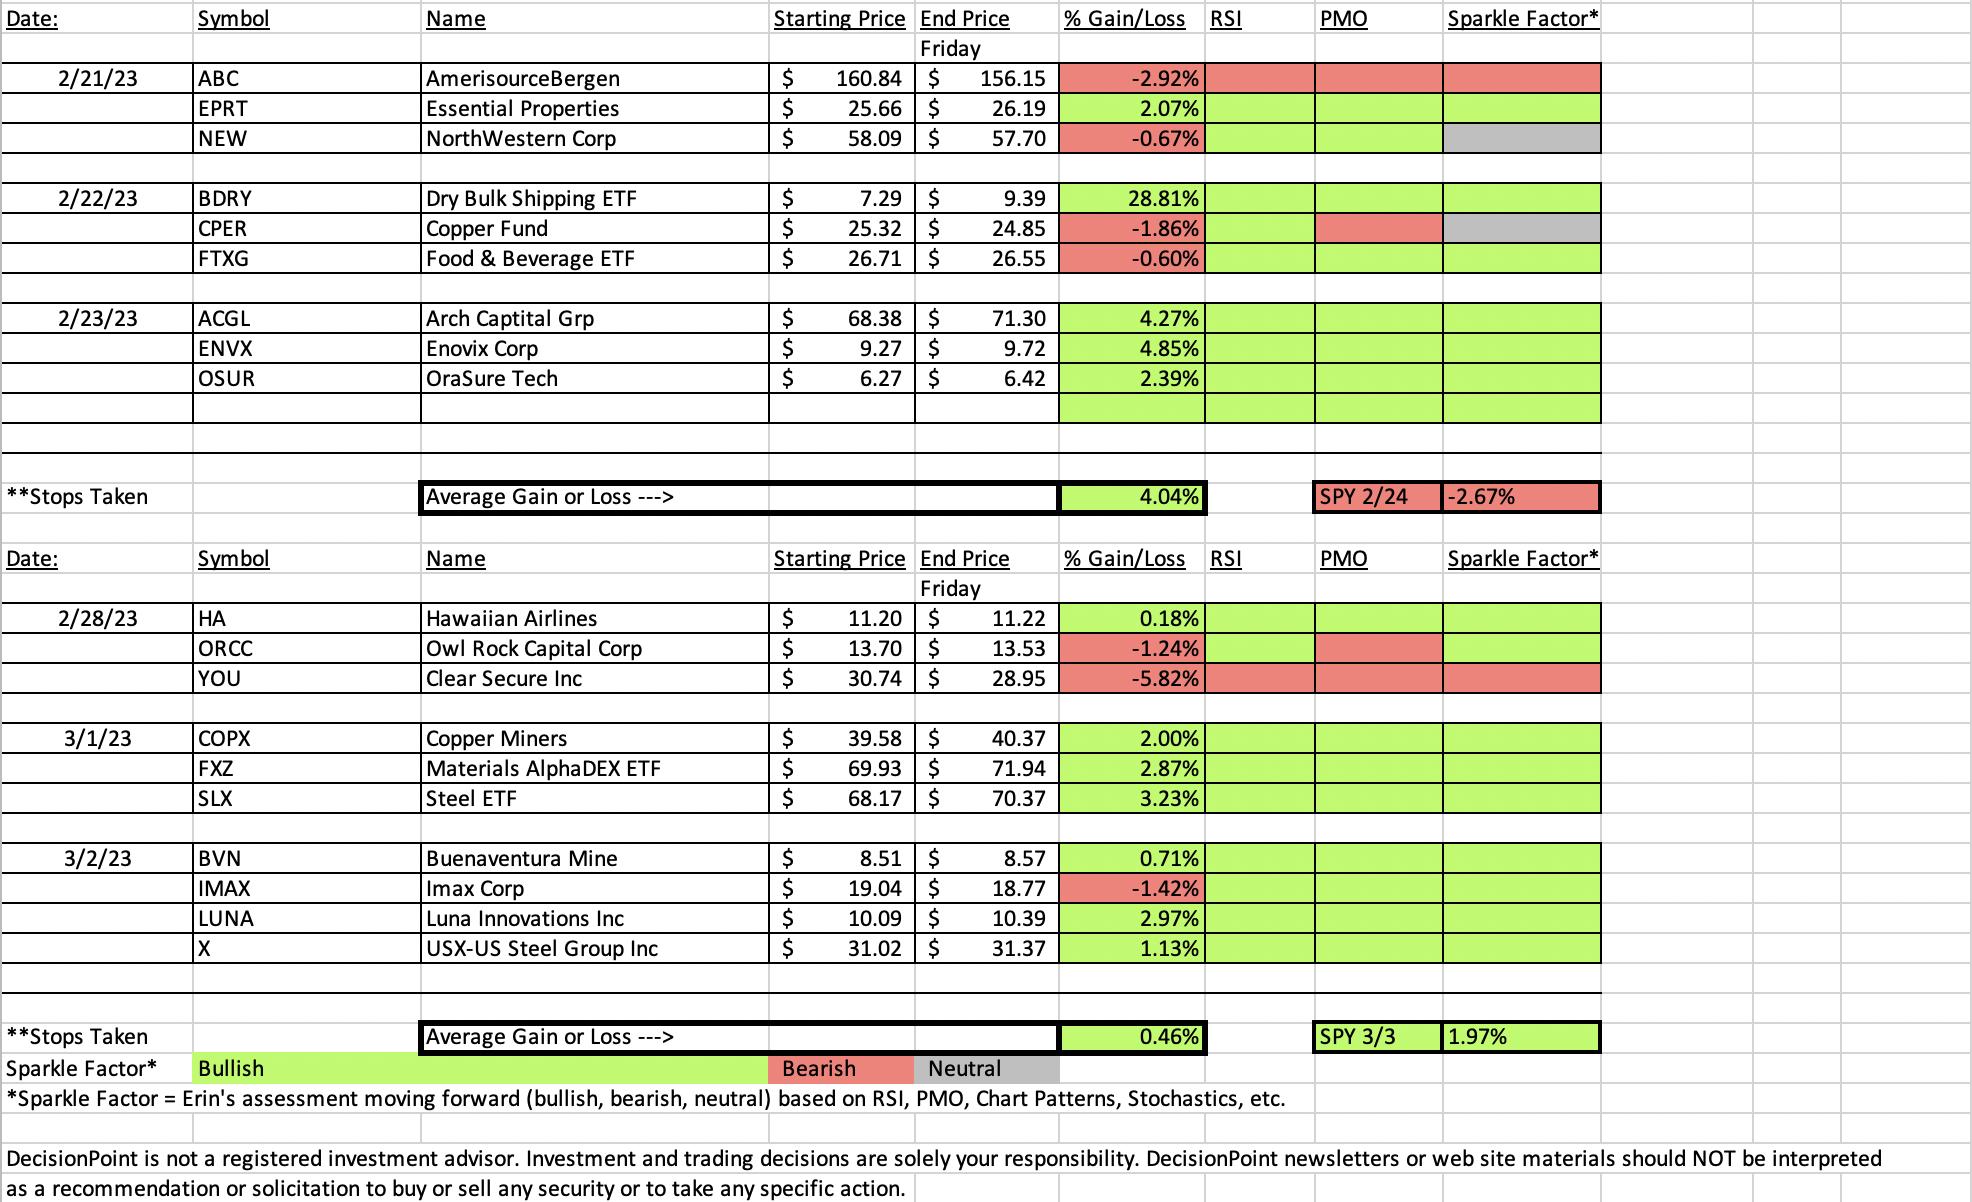
I'm definitely happy with how this week's "Diamonds in the Rough" performed. On average we were below the SPY's performance, but only three of ten were down on the week.
The big news is the addition of a monthly instead of weekly spreadsheet. It was suggested that I keep the last month's picks on the same spreadsheet so that we can track stops, current status, etc.
Let's go through the new additions.
- Stop Hit - I've added the date a stop hit next to the symbol. The percent %Loss will be listed as the stop percentage.
- PMO Top - To make it easier to see actual performance on stocks that have hit their stops, I've added two columns. If the stop is hit after a rally, I'm listing when the PMO topped and what the gain would've been if you had sold the position when the PMO topped. Some you'll note only have a "-". This means that there was no gain that could have been taken advantage of.
- Rolling Sparkle Factors - I will continue to update the columns that list whether the RSI is positive, PMO is rising and what I think of the position currently (Sparkle Factor). This includes on stocks/ETFs where the stop was hit. Many times they will recover and begin looking bullish again. This will help you manage your current Diamond holdings and contemplate new ones.
- Spreadsheet Publishing - I want to keep you up to date on the current month's holdings so I will start to include an updated spreadsheet on days I publish Diamonds. There will be no spreadsheet posted on Mondays. I will start notifying you when stops hit within the reports, but I will keep it to just the current month's holdings, it will be manageable that way for me. This is NOT a model portfolio. It will be rolling every week and I am not actively managing these positions.
I recommend that if you buy any stock, not just a "Diamond in the Rough", that you set up text alerts for when stops are hit (I'll be for Diamonds, I already do this for my own positions). Since I list both a price and a percentage, it should be fairly easy for you to do.
Have a great weekend!
Good Luck & Good Trading,
Erin

RECORDING LINK (3/3/2023):
Topic: DecisionPoint Diamond Mine (3/3/2023) LIVE Trading Room
Recording Link
Passcode: March#3rd
REGISTRATION for 3/10/2023:
When: Mar 10, 2023 09:00 AM Pacific Time (US and Canada)
Topic: DecisionPoint Diamond Mine (3/10/2023) LIVE Trading Room
Register in advance for this webinar HERE
After registering, you will receive a confirmation email containing information about joining the webinar.

Our latest DecisionPoint Trading Room recording (2/27/2023):
A few items about the spreadsheet: I've put on the spreadsheet whether the RSI is positive (green) or negative (red). The PMO column tells you if it is rising (green) or falling (red). Finally I've added my own "Sparkle Factor" that gives you my assessment going forward, bullish (green), bearish (red) or neutral (gray). The Sparkle Factor is basically my thoughts on whether I expect it to rise or fall. A neutral means it could really go either way so it could be added to a watch list. If you're in a stock I consider "neutral" going forward, the ball is in your court.
Darling:
VanEck Vectors Steel ETF (SLX)
EARNINGS: N/A
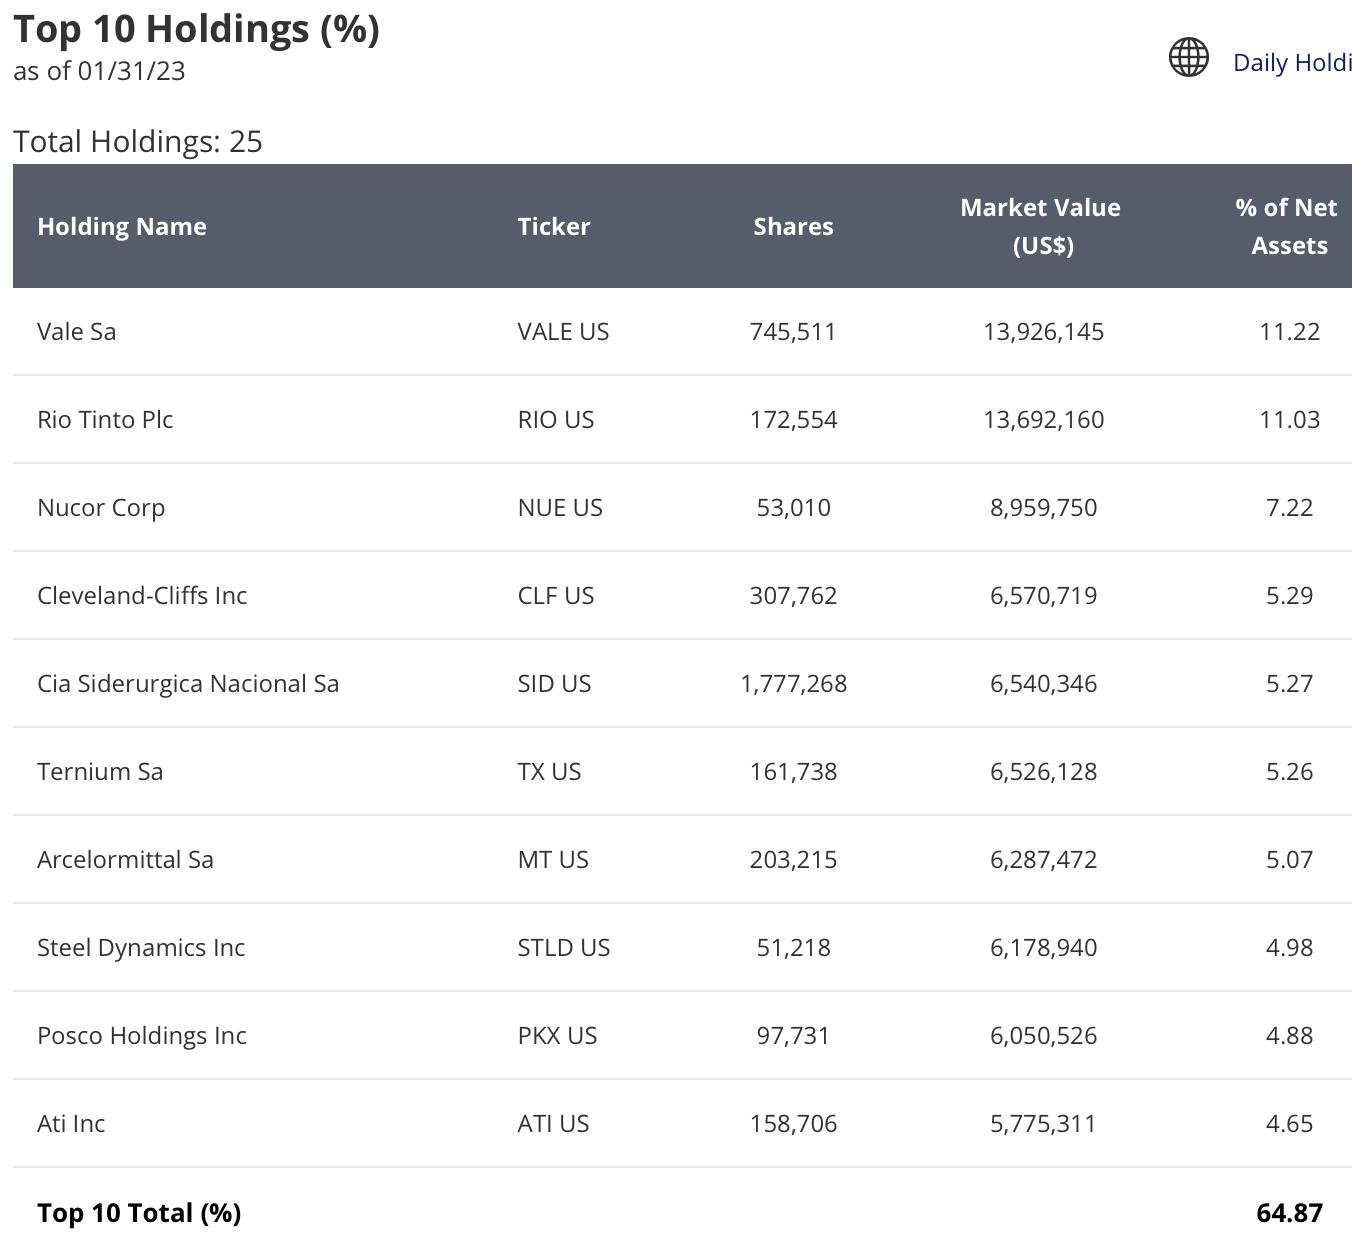
SLX tracks a market-cap-weighted index of global steel firms. Click HERE for more information.
Predefined Scans Triggered: Elder Bar Turned Green, New CCI Buy Signals and Parabolic SAR Buy Signals.
Here are the commentary and chart from Wednesday (3/1):
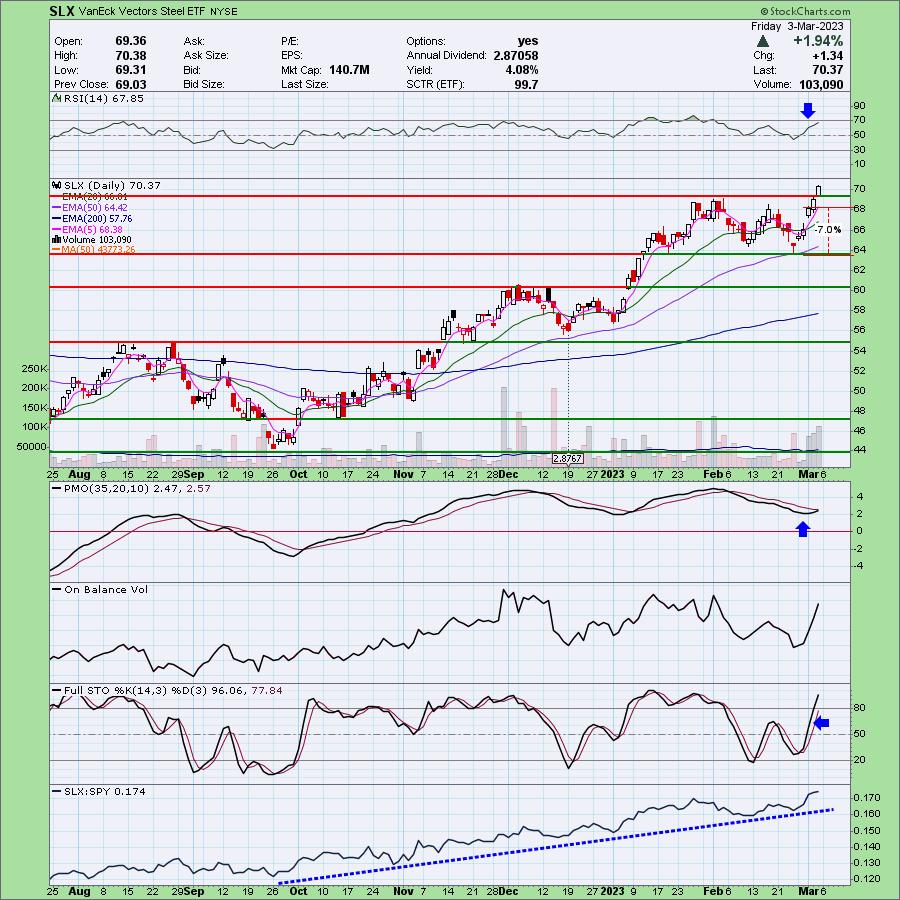
"SLX is down -0.62% in after hours trading. Today looks like a continuation or runaway gap following Monday's breakaway gap. The frustrating thing about gaps is that we don't really know what kind they are until we see follow-through. It could be a set up for a reverse island (gap down that leaves price as an "island"). I don't believe so given Monday's gap. The RSI is rising, positive and not overbought. The PMO has just turned up. Stochastics are rising in positive territory. Relative strength has been consistently good for months. The stop is set below support at 7% or around $63.39."
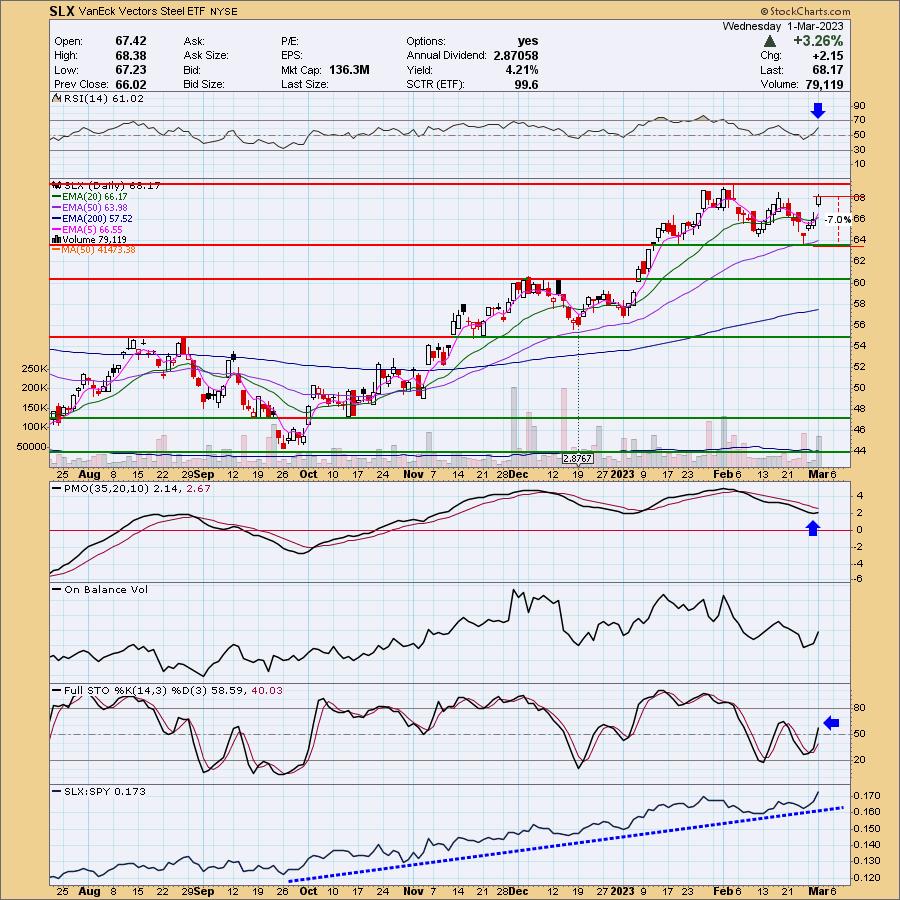
Here is today's chart:
SLX broke out above overhead resistance today and looks ready to continue much higher. The RSI is positive and not yet overbought. The PMO is going in for a crossover BUY signal. Volume is coming in strong based on the OBV and Stochastics have shot up above 80. Definitely a bullish Sparkle Factor.
Don't forget, on Thursdays I look at reader-requested symbols, so shoot me an email at erin@decisionpoint.com. I read every email I receive and try to answer them all!
Dud:
Clear Secure Inc. (YOU)
EARNINGS: 03/01/2023 (BMO)
Clear Secure, Inc. provides a technology platform, which enables frictionless and safe journeys using biometric identity. Its identity platform connects passengers to the cards in their wallet transforming the way passengers live, work, and travel, and also focuses on providing verification in several areas, such as events, healthcare, and sporting stadiums. The firm offers secured biometric identity verification to its customers from different industries through its CLEAR brand. The company was founded by Caryn Seidman-Becker and Kenneth Cornick in 2010 and is headquartered in New York, NY.
Predefined Scans Triggered: None.
Below are the commentary and chart from Tuesday (2/28):
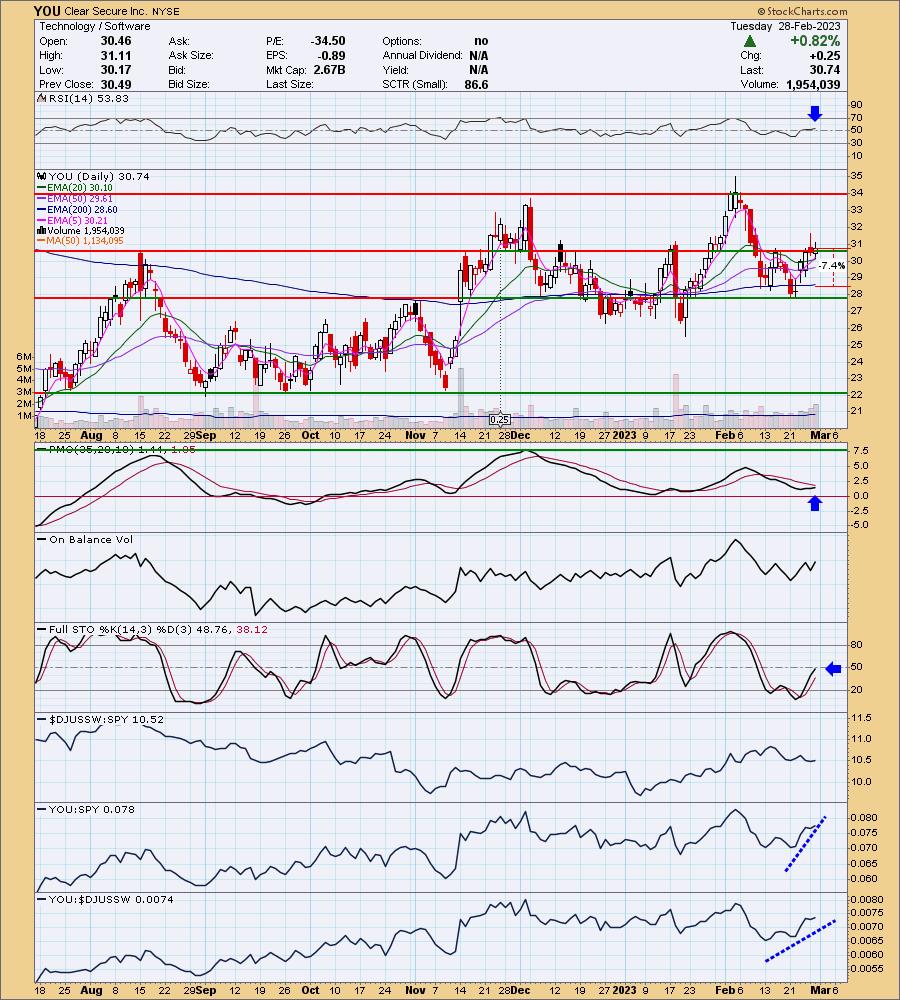
"YOU is up +0.55% in after hours trading. We have a bullish double-bottom pattern in the short term. The minimum upside target of the pattern is near overhead resistance at the December top. The RSI is positive, rising and far from overbought. The PMO has now turned up and is headed for a crossover BUY signal. Stochastics have just about reached positive territory above 50. Relative strength studies show that Software is still not showing much strength, but this stock is easily outperforming the group and the SPY. The stop is set below the 200-day EMA at 7.4% or $28.46."
Here is today's chart:
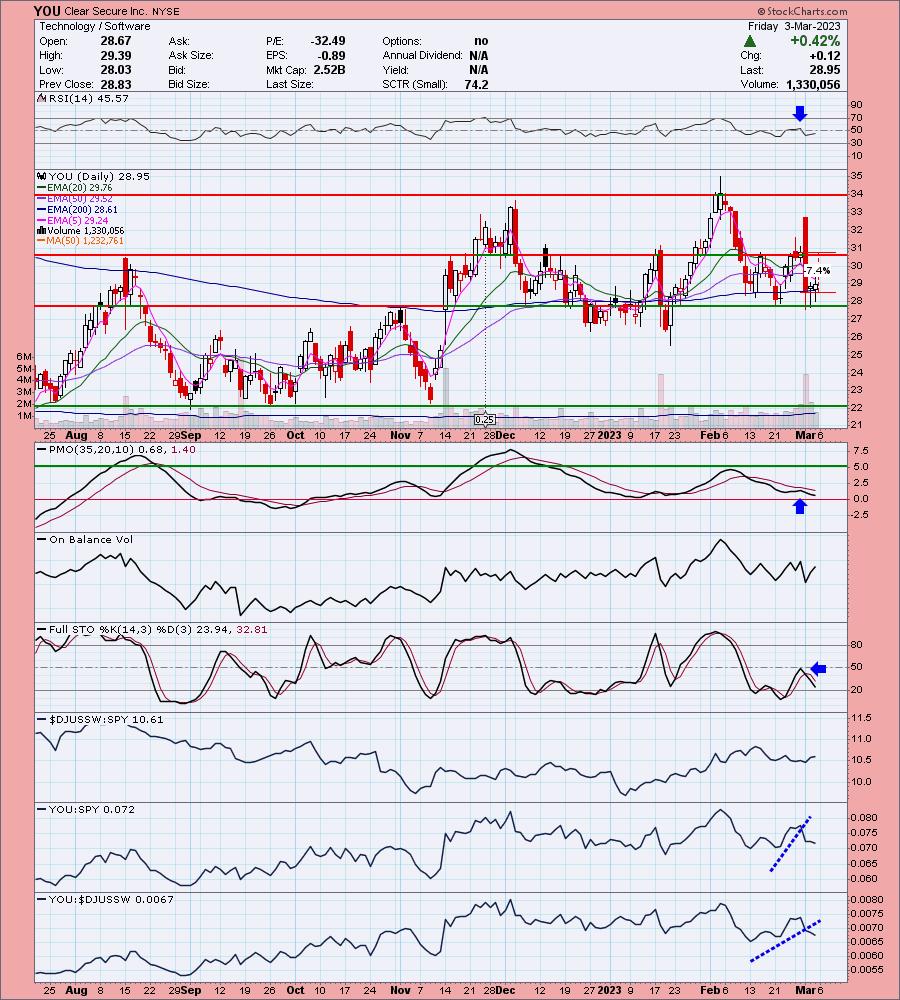
The stop nearly triggered the day after it was picked. It was a crazy trading day for the stock which ultimately finished much lower, forming a giant bearish engulfing candlestick. It's been making some headway since then, but I think I would give this one up if you get close to your original buy point. The RSI is negative and the PMO is falling now. While it could make a move to recapture $31, I'd be careful with it. It doesn't have that much upside potential right now.
THIS WEEK's Sector Performance:
DecisionPoint Sector Scoreboard (Mechanical Trend Model Signals):
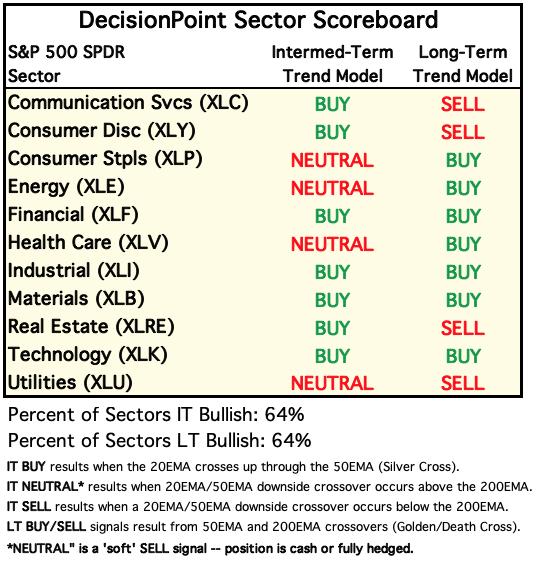
Click Here to view Carl's annotated Sector ChartList!
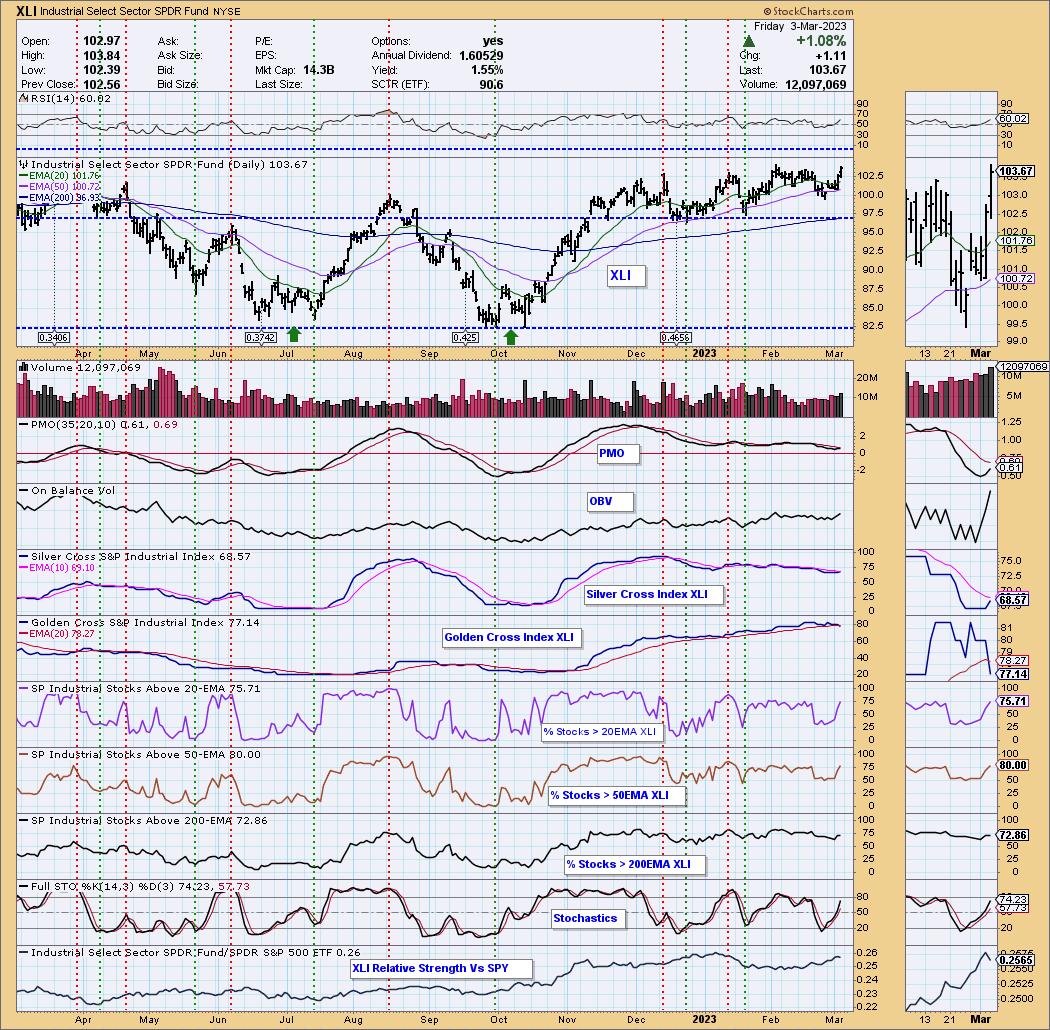
Sector to Watch: Industrials (XLI)
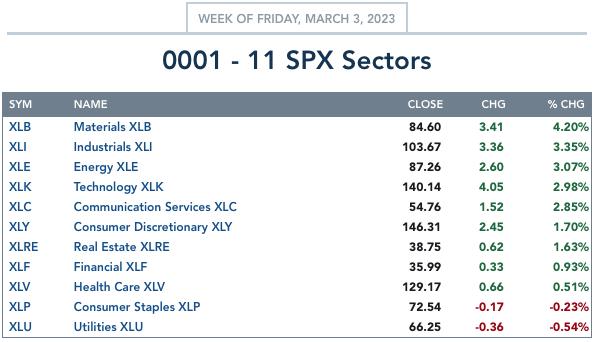
It was a three-way tie today. I really liked the XLB and XLE charts as well. XLB probably is the strongest of the three, but I want to bring you something new to the table. XLE is tied to Crude Oil and Crude is in a trading range, about halfway to the top. I believe Energy will continue higher, I just think upside potential may be capped given the trading range on Crude Oil.
The one problem with XLI is the Golden Cross Index (GCI). It looked great yesterday, but today it careened lower to close beneath its signal line. I forgave this based on the solid participation numbers below the surface. Before we talk about that, notice that price action today gave us a New 52-week high. The RSI is positive, rising and not overbought. The PMO is rising after bullishly bottoming above the zero line. Participation of stocks above their 20/50/200-day EMA show 70%+ in each category; that's bullish. Stochastics are nearing 80 and relative strength has been excellent.
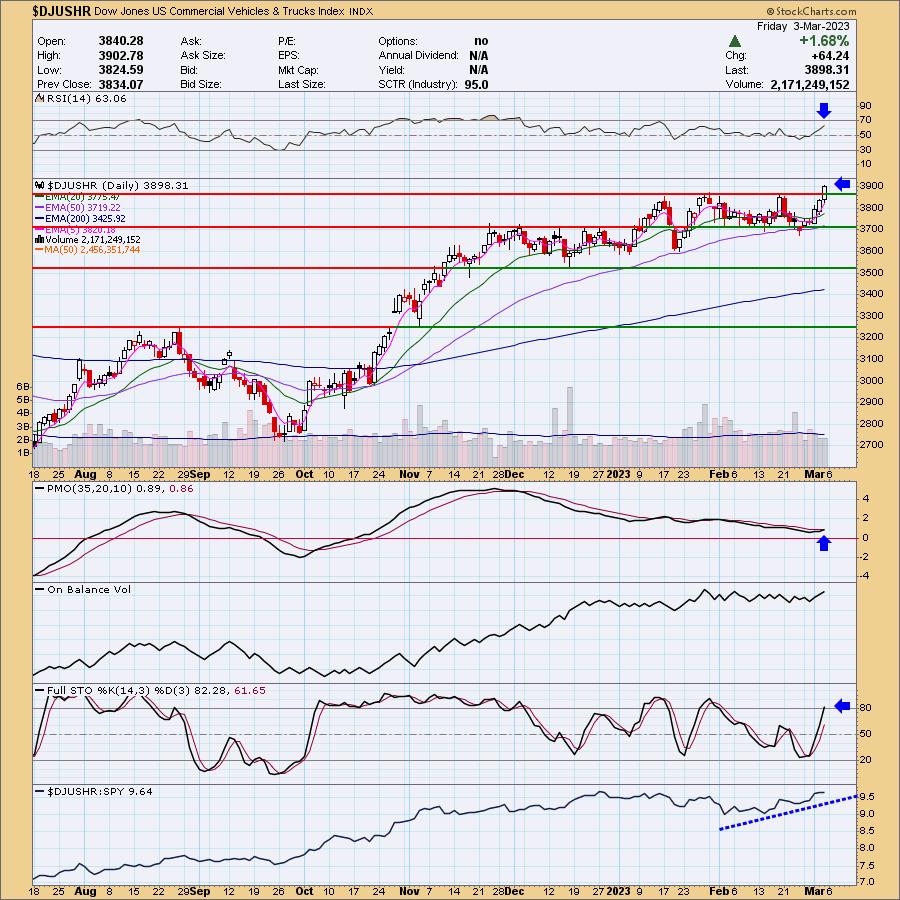
Industry Group to Watch: Commercial Vehicles & Trucks ($DJUSHR)
I liked this chart primarily because it looks like XLI above. We have a new breakout and a new PMO crossover BUY signal. The RSI is positive, rising and not overbought. Stochastics are above 80. This group looks ready to move much higher. A few stocks we liked in the Diamond Mine trading room this morning were CAT, KMTUY and HEES.
Go to our Sector ChartList on DecisionPoint.com to get an in-depth view of all the sectors. On StockCharts.com you can find the Industry Summary.
Good Luck & Good Trading!
- Erin
erin@decisionpoint.com
Full Disclosure: I'm 22% exposed. Next week is expansion time. 35% is my goal.
Watch the latest episode of the DecisionPoint Trading Room with Carl & Erin Swenlin on Mondays 3:00p EST!
Technical Analysis is a windsock, not a crystal ball. --Carl Swenlin
NOTE: The stocks reported herein are from mechanical trading model scans that are based upon moving average relationships, momentum and volume. DecisionPoint analysis is then applied to get five selections from the scans. The selections given should prompt readers to do a chart review using their own analysis process. This letter is not a call for a specific action to buy, sell or short any of the stocks provided. There are NO sure things or guaranteed returns on the daily selection of "diamonds in the rough."
Helpful DecisionPoint Links:
DecisionPoint Shared ChartList and DecisionPoint Chart Gallery
Price Momentum Oscillator (PMO)
Swenlin Trading Oscillators (STO-B and STO-V)
(c) Copyright 2023 DecisionPoint.com