
While Consumer Discretionary and Technology shined today, my Diamond scans were pretty clear that Energy was the place to be. The scan results were dominated by Energy stocks. I picked two in this sector for you, but there are plenty of other choices in the "Runner-ups" list.
I am including a Utility today. Shocking given that sector's struggles, but this company is a consistent out performer that deserves some attention today.
Good Luck & Good Trading,
Erin
Today's "Diamonds in the Rough": EXC, PBF and TGS.
Other requests: E, HES, MPC, PXD, SLB, TTE, ACGL and CI.

RECORDING LINK (2/10/2023):
Topic: DecisionPoint Diamond Mine (2/10/2023) LIVE Trading Room
Passcode: Feb@10th
REGISTRATION for 2/17/2023:
When: Feb 17, 2023 09:00 AM Pacific Time (US and Canada)
Topic: DecisionPoint Diamond Mine 2/17/2023 LIVE Trading Room
Register in advance for this webinar HERE
After registering, you will receive a confirmation email containing information about joining the webinar.

Here is the last recording (2/6):
Welcome to DecisionPoint Diamonds, wherein I highlight ten "Diamonds in the Rough" per week. These are selected from the results of my DecisionPoint Scans which search for stocks that could benefit from the trend and condition of the market. Remember, these are not recommendations to buy or sell, but are the most interesting of the stocks that surfaced in my scans. My objective is to save you the work of the initial, tedious culling process, but you need to apply your own analysis to see if these stocks pique your interest as well. There are no guaranteed winners here!
"Predefined Scans Triggered" are taken from StockCharts.com using the "Symbol Summary" option instead of a "SharpChart" on the workbench.
Stop levels are all rounded down.
Exelon Corp. (EXC)
EARNINGS: 02/14/2023 (BMO) ** Reported Today **
Exelon Corp. operates as a utility services holding company, which engages in the energy generation, power marketing, and energy delivery business. It operates through the following segments: Mid Atlantic, Midwest, New York, Electric Reliability Council of Texas (ERCOT) and other Power Regions. The Mid-Atlantic segment represents operations in the eastern half of PJM, which includes New Jersey, Maryland, Virginia, West Virginia, Delaware, the District of Columbia and parts of Pennsylvania and North Carolina. The Midwest segment operates in the western half of PJM, which includes portions of Illinois, Pennsylvania, Indiana, Ohio, Michigan, Kentucky and Tennessee, and the United States footprint of MISO, excluding MISO's Southern Region, which covers all or most of North Dakota, South Dakota, Nebraska, Minnesota, Iowa, Wisconsin, the remaining parts of Illinois, Indiana, Michigan and Ohio not covered by PJM, and parts of Montana, Missouri and Kentucky. The New York (NY) segment provides operations within ISO–NY, which covers the state of New York in its entirety. The ERCOT segment includes operations within the Electric Reliability Council of Texas, covering most of the state of Texas. The Other Power Regions consist of the operations in New England, South, West, and Canada. The company was founded in February 1999 and is headquartered in Chicago, IL.
Predefined Scans Triggered: Parabolic SAR Buy Signals.
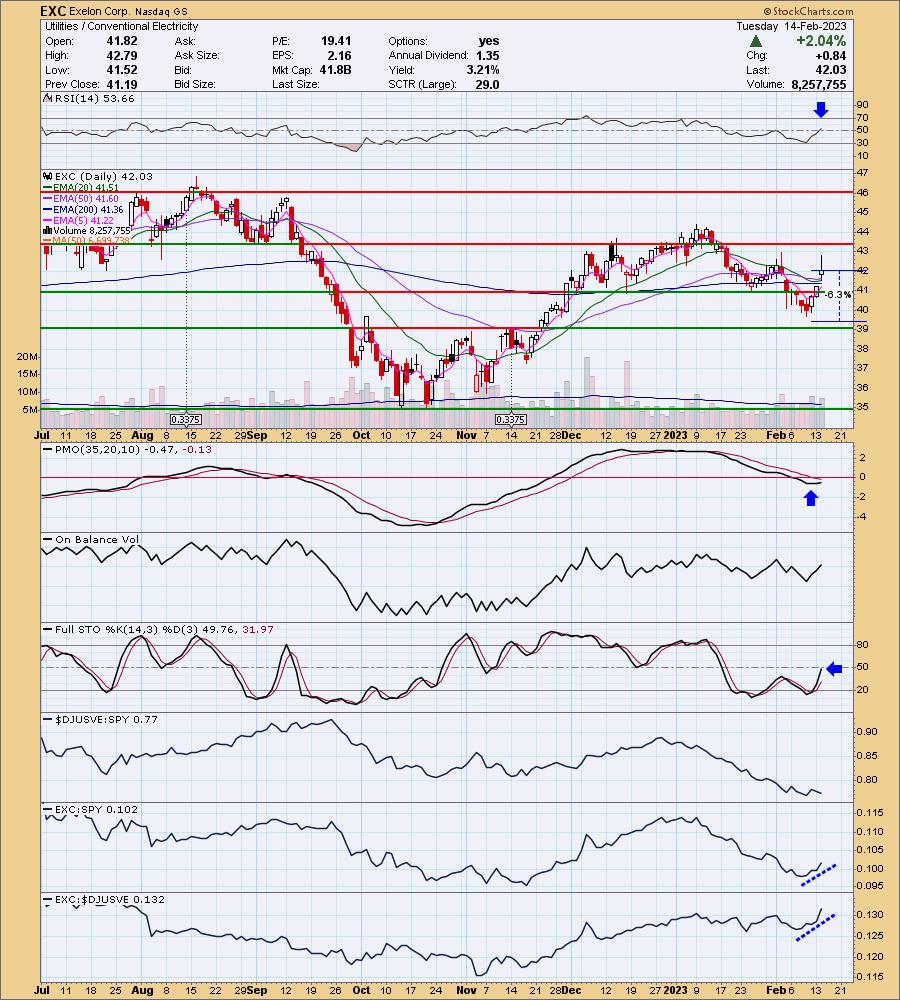
EXC is +0.12% in after hours trading. They reported before the bell today so I'm not expecting any unusual earnings activity. Today's gap up suggests earnings were received well. Today's gap up put price above all of the key moving averages. The RSI is just now positive and the PMO is rising toward a crossover BUY signal. Stochastics aren't in positive territory yet, but they are rising strongly. The group has not done well and we know the sector hasn't either, but EXC seems to be an exception to that rule given its outperformance against the group and the SPY. I've set the stop below the last trough at 6.3% around $39.38.
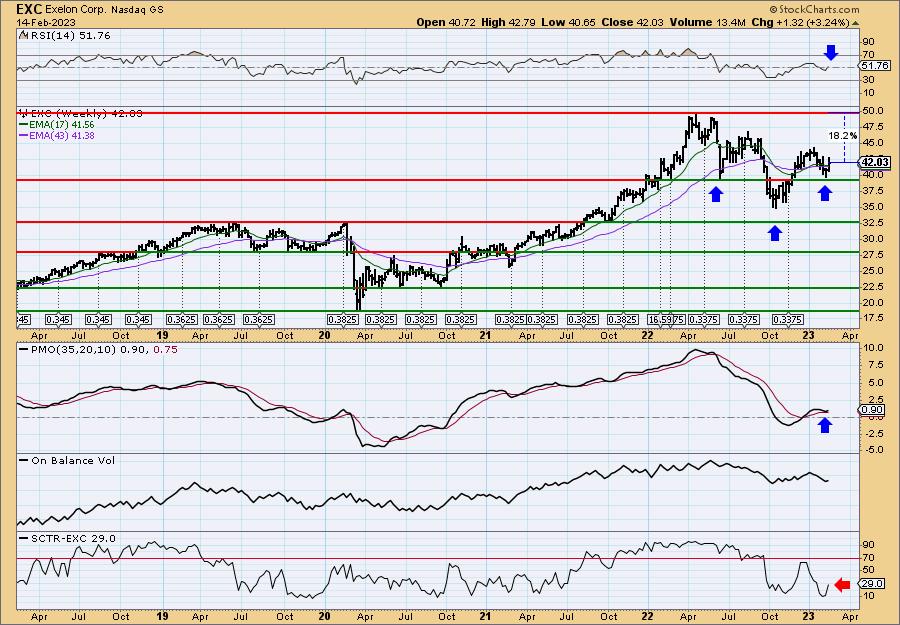
The weekly RSI is back in positive territory and the weekly PMO looks especially bullish as it bottoms above the signal line. I can even spy a bullish reverse head and shoulders. The SCTR needs help, but it does look to be on its way higher. Upside potential is over 18%.
PBF Energy Inc. (PBF)
EARNINGS: 02/16/2023 (BMO) ** REPORTS TOMORROW! **
PBF Energy, Inc. engages in the operation of a petroleum refiner and supplies unbranded transportation fuels, heating oil, petrochemical feed stocks, lubricants, and other petroleum products in the United States. It operates through the following segments: Refining and Logistics. The Refining segment refines crude oil and other feed stocks into petroleum products. The Logistics segment owns, leases, operates, develops, and acquires crude oil and refined petroleum products terminals, pipelines, storage facilities, and logistics assets. The company was founded on March 1, 2008 and is headquartered in Parsippany, NJ.
Predefined Scans Triggered: None.
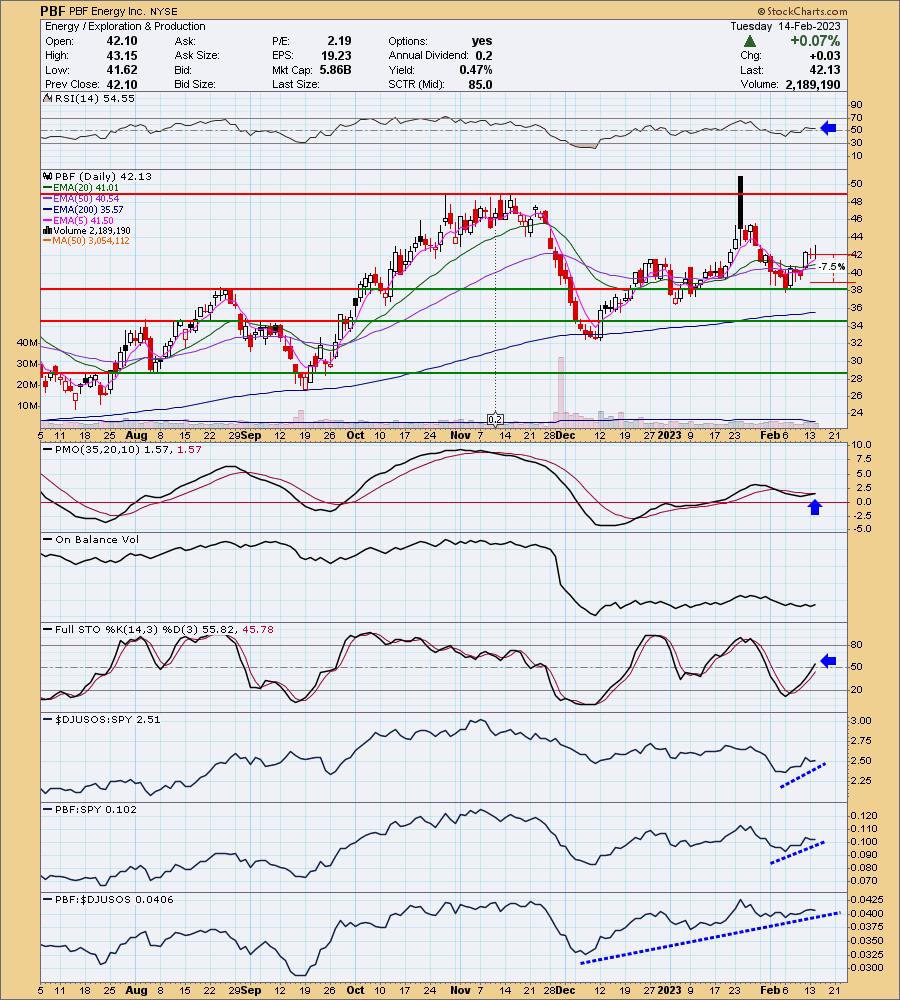
PBF is up +0.05% in after hours trading. This one reports tomorrow, so wait until the dust settles or at least be mindful if you enter tomorrow. I hesitated to include it, but many of the Energy choices were reporting. I like the bounce of support at the August top. The PMO gave us a crossover BUY signal today. The RSI is positive and Stochastics are rising in positive territory. Relative strength is very good as the group is outperforming and PBF is outperforming it and the SPY. The stop couldn't be set below the last low as it would be too deep, but if you enter on a pullback, you might be able to set that up. Consider a stop around 7.5% at $38.97.
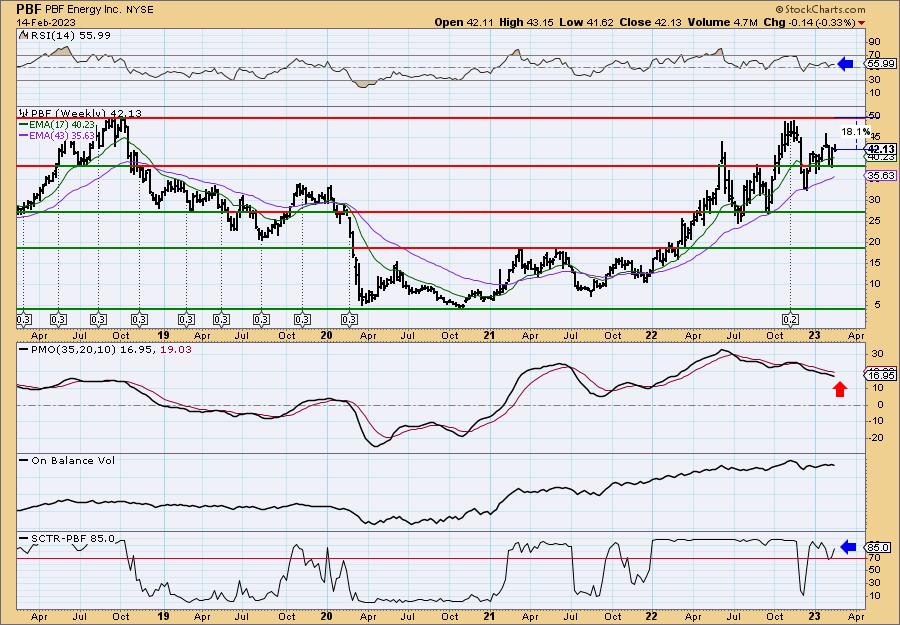
The only negative is that the weekly PMO is falling. Other than that, the weekly RSI is positive and has been all year. The SCTR is in the "hot zone" above 70. We call it the "hot zone" because it implies that the stock/ETF is in the top 30% of its "universe" (large-, mid-, small-caps and ETFs) as far as trend and condition, particularly in the intermediate and long terms. Upside potential is a little over 18%.
Transportadora De Gas Sur (TGS)
EARNINGS: 03/09/2023 (AMC)
Transportadora de Gas del Sur SA engages in the production and commercialization of natural gas liquids. It operates through the following segments: Natural Gas Transportation, Production and Commercialization of Liquids, Other Services, and Telecommunications. The Natural Gas Transportation segment includes transportation, exchange, and displacement of natural gas; and the operation service and maintenance of the assets affected to the natural gas transport service. The Production and Commercialization of Liquids segment consists of the production and marketing of liquids on its own account and on behalf of third parties, and other liquid services. The Other Services segment focuses on the treatment and separation of impurities and compression of natural gas, which may include the capture and transport of gas reservoirs, as well as inspection and maintenance services for compressor plants and gas pipelines, and management services for expansion and steam generation works for the electricity production. The Telecommunications segment offers telecommunication services through Telcosur. The company was founded on December 28, 1992 and is headquartered in Buenos Aires, Argentina.
Predefined Scans Triggered: New CCI Buy Signals.
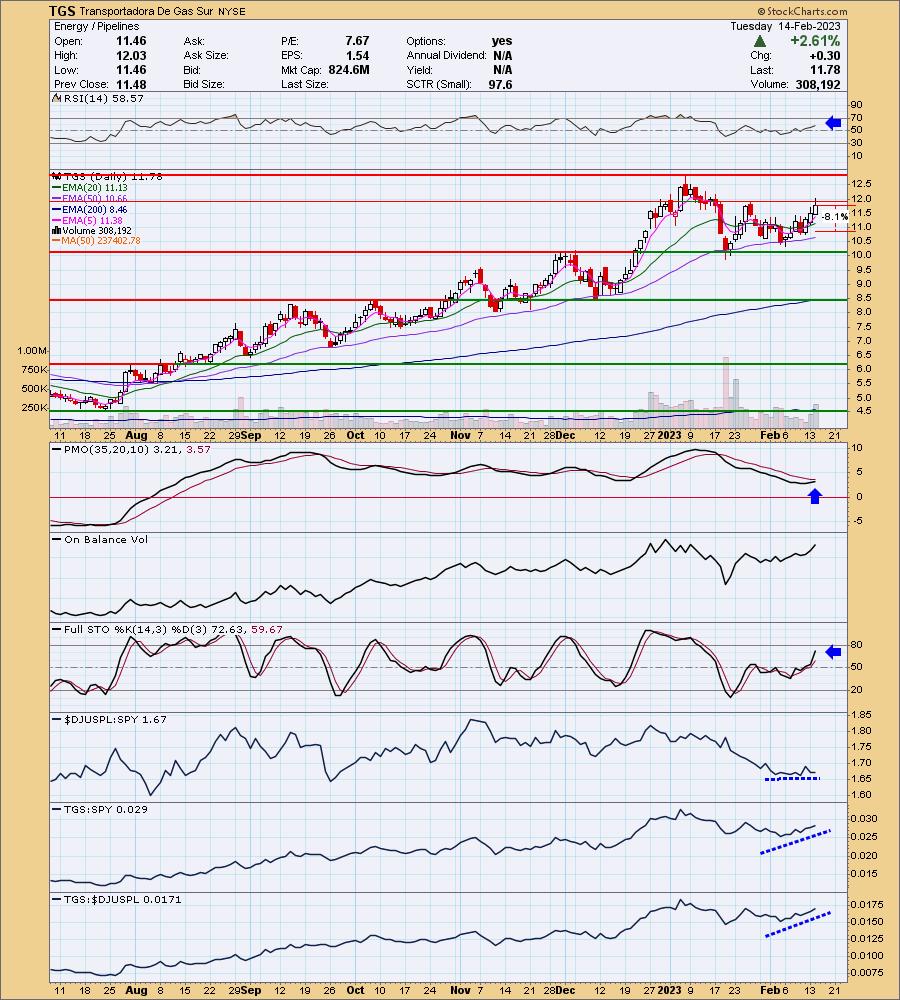
TGS is unchanged in after hours trading. I'm not particularly thrilled with this industry group within Energy, but this one is outperforming. The RSI is positive, rising and not overbought. The PMO is rising toward a crossover BUY signal, showing new momentum. Stochastics are rising in positive territory and are headed toward territory above 80 which is bullish. I've set the stop between the 20-day EMA and the 50-day EMA around 8.1% or $10.82.
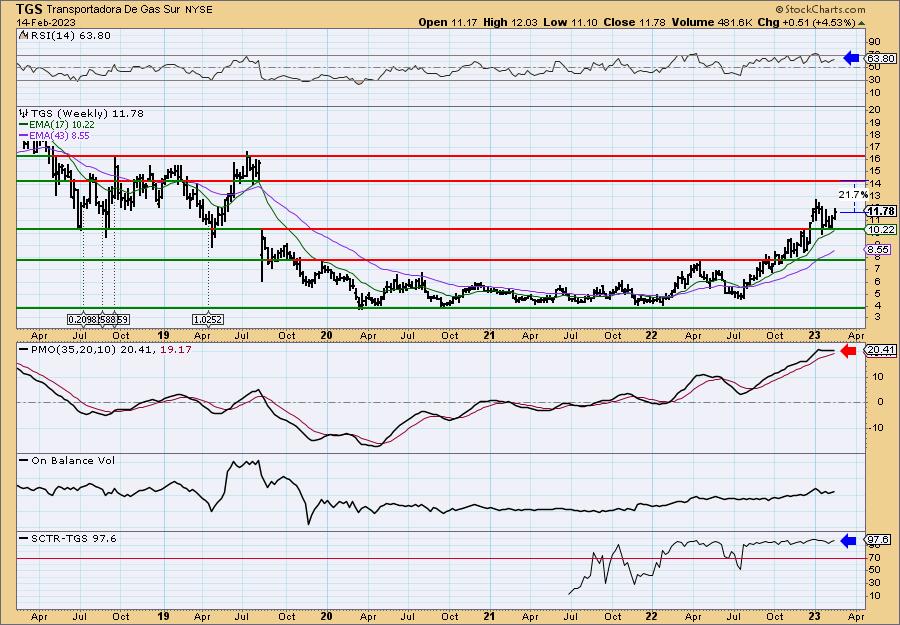
The weekly RSI has been positive for months and the SCTR is top-notch at 97.6%. You can see the small breakout from the declining trend. The weekly PMO is overbought which isn't a good look, but it isn't really declining. I see upside potential above 21%.
Don't forget, on Thursdays I look at reader-requested symbols, click HERE to send me an email. I read every email I receive and try to answer them all!
Current Market Outlook:
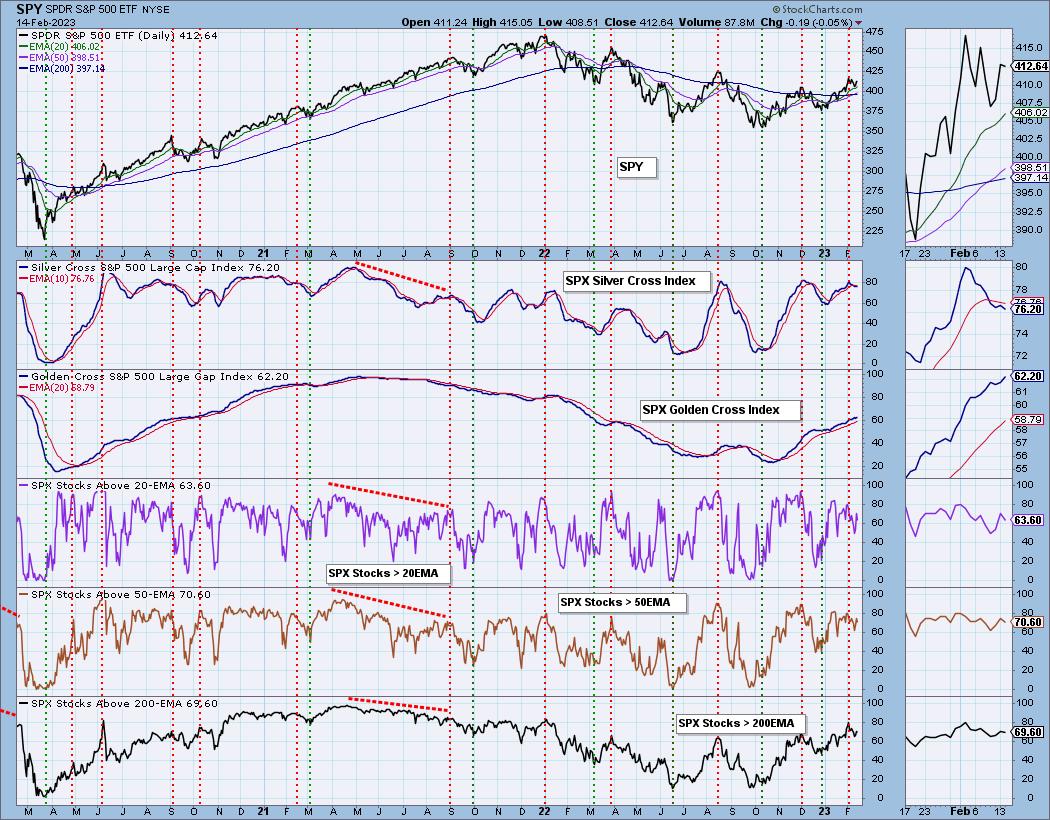
Market Environment: It is important to consider the odds for success by assessing the market tides. The following chart uses different methodologies for objectively showing the depth and trend of participation for intermediate- and long-term time frames.
- The Silver Cross Index (SCI) shows the percentage of SPX stocks on IT Trend Model BUY signals (20-EMA > 50-EMA)
- The Golden Cross Index (GCI) shows the percentage of SPX stocks on LT Trend Model BUY signals (50-EMA > 200-EMA)
Don't forget that as a "Diamonds" member, you have access to our GCI/SCI curated ChartList on DecisionPoint.com. You'll find it under "Members Only" links on the left side on the Blogs and Links Page.
Here is the current chart:
Full Disclosure: I am 18% exposed.
I'm required to disclose if I currently own a stock I mention and/or may buy/short it within the next 72 hours.
"Technical Analysis is a windsock, not a crystal ball." - Carl Swenlin
(c) Copyright 2023 DecisionPoint.com
Watch the latest episode of DecisionPoint Trading Room with Carl & Erin Swenlin on Mondays 7:00p EST or on the DecisionPoint playlist on the StockCharts TV YouTube channel here!
NOTE: The stocks reported herein are from mechanical trading model scans that are based upon moving average relationships, momentum and volume. DecisionPoint analysis is then applied to get five selections from the scans. The selections given should prompt readers to do a chart review using their own analysis process. This letter is not a call for a specific action to buy, sell or short any of the stocks provided. There are NO sure things or guaranteed returns on the daily selection of "Diamonds in the Rough."
Regarding BUY/SELL Signals: The signal status reported herein is based upon mechanical trading model signals and crossovers. They define the implied bias of the price index/stock based upon moving average relationships and momentum, but they do not necessarily call for a specific action. They are information flags that should prompt chart review. Further, they do not call for continuous buying or selling during the life of the signal. For example, a BUY signal will probably (but not necessarily) return the best results if action is taken soon after the signal is generated. Additional opportunities for buying may be found as price zigzags higher, but the trader must look for optimum entry points. Conversely, exit points to preserve gains (or minimize losses) may be evident before the model mechanically closes the signal.
Helpful DecisionPoint Links:
DecisionPoint Shared ChartList and DecisionPoint Chart Gallery
Price Momentum Oscillator (PMO)
Swenlin Trading Oscillators (STO-B and STO-V)
For more links, go to DecisionPoint.com