
As the headline implies, I have a stock that is beginning to reverse and the indicators are beginning to sparkle. The industry group itself is looking very interesting. There happens to be an ETF that covers this industry that you could look at as a safer trade.
Sorry for extending the anticipation, but remember, the first two sentences can be seen on our Blogs and Links page and I don't want to unintentionally give away any "Diamonds in the Rough" for free.
The industry group is Airlines. The ETF version is JETS. The stock I'm going to highlight today is Hawaiian Airlines (HA). This one isn't far away from 2020 bear market lows and is starting what looks like a solid reversal.
I had two Asset Managers that I narrowed down from the scan results, I opted to present the one with the best weekly chart, ORCC. The other is listed in the "Runner-ups", GBDC.
Finally, I finish with a Software company, Clear Secure (YOU). It reports tomorrow morning, but investors must be anticipating good news as it is up +0.55% in after hours trading. I hate presenting stocks right before earnings, but I also don't want to leave out a good stock just because it is reporting.
Good Luck & Good Trading,
Erin
Today's "Diamonds in the Rough": HA, ORCC and YOU.
Other requests: AVD, AXSM, BRC, CLX, GBDC, OR and SCPL.

RECORDING LINK (2/24/2023):
Topic: DecisionPoint Diamond Mine (2/24/2023) LIVE Trading Room
Passcode: Feb#24th
REGISTRATION for 3/3/2023:
When: Mar 3, 2023 09:00 AM Pacific Time (US and Canada)
Topic: DecisionPoint Diamond Mine (3/3/2023) LIVE Trading Room
Register in advance for this webinar HERE
After registering, you will receive a confirmation email containing information about joining the webinar.

Here is the last recording (2/27):
Recording Dated: 2/27/2023
Welcome to DecisionPoint Diamonds, wherein I highlight ten "Diamonds in the Rough" per week. These are selected from the results of my DecisionPoint Scans which search for stocks that could benefit from the trend and condition of the market. Remember, these are not recommendations to buy or sell, but are the most interesting of the stocks that surfaced in my scans. My objective is to save you the work of the initial, tedious culling process, but you need to apply your own analysis to see if these stocks pique your interest as well. There are no guaranteed winners here!
"Predefined Scans Triggered" are taken from StockCharts.com using the "Symbol Summary" option instead of a "SharpChart" on the workbench.
Stop levels are all rounded down.
Hawaiian Holdings, Inc. (HA)
EARNINGS: 05/02/2023 (AMC)
Hawaiian Holdings, Inc. is a holding company, which engages in the provision of air transportation services. It offers cargo handling and passenger flights between the Hawaiian Islands and its neighbor island routes. It operates through the Domestic and Pacific geographic segments. The company was founded in January 1929 and is headquartered in Honolulu, HI.
Predefined Scans Triggered: Bullish MACD Crossovers.
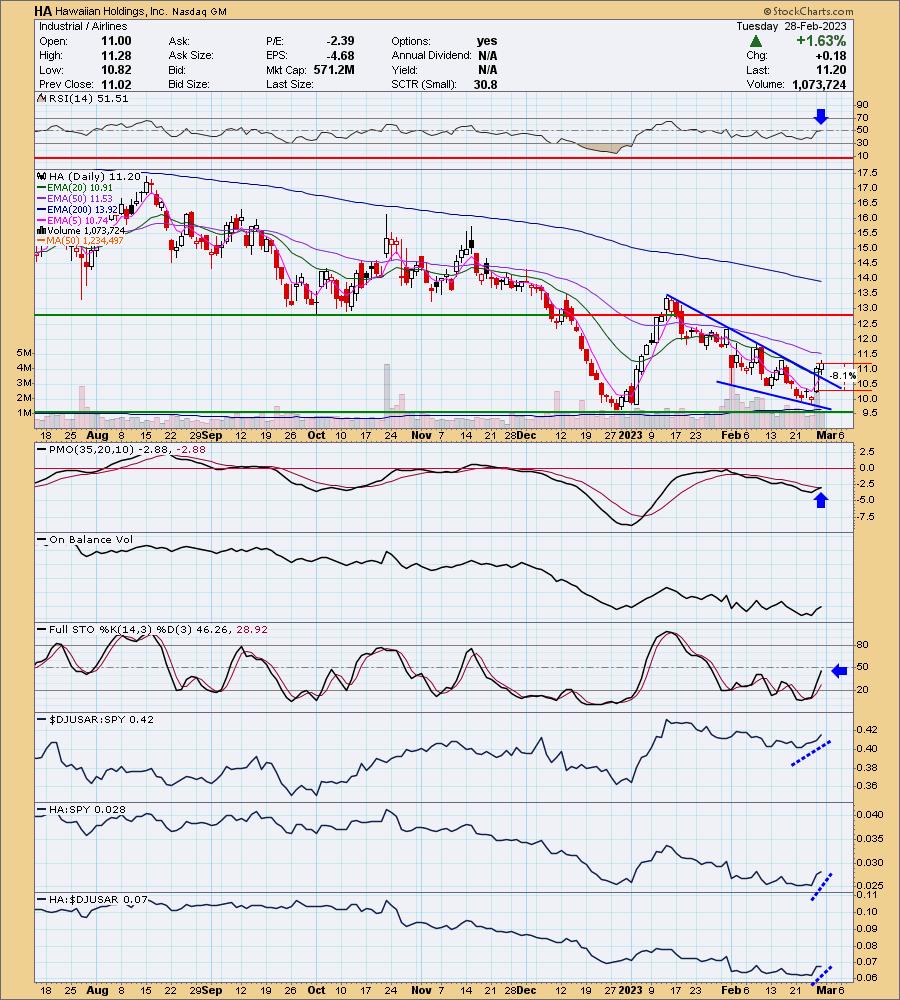
HA is down -1.25% in after hours trading so a better entry should be available to you tomorrow. It's been two days of sharp upside movement. Price has confirmed a bullish falling wedge pattern. The RSI just moved into positive territory above net neutral (50) and the PMO triggered a crossover BUY signal. Stochastics are rising nicely and should hit positive territory soon. Notice that relative strength is improving for the group and HA showed leadership the past two days against the group and SPY. The stop is set relatively deep, but as noted earlier, if you get a better entry, it won't be as deep at 8.1% or $10.29.
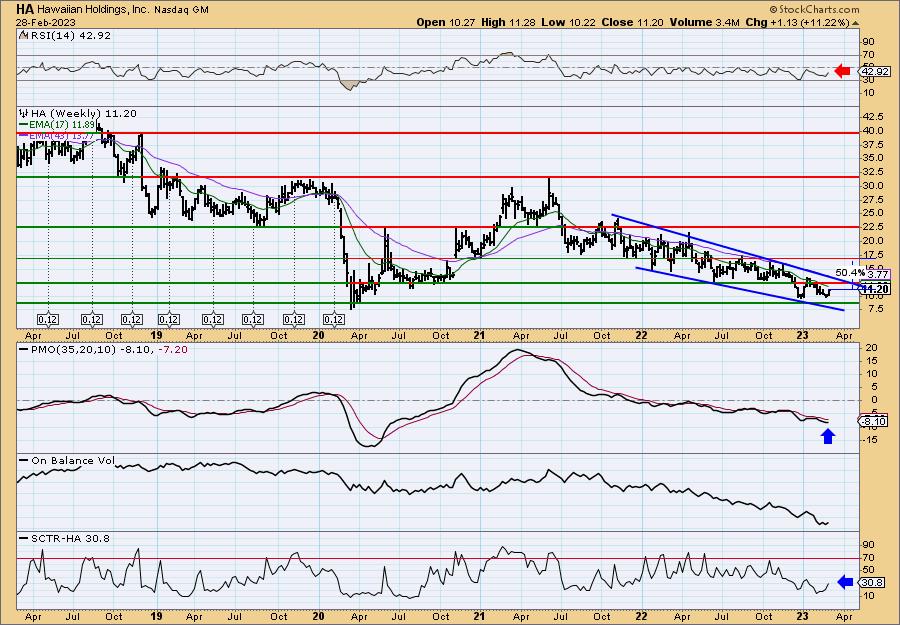
There is also a large bullish falling wedge developing on the weekly chart. It won't be confirmed until we get an upside breakout. I thought that the weekly chart would look terrible after reviewing the daily chart, but I was pleasantly surprised that the PMO had turned up. The weekly RSI is negative, but at least rising. The SCTR isn't in the "hot zone"* above 70, but it is showing marked improvement. Upside potential I believe is over 50%.
*We call it the "hot zone" because it implies that the stock/ETF is in the top 30% of its "universe" (large-, mid-, small-caps and ETFs) as far as trend and condition, particularly in the intermediate and long terms.
Owl Rock Capital Corp. (ORCC)
EARNINGS: 05/03/2023 (AMC)
Owl Rock Capital Corp non traded business development company seeks investment opportunities in middle market companies located in the United States with an EBITDA of USD 10 - 250 million and annual revenue of USD 50 million - 2.5 billion. The fund focuses on broad range of sectors including business services, healthcare services, pharma & healthcare technology, aerospace & defense, software & technology and manufacturing & industrials. it provides financing in the form of senior secured or unsecured loans, subordinated loans or mezzanine loans and a lesser extent, equity-related securities and warrants for growth, acquisitions, market or product expansion, re-financings and recapitalizations. Its investment size ranging from $20 to $250 million and it also acts as a lead investor.
Predefined Scans Triggered: P&F Double Top Breakout and P&F Triple Top Breakout.
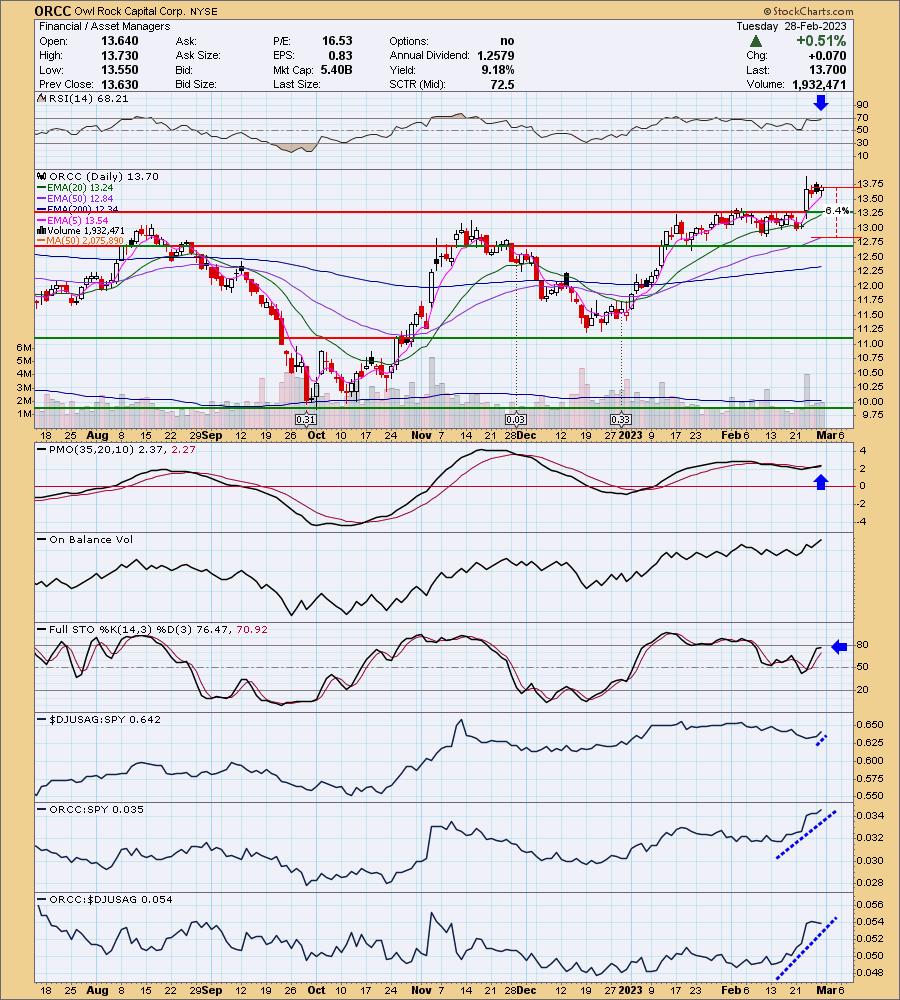
ORCC is up +0.15% in after hours trading. I saw that this was a "Diamond in the Rough" on January 3rd this year. It is up over +14% since. Price has broken out of a trading zone and is now consolidating the move. Given the positive indicators, I'm looking for another strong move higher. The RSI is positive and not overbought. The PMO is on a crossover BUY signal that is relatively new. Stochastics are rising in positive territory (although this price pause has flattened them). Relative strength for the group has been trending lower, but it appears this week that is changing. The stock itself has excellent relative strength against the group and the SPY. The stop is set below the 50-day EMA at 6.4% around $12.82.
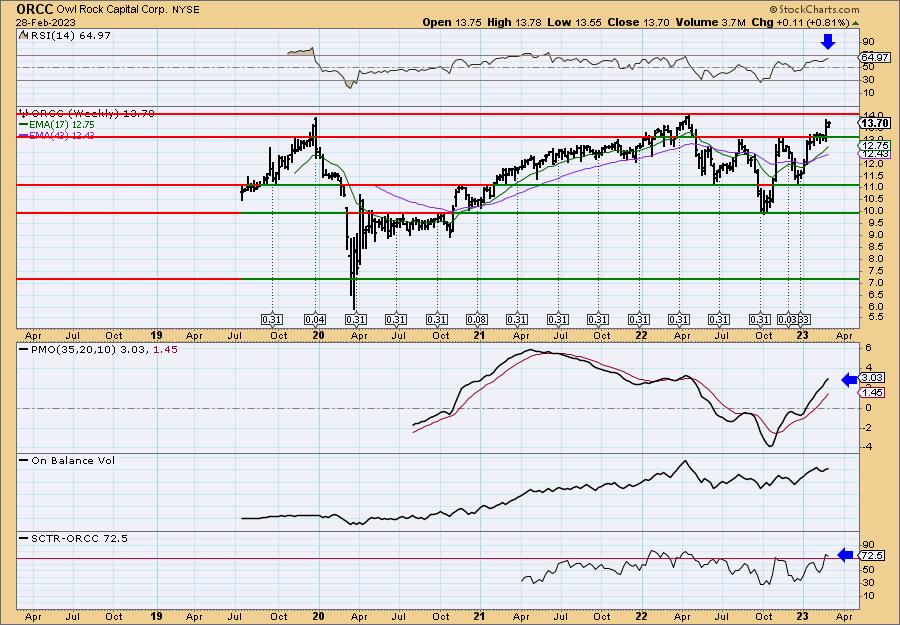
The weekly chart shows a giant reverse head and shoulders. Based on the pattern, the minimum upside target would be $16.00. That would mean a gain of 17%. The weekly RSI is positive and not overbought and the weekly PMO is rising strongly and is also not overbought. The SCTR just hit the "hot zone" which is why I chose this stock and not GBDC.
Clear Secure Inc. (YOU)
EARNINGS: 03/01/2023 (BMO)
Clear Secure, Inc. provides a technology platform, which enables frictionless and safe journeys using biometric identity. Its identity platform connects passengers to the cards in their wallet transforming the way passengers live, work, and travel, and also focuses on providing verification in several areas, such as events, healthcare, and sporting stadiums. The firm offers secured biometric identity verification to its customers from different industries through its CLEAR brand. The company was founded by Caryn Seidman-Becker and Kenneth Cornick in 2010 and is headquartered in New York, NY.
Predefined Scans Triggered: None.
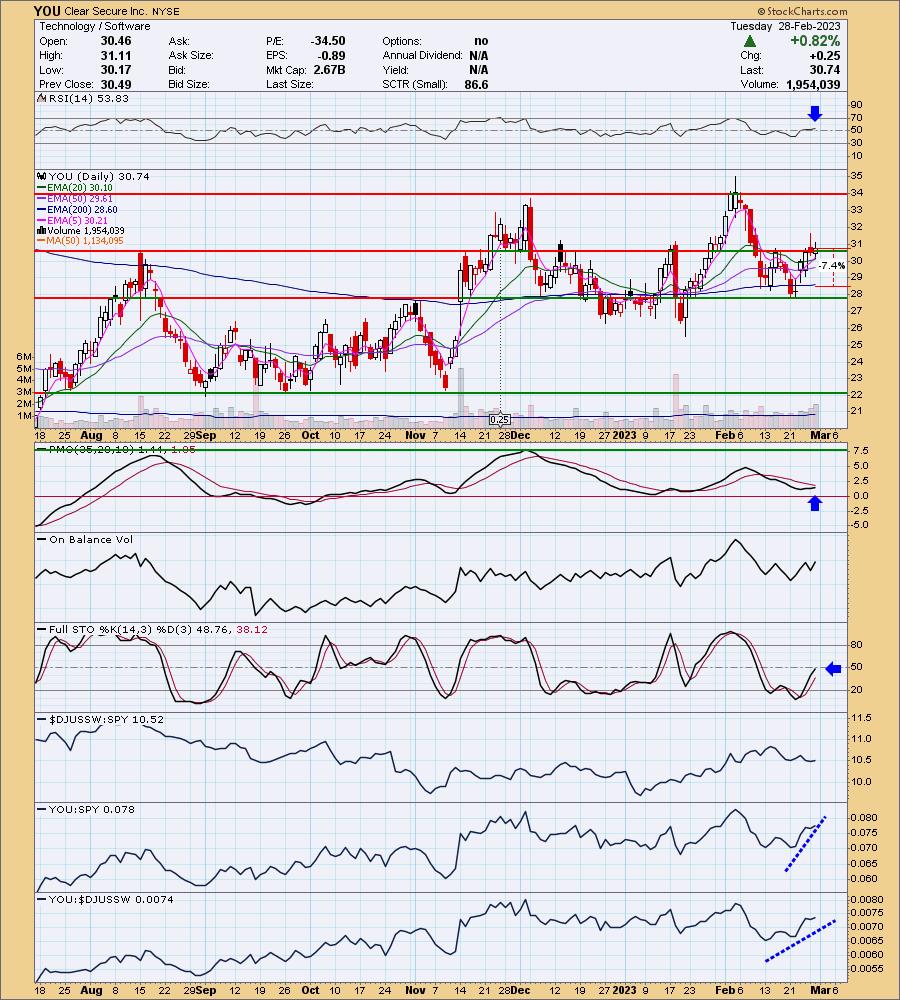
YOU is up +0.55% in after hours trading. We have a bullish double-bottom pattern in the short term. The minimum upside target of the pattern is near overhead resistance at the December top. The RSI is positive, rising and far from overbought. The PMO has now turned up and is headed for a crossover BUY signal. Stochastics have just about reached positive territory above 50. Relative strength studies show that Software is still not showing much strength, but this stock is easily outperforming the group and the SPY. The stop is set below the 200-day EMA at 7.4% or $28.46.
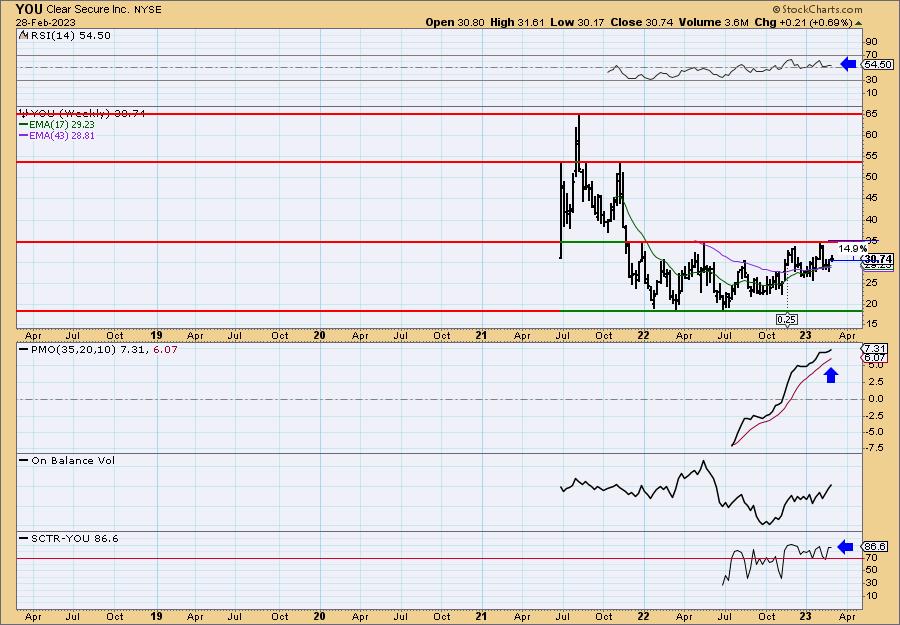
Strong overhead resistance is nearing at the top of the 2022 trading range. A move to that level is about a 15% gain which is twice our stop percentage. The weekly RSI is positive and the weekly PMO has bottomed above the signal line. The SCTR is a strong 86.6% suggesting it is in the top 15% of stocks as far as trend and condition.
Don't forget, on Thursdays I look at reader-requested symbols, click HERE to send me an email. I read every email I receive and try to answer them all!
Current Market Outlook:
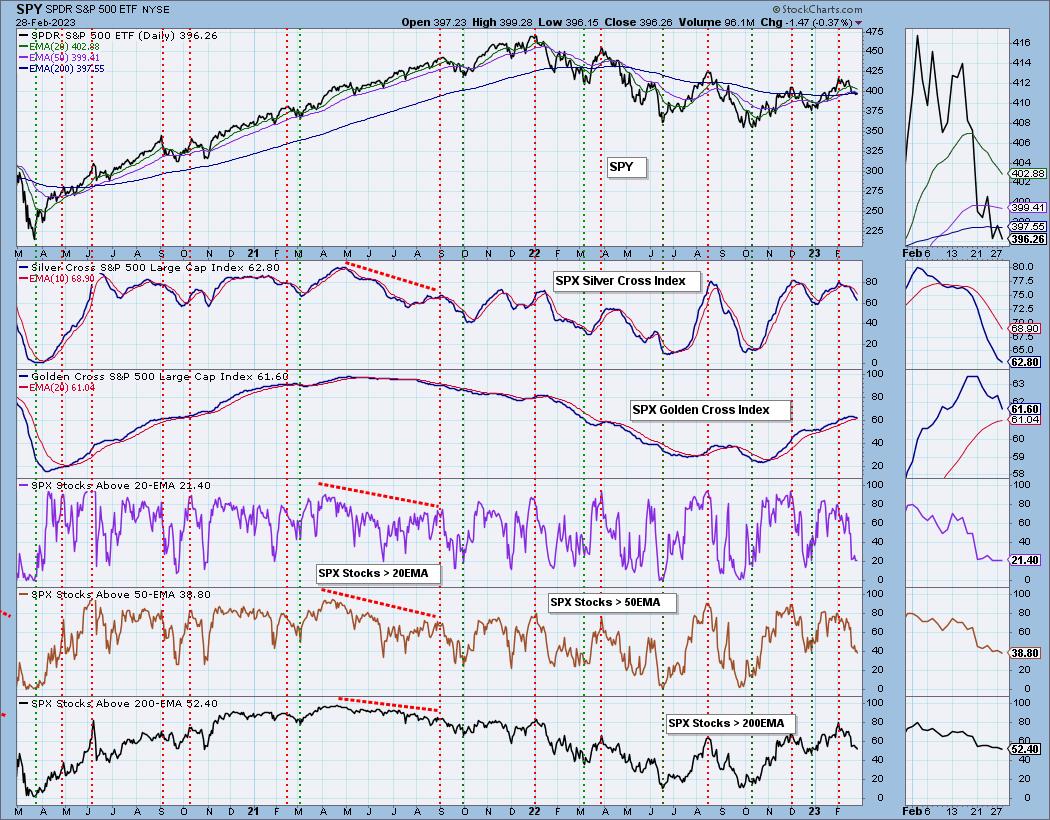
Market Environment: It is important to consider the odds for success by assessing the market tides. The following chart uses different methodologies for objectively showing the depth and trend of participation for intermediate- and long-term time frames.
- The Silver Cross Index (SCI) shows the percentage of SPX stocks on IT Trend Model BUY signals (20-EMA > 50-EMA)
- The Golden Cross Index (GCI) shows the percentage of SPX stocks on LT Trend Model BUY signals (50-EMA > 200-EMA)
Don't forget that as a "Diamonds" member, you have access to our GCI/SCI curated ChartList on DecisionPoint.com. You'll find it under "Members Only" links on the left side on the Blogs and Links Page.
Here is the current chart:
Full Disclosure: I am 22% exposed. Not interested in expanding, but I may swap in HA with a small position.
I'm required to disclose if I currently own a stock I mention and/or may buy/short it within the next 72 hours.
"Technical Analysis is a windsock, not a crystal ball." - Carl Swenlin
(c) Copyright 2023 DecisionPoint.com
Watch the latest episode of DecisionPoint Trading Room with Carl & Erin Swenlin on Mondays 7:00p EST or on the DecisionPoint playlist on the StockCharts TV YouTube channel here!
NOTE: The stocks reported herein are from mechanical trading model scans that are based upon moving average relationships, momentum and volume. DecisionPoint analysis is then applied to get five selections from the scans. The selections given should prompt readers to do a chart review using their own analysis process. This letter is not a call for a specific action to buy, sell or short any of the stocks provided. There are NO sure things or guaranteed returns on the daily selection of "Diamonds in the Rough."
Regarding BUY/SELL Signals: The signal status reported herein is based upon mechanical trading model signals and crossovers. They define the implied bias of the price index/stock based upon moving average relationships and momentum, but they do not necessarily call for a specific action. They are information flags that should prompt chart review. Further, they do not call for continuous buying or selling during the life of the signal. For example, a BUY signal will probably (but not necessarily) return the best results if action is taken soon after the signal is generated. Additional opportunities for buying may be found as price zigzags higher, but the trader must look for optimum entry points. Conversely, exit points to preserve gains (or minimize losses) may be evident before the model mechanically closes the signal.
Helpful DecisionPoint Links:
DecisionPoint Shared ChartList and DecisionPoint Chart Gallery
Price Momentum Oscillator (PMO)
Swenlin Trading Oscillators (STO-B and STO-V)
For more links, go to DecisionPoint.com