
It is always interesting to see what is on the minds of our subscribers. Today subscribers have Energy on the brain. One subscriber wrote and asked if shorting Energy and a few candidates was wise. Personally I think it is too early to short that sector, but some of the candidates he proposed for shorting did look interesting as shorts: XLE, OIH, AMLP, COP and CVX.
Another subscriber sent in a list of all high yielding Energy stocks and was bullish. I tend to agree more with this position, but as a bear, I do understand the want to get in early on shorting.
Mailbag:
How do ideas work at your trading forum? I don't know what to expect. Are these ideas for day or week trading?
I get this question frequently. I need to update our products page to better describe what you get and how to use it. I hope that you all got an initial welcome letter that does give you some of these details.
Answer:
I pick ten stocks per week with Wednesday being ETF Day and Thursday being selections from reader requests. When I present stock ideas, I am mainly trying to train your brain to look for the characteristics that make a good chart using my analysis techniques.
The ideas are short-term unless otherwise stated in the discussion about the weekly chart. If a chart has a good weekly chart, I generally consider it a possible intermediate-term trade. Ah, which brings us to the next question...
What do you consider "short-term", "intermediate-term" and "long-term" trades?
Answer: I consider the short term to mean days to a week, maybe two. I think of the intermediate term as weeks to a month or two. The long term is months to a year or more.
Hopefully that was helpful! Keep your questions coming and I'll address them on Thursdays or in the Monday free trading room or subscriber-only Diamond Mine trading room on Fridays.
Speaking of which, don't forget to sign up to be there live in tomorrow's Diamond Mine trading room!
Good Luck & Good Trading,
Erin
Today's "Diamonds in the Rough": BMY, CERE, DINO and PBR.
Other Requests: SDOW, DOG, SQQQ, OIH (short), AMLP (short), COP (short), CVX (short), MVO, SBR, LPG, DMLP, PEN, PARR, GLNCY, CIVI and SCPL.

RECORDING LINK (1/13/2023):
Topic: DecisionPoint Diamond Mine (1/13/2023) LIVE Trading Room
Passcode: January#13
REGISTRATION for 1/20/2022:
When: Jan 20, 2023 09:00 AM Pacific Time (US and Canada)
Topic: DecisionPoint Diamond Mine (1/20/2023) LIVE Trading Room
Register in advance for this webinar HERE
After registering, you will receive a confirmation email containing information about joining the webinar.

Here is the last recording (No show 1/16):
Welcome to DecisionPoint Diamonds, wherein I highlight ten "Diamonds in the Rough" per week. These are selected from the results of my DecisionPoint Scans which search for stocks that could benefit from the trend and condition of the market. Remember, these are not recommendations to buy or sell, but are the most interesting of the stocks that surfaced in my scans. My objective is to save you the work of the initial, tedious culling process, but you need to apply your own analysis to see if these stocks pique your interest as well. There are no guaranteed winners here!
"Predefined Scans Triggered" are taken from StockCharts.com using the "Symbol Summary" option instead of a "SharpChart" on the workbench.
Stop levels are all rounded down.
Bristol Myers Squibb Co. (BMY)
EARNINGS: 02/02/2023 (BMO)
Bristol Myers Squibb Co. engages in the discovery, development, licensing, manufacture, marketing, distribution, and sale of biopharmaceutical products. It offers chemically-synthesized drugs or small molecules and products produced from biological processes called biologics. The company was founded in August 1933 and is headquartered in New York, NY.
Predefined Scans Triggered: Elder Bar Turned Green, New CCI Buy Signals, Moved Above Upper Bollinger Band, Moved Above Upper Price Channel and P&F Double Bottom Breakout.
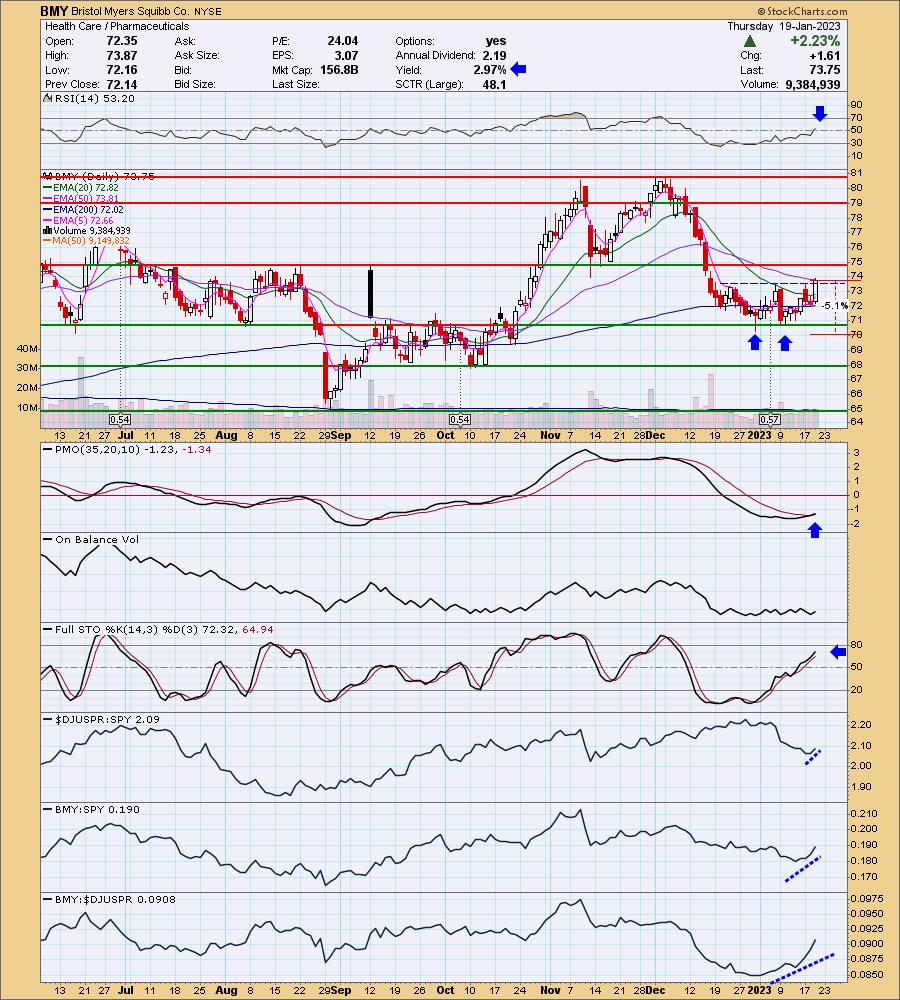
BMY is up +0.53% in after hours trading. Price has formed a double-bottom formation and rounded bottom which was confirmed with today's breakout above the confirmation line (drawn across the middle of the 'W'). The RSI just moved into positive territory above net neutral (50). The Price Momentum Oscillator (PMO) just had a crossover BUY signal. Stochastics aren't above 80 yet, but they are headed there. Relative strength for Pharma has been terrible and that is the one thing that might prevent me from taking the plunge here. On its own, it is showing excellent strength against the group and consequently against the SPY. The stop is set at 5.1% around 69.98.
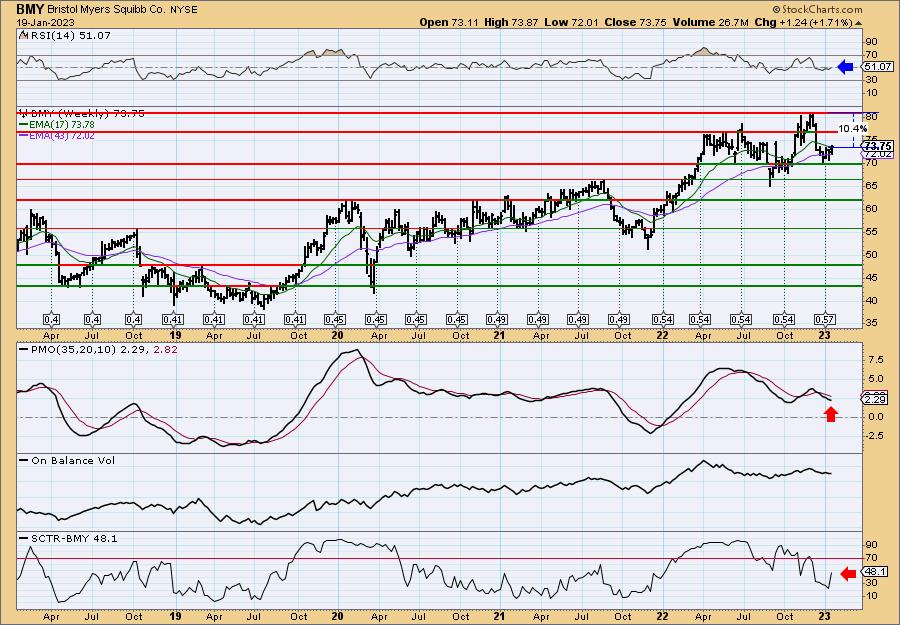
The weekly chart shows price bouncing off support. The weekly RSI is positive. However, that's it for bullish indicators. The weekly PMO is in decline and the SCTR is beneath the "hot zone" above 70. If it is in the "hot zone" it means that it is in the top 30% among its brethren (large-, small-, mid-caps and ETFs) based on trend and condition primarily in the intermediate and long terms. This chart says BMY is a short-term buy. Since it is near all-time highs, consider an upside target of about 15% or 84.81.
Cerevel Therapeutics Holdings, Inc. (CERE)
EARNINGS: 03/01/2023 (BMO)
Cerevel Therapeutics Holdings, Inc. engages in the discovery and development of new therapies for neuroscience diseases. The firm's portfolio focuses on diseases such as schizophrenia, epilepsy, and Parkinson's disease. Its product candidates include CVL-231, Darigabat, Tavapadon, CVL-871, and CVL-936. The company was founded in 2018 and is headquartered in Cambridge, MA.
Predefined Scans Triggered: None.
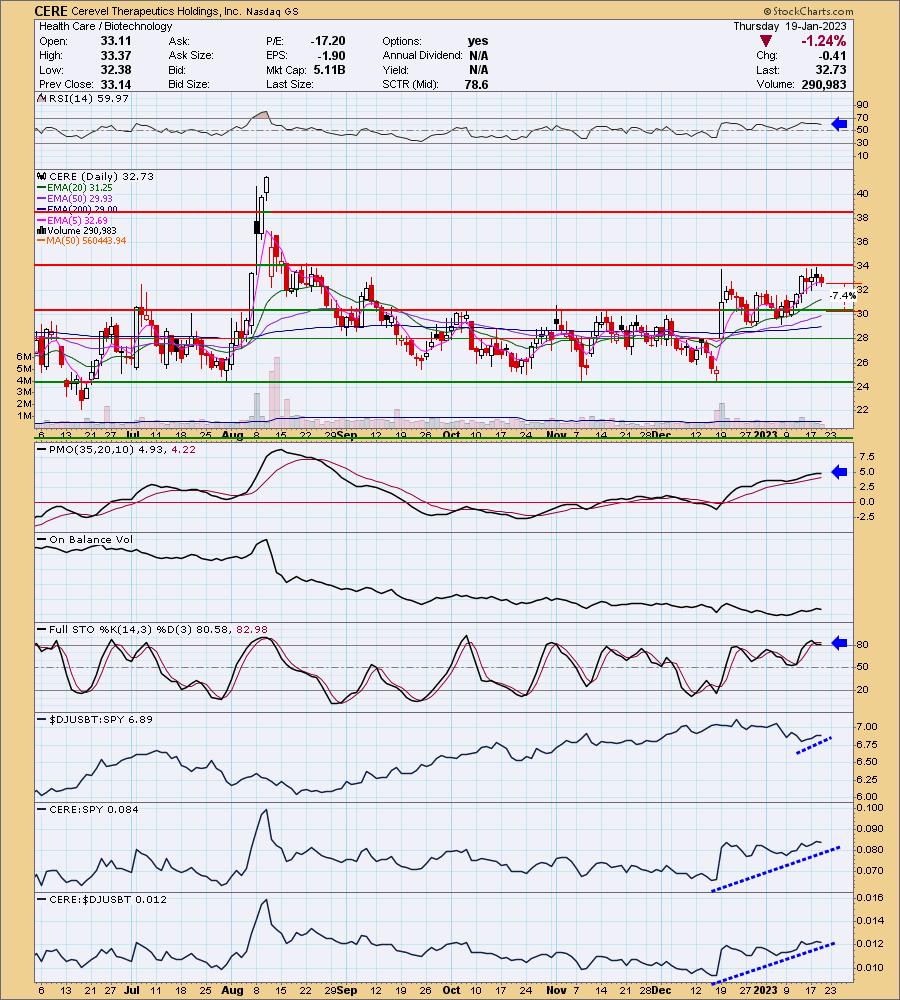
CERE is down -1.99% in after hours trading which leaves me less excited about it. Yet, after hours trading doesn't always result in the same direction on the open. Still the chart is so-so, not bad, just not great. The PMO is still technically rising but it is looking shaky. Another decline and it will turn down. We still have a rising price trend and the EMAs are configured bullishly with the fastest EMA on the top and moving lower to the slowest EMA. The RSI is positive and Stochastics are turning up above 80. The OBV does show a negative divergence (declining OBV tops, rising price tops) so a breakout here may be tough. It seems that having now reached and failed at overhead resistance, it may need a few more days to pull back before rising again. Relative strength studies are quite good. The group is beginning to outperform again and CERE is a leader in the group and consequently is beating the SPY. The stop is set at 7.4% just below support around 30.30.
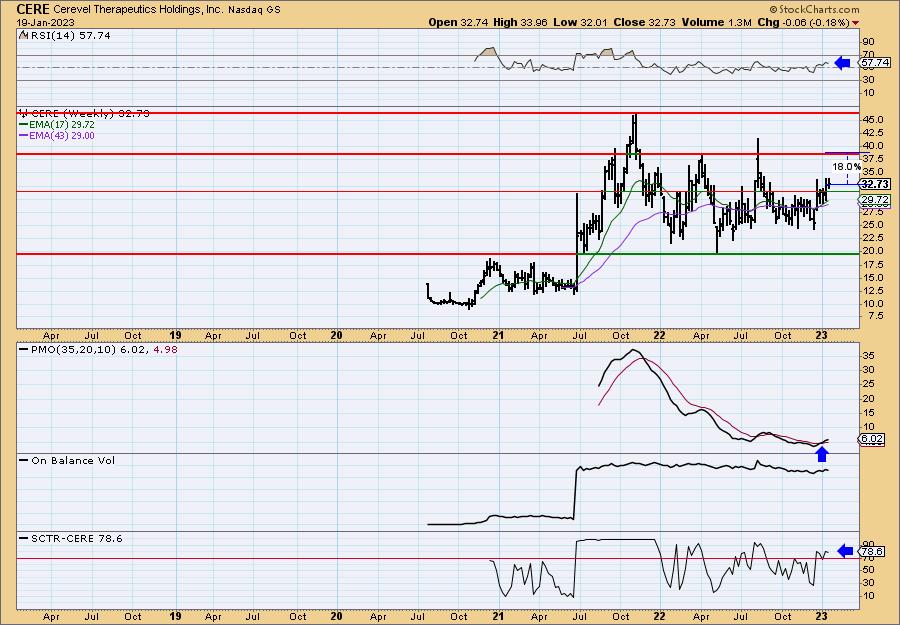
I really like the weekly chart. It is in a price range which I'm not generally thrilled with, but there is a strong rising trend that does suggest it will at least test overhead resistance for an 18% gain. The weekly RSI is positive and the weekly PMO is rising on an oversold BUY signal above the zero line. The SCTR is good at 78.6.
HF Sinclair Corporation (DINO)
EARNINGS: 02/24/2023 (BMO)
HF Sinclair Corp. is an independent energy company. It manufactures and sells products such as gasoline, diesel fuel, jet fuel, renewable diesel, specialty lubricant products, specialty chemicals, and specialty and modified asphalt. The company operates through five segments: Refining, Marketing, Renewables, Lubricants and Specialty Products, and Midstream. The company was founded on March 14, 2022 and is headquartered in Dallas, TX.
Predefined Scans Triggered: Moved Above Upper Price Channel, P&F Ascending Triple Top Breakout and Ichimoku Cloud Turned Red.
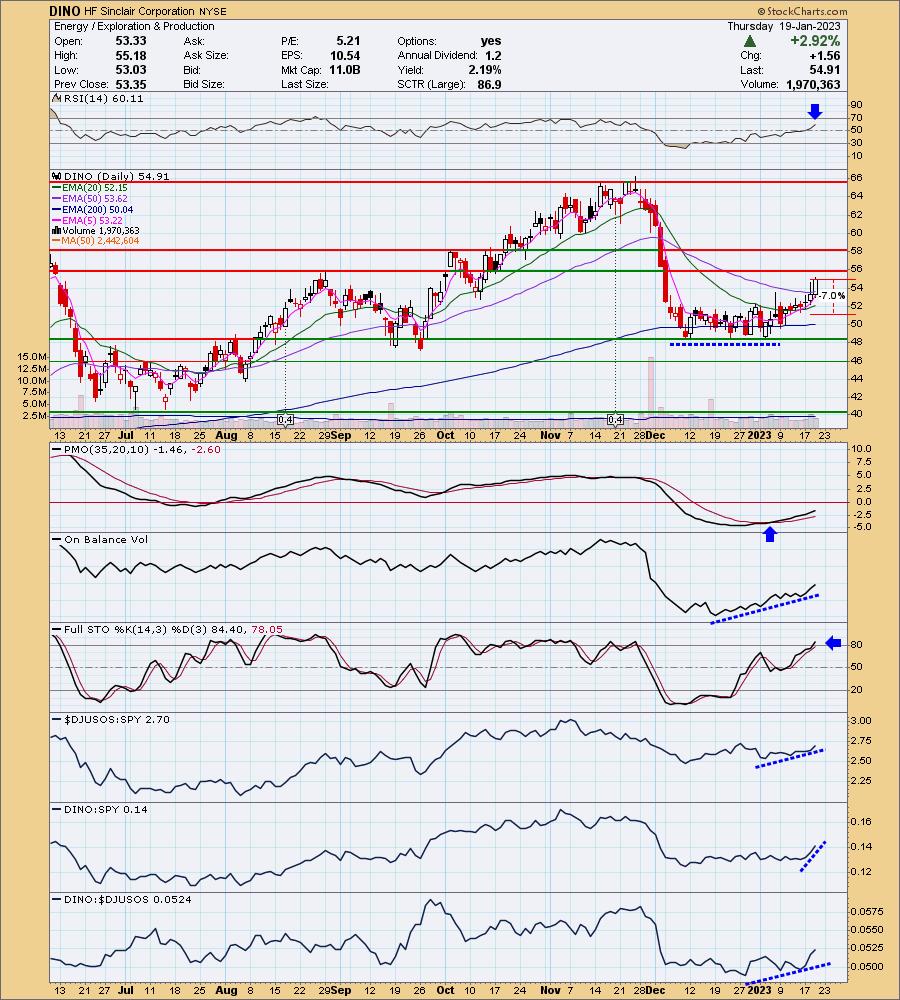
DINO is down -0.29% in after hours trading. I love this symbol given their branding is a dinosaur and I used to watch Mr. Flintstone often in my youth. This rally may be trying to go parabolic and it is about to reach overhead resistance. Other than that, indicators are healthy. The RSI is positive and rising. The PMO is rising on an oversold BUY signal. The OBV had a positive divergence (rising OBV bottoms, flat/declining price bottoms) going into this rally. Stochastics are rising above 80 and relative strength is pretty good for the group now, particularly for DINO against the group and SPY. The stop is set at 7% around 51.06.
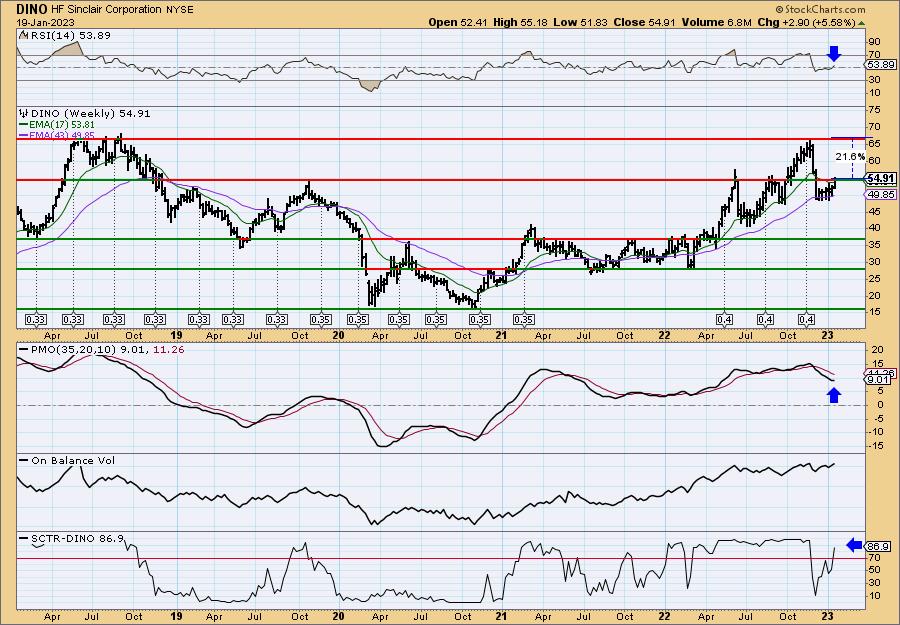
We are about to see DINO break above strong long-term overhead resistance. The weekly RSI moved back into positive territory and the weekly PMO is turning back up. The SCTR is strong at 86.9%.
Petroleo Brasileiro (Petrobras) (PBR)
EARNINGS: 03/01/2023 (AMC)
Petróleo Brasileiro SA engages in oil and gas exploration, production, and distribution activities. It operates through the following segments: Exploration and Production; Refining, Transportation, and Marketing; Gas and Power; and Corporate and Other Business. The Exploration and Production segment involves crude oil, natural gas liquids, and natural gas exploration, development, and production. The Refining, Transportation and Marketing segment involves refining, logistics, transportation, trading operations, oil products and crude oil exports and imports, and petrochemical investments. The Gas and Power segment includes transportation and trading of natural and liquefied natural gas, the generation and trading of electric power, and the fertilizer business. The Corporate and Other Business segment comprises the financing activities not attributable to other segments including corporate financial management, and central administrative overhead and actuarial expenses. The company was founded on October 3, 1953 and is headquartered in Rio de Janeiro, Brazil.
Predefined Scans Triggered: Elder Bar Turned Green, Entered Ichimoku Cloud and P&F Double Top Breakout.
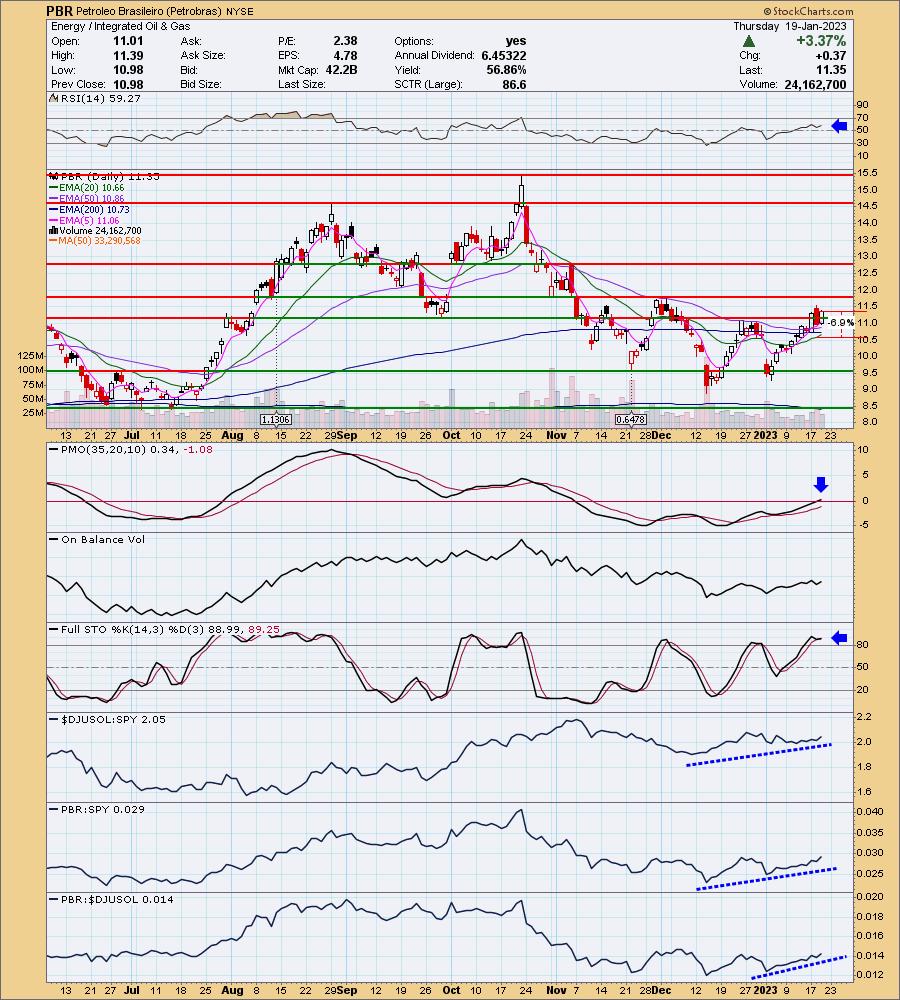
PBR is up +0.35% in after hours trading. There is something off about that yield. You'll notice under price that it lists the last two distributions as 1.1306 and 0.6478. I'm sure it has a good yield, but the percentage is off. Price has formed a double/triple-bottom and is attempting to confirm the pattern with a breakout. The RSI is positive and the PMO just moved above the zero line. Stochastics are rising and are above 80. Relative strength has been alright for the group, but it does appear to be picking up. The stop is set below the 20/200-day EMAs at 6.9% or around 10.56.
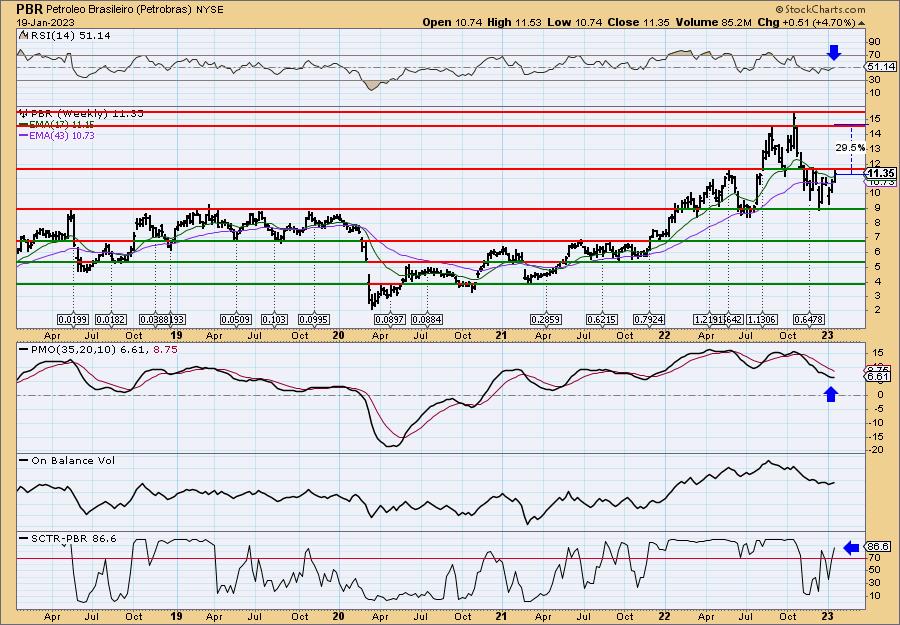
The weekly chart is just getting good. The RSI just moved into positive territory and the PMO is turning up. The SCTR is already healthy at 86.6%. I like the bounce off strong long-term support. The only issue now is getting above overhead resistance. Given the positive charts, I think it will. This one under non-bear market conditions would be an intermediate-term buy.
Don't forget, on Thursdays I look at reader-requested symbols, click HERE to send me an email. I read every email I receive and try to answer them all!
Current Market Outlook:
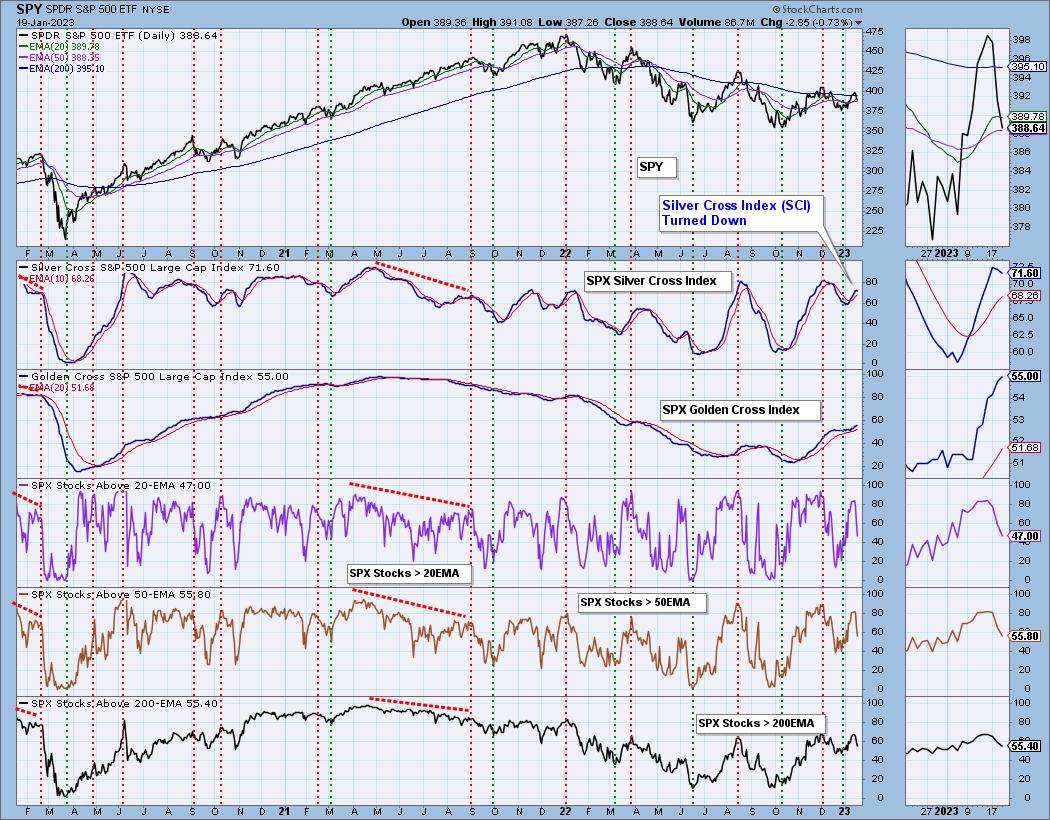
Market Environment: It is important to consider the odds for success by assessing the market tides. The following chart uses different methodologies for objectively showing the depth and trend of participation for intermediate- and long-term time frames.
- The Silver Cross Index (SCI) shows the percentage of SPX stocks on IT Trend Model BUY signals (20-EMA > 50-EMA)
- The Golden Cross Index (GCI) shows the percentage of SPX stocks on LT Trend Model BUY signals (50-EMA > 200-EMA)
Don't forget that as a "Diamonds" member, you have access to our GCI/SCI curated ChartList on DecisionPoint.com. You'll find it under "Members Only" links on the left side on the Blogs and Links Page.
Here is the current chart:
Full Disclosure: I am 15% exposed.
I'm required to disclose if I currently own a stock I mention and/or may buy/short it within the next 72 hours.
"Technical Analysis is a windsock, not a crystal ball." - Carl Swenlin
(c) Copyright 2023 DecisionPoint.com
Watch the latest episode of DecisionPoint Trading Room with Carl & Erin Swenlin on Mondays 7:00p EST or on the DecisionPoint playlist on the StockCharts TV YouTube channel here!
NOTE: The stocks reported herein are from mechanical trading model scans that are based upon moving average relationships, momentum and volume. DecisionPoint analysis is then applied to get five selections from the scans. The selections given should prompt readers to do a chart review using their own analysis process. This letter is not a call for a specific action to buy, sell or short any of the stocks provided. There are NO sure things or guaranteed returns on the daily selection of "Diamonds in the Rough."
Regarding BUY/SELL Signals: The signal status reported herein is based upon mechanical trading model signals and crossovers. They define the implied bias of the price index/stock based upon moving average relationships and momentum, but they do not necessarily call for a specific action. They are information flags that should prompt chart review. Further, they do not call for continuous buying or selling during the life of the signal. For example, a BUY signal will probably (but not necessarily) return the best results if action is taken soon after the signal is generated. Additional opportunities for buying may be found as price zigzags higher, but the trader must look for optimum entry points. Conversely, exit points to preserve gains (or minimize losses) may be evident before the model mechanically closes the signal.
Helpful DecisionPoint Links:
DecisionPoint Shared ChartList and DecisionPoint Chart Gallery
Price Momentum Oscillator (PMO)
Swenlin Trading Oscillators (STO-B and STO-V)
For more links, go to DecisionPoint.com