
The reader requests supplied by you really saw some interesting themes. However, before I get into that, I have two mailbag questions.
Question 1:
We are getting right up against some serious resistance. Not sure if it makes sense to go in heavy now at this point or go into something like energy or maybe materials that may be less susceptible to a SPY pull back?
The SPY is getting close to strong resistance and certainly could see a pause or pullback. You make a good point, we need to find stocks that take advantage of the pockets of strength that are peppered throughout the market. Energy (XLE) is turning around, particularly Crude related stocks. This group isn't as susceptible to the machinations of the SPY. Materials (XLB) are showing some strength right now, particularly Steel which will cover in today's report. I also like Gold right now as the Dollar is showing weakness. Still, I think Technology has more upside available in the short term.
Question 2:
How are the Russell 2000 (IWM) and Bonds (TLT) developing given the recent rallies?
It does appear that interest rates will be correcting again and that bodes well for all Bonds, not only TLT. I worry that TLT's rally may be waning. We cover Yields, particularly the 10-year Treasury ($TNX) in DP Alert, so you'll find more information there. IWM is looking very good and I expect to see it continue rising. The problem for IWM will be the SPX. When the rally starts to break apart on the SPY, IWM will likely be taken down with it. However, in the short term I like small-caps in general.
Question 3:
(Paraphrased from stock request): Is it time to go all in on Tesla with a 3x Bull ETF for TSLA?
I like TSLA right now, but not enough to go with a leveraged ETF on it. I'm seeing very mixed messages on TSLA with one newsletter writing that it was time to short TSLA big time and another stating it is time to buy this beatdown stock. I'm leaning bullish, but given the mixed signals, not enough to go in with a "juiced" ETF. I guess it is the ultimate form of flattery if you see an ETF built around your company's stock. It is part of QCLN ETF I presented yesterday (Full disclosure: I own it). I think that might be a better play.
That's it for today. I'll see you in tomorrow's Diamond Mine trading room. For those who've never attended or watched this 1 1/2 hour trading room, I go over the market in general for the week. We look for a sector and industry group to watch (also in the DP Diamonds Recap on Fridays) and mine for some stocks within strong groups. I go over the week's "Diamonds in the Rough" to assess how they did on the week and what their future prospects are. Then I cover symbol requests. It's great fun for me and the group is pretty active in the chat room if you come to watch live at Noon ET. The registration information is below the Diamonds logo. You'll also find the latest recording there.
Good Luck & Good Trading,
Erin
Today's "Diamonds in the Rough": CDEV, ENLC, ILPT and NUE.
Other Requests: WEBL, TECL, FTCH, TCOM, TSLL, MNKD, TSCO, PXD, HES, BHVN, ET, MAXN, SPG and X.
Important: Your current subscription rates will ALWAYS stay the same when we raise prices on January 15th. **
** You must keep your subscription running and in good standing.

RECORDING LINK (1/6/2023):
Topic: DecisionPoint Diamond Mine (1/6/2023) LIVE Trading Room
Start Time: Jan 6, 2023 09:00 AM PT
Passcode: January#6
REGISTRATION for 1/13/2022:
When: Jan 13, 2023 09:00 AM Pacific Time (US and Canada)
Topic: DecisionPoint Diamond Mine (1/13/2023) LIVE Trading Room
Register in advance for this webinar HERE
After registering, you will receive a confirmation email containing information about joining the webinar.

Here is the last recording:
Welcome to DecisionPoint Diamonds, wherein I highlight ten "Diamonds in the Rough" per week. These are selected from the results of my DecisionPoint Scans which search for stocks that could benefit from the trend and condition of the market. Remember, these are not recommendations to buy or sell, but are the most interesting of the stocks that surfaced in my scans. My objective is to save you the work of the initial, tedious culling process, but you need to apply your own analysis to see if these stocks pique your interest as well. There are no guaranteed winners here!
"Predefined Scans Triggered" are taken from StockCharts.com using the "Symbol Summary" option instead of a "SharpChart" on the workbench.
Stop levels are all rounded down.
Permian Resources Corp. (CDEV)
EARNINGS: None Listed.
Permian Resources Corp. operates as an oil and natural gas company. It focuses on the development of unconventional oil and liquids-rich natural gas reserves in the Permian Basin. The company was founded on October 6, 2014 and is headquartered in Denver, CO.
Predefined Scans Triggered: New CCI Buy Signals, Moved Above Upper Bollinger Band, P&F High Pole and Moved Above Upper Price Channel.
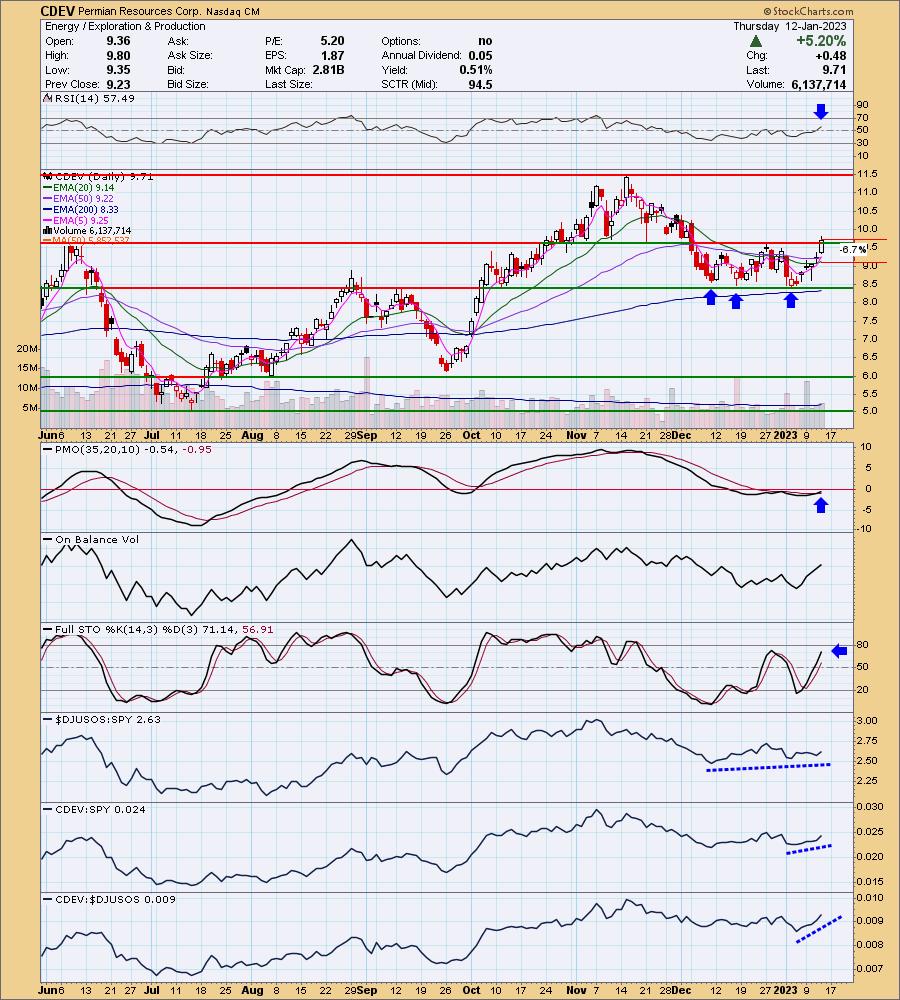
CDEV is unchanged in after hours trading. We have a triple bottom price breakout today. I couldn't resist it based on that; you rarely see actual triple bottom chart patterns. The rest of the chart is bullish as well. The RSI just moved positive and the PMO had a crossover BUY signal today. The OBV is popping on new volume. The group has held up well based on relative strength and CDEV is outperforming the group now and consequently the SPY. The stop is set below the 20-day EMA at 6.7% or $9.05.
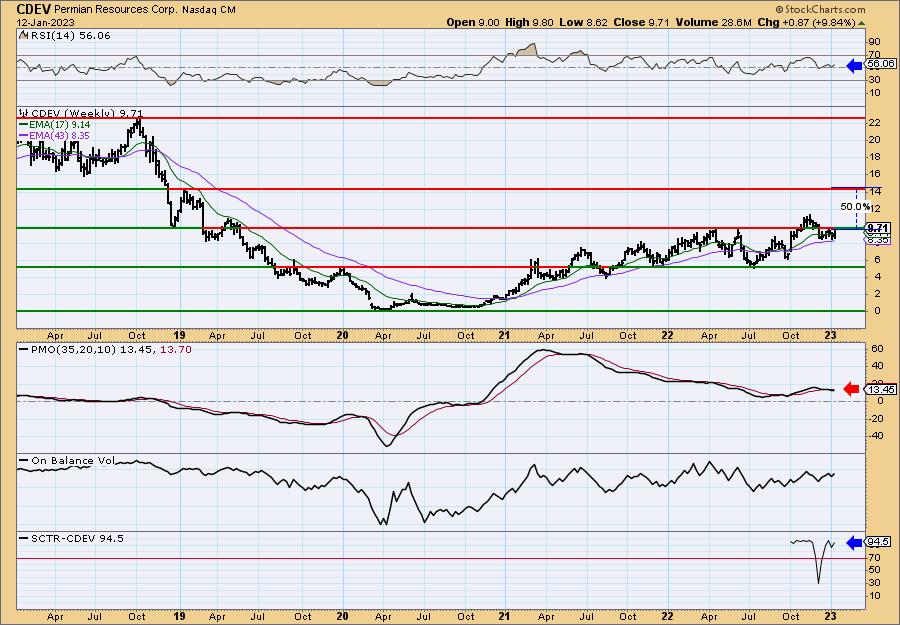
It is challenging long-term overhead resistance. The weekly RSI is positive, but the weekly PMO is declining on a SELL signal. The StockCharts Technical Rank (SCTR) makes up for the PMO given it is superior at 94.5%. It tells us it is in the top 6% of all mid-caps based on trend and condition primarily in the intermediate and long terms.
EnLink Midstream, LLC (ENLC)
EARNINGS: 02/14/2023 (AMC)
EnLink Midstream LLC engages in transmission, processing and marketing of natural gas and crude oil. It operates through the following segments: Permian, North Texas, Oklahoma, Louisiana, and Corporate. The Permian segment includes natural gas gathering, processing, and transmission activities and crude oil operations in the Midland and Delaware Basins in West Texas and Eastern New Mexico and crude operations in South Texas. The North Texas segment includes natural gas gathering, processing, and transmission activities in North Texas. The Oklahoma segment includes natural gas gathering, processing, and transmission activities, and crude oil operations in the Cana-Woodford, Arkoma-Woodford, northern Oklahoma Woodford, STACK, and CNOW shale areas. The Louisiana segment includes natural gas pipelines, natural gas processing plants, storage facilities, fractionation facilities, and NGL assets located in Louisiana and crude oil operations in ORV. The Corporate segment includes investments in the Cedar Cove JV in Oklahoma, ownership interest in GCF in South Texas, derivative activity, and general corporate assets and expenses. The company was founded in October 2013 and is headquartered in Dallas, TX.
Predefined Scans Triggered: Moved Above Upper Keltner Channel and New 52-week Highs.
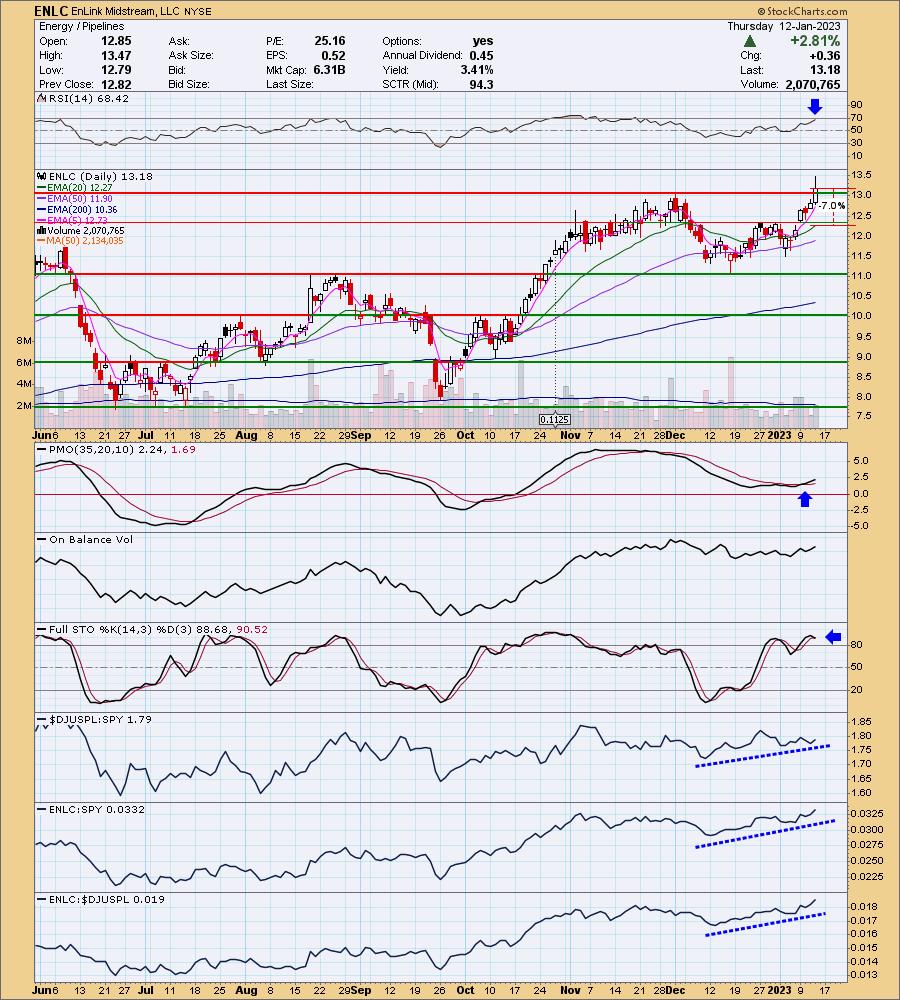
ENLC is up +0.23% in after hours trading. We'll file this one under "winners that keep on winning". ENLC broke overhead resistance today. The RSI is rising, positive and not yet overbought. The PMO is not overbought and is rising gently on a crossover BUY signal. Stochastics are above 80. Relative strength is excellent across the board. The stop is set beneath support at the late December top around 7% or $12.25.
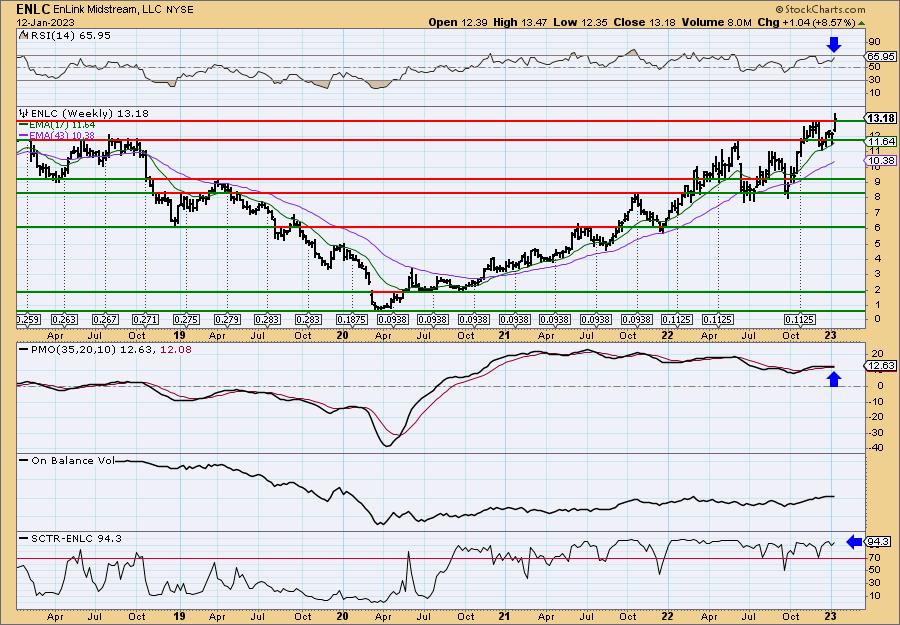
The weekly RSI is positive and not overbought. The weekly PMO is on a crossover BUY signal. I'd like to see it moving up with confidence; for now it is flat. The SCTR is excellent at 94.3%. Since it is trading at new 52-week highs, consider and upside target of 15% around $15.15.
Industrial Logistics Properties Trust (ILPT)
EARNINGS: 02/14/2023 (AMC)
Industrial Logistics Properties Trust is a real estate investment trust, which owns and leases industrial and logistics Properties. The company was founded on September 15, 2017 and is headquartered in Newton, MA.
Predefined Scans Triggered: None.
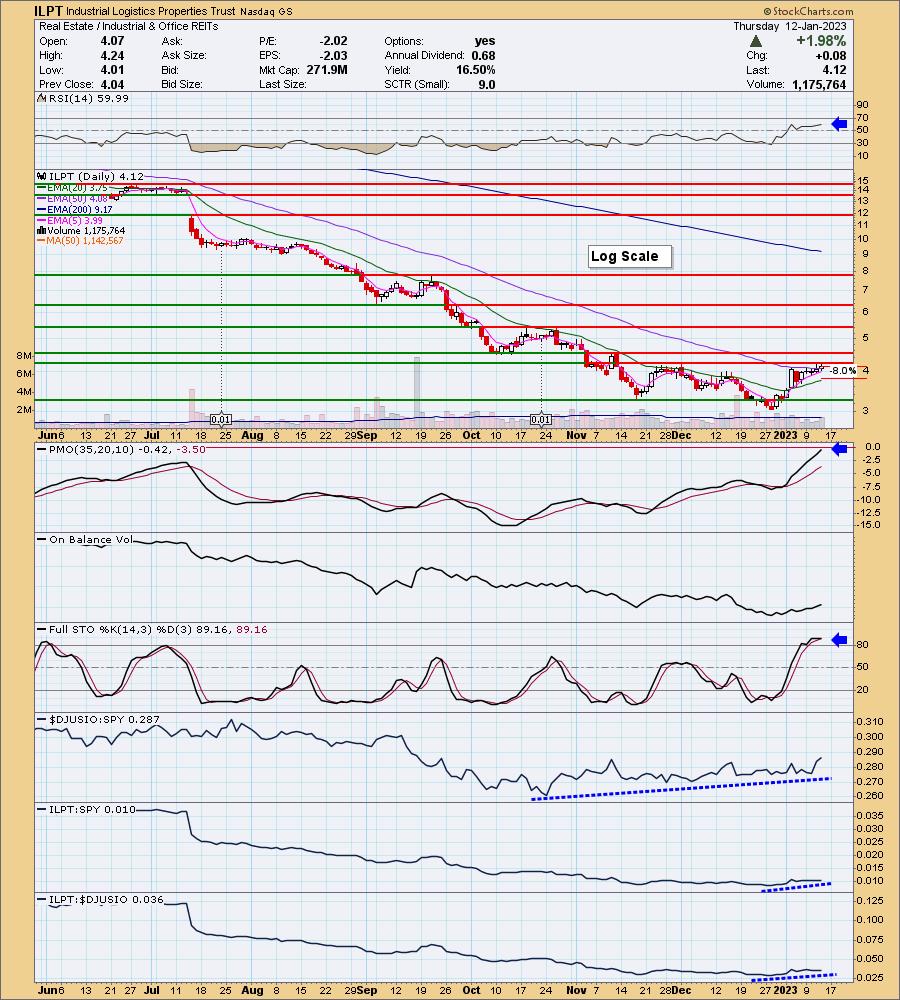
ILPT is up +1.70% in after hours trading. It hasn't quite overcome resistance, but it is above all three key moving averages. The PMO is rising strongly and should get into positive territory soon. The RSI is comfortably seated in positive territory. Stochastics are above 80 and rising again. Relative strength for the group has been excellent and we are starting to see ILPT slightly outperform the group and the SPY. The stop is set near the 20-day EMA at 8% or $3.79.
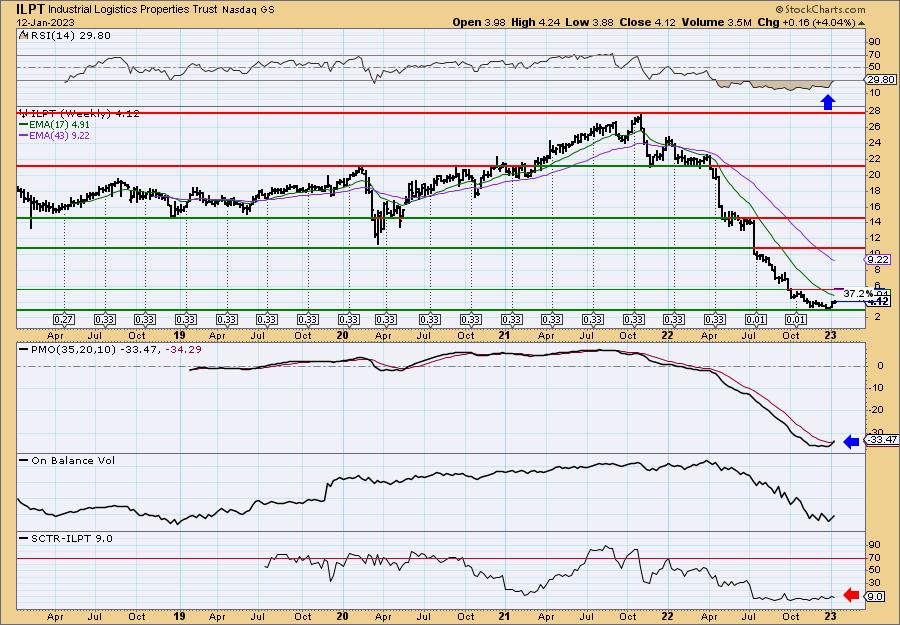
The weekly chart is looking very interesting. The weekly RSI and SCTR or less than impressive, in fact they are pretty awful. But, I will give the weekly RSI the benefit of the doubt as it is rising out of oversold territory. The weekly PMO looks fantastic! We should see a new weekly PMO crossover BUY signal printed tomorrow when the weekly charts go final. There's lots of upside potential. Not sure it will fulfill 37.2%, but in any case, I see upside.
Nucor Corp. (NUE)
EARNINGS: 01/26/2023 (BMO)
Nucor Corp. engages in the manufacturing of steel and steel products. It operates through the following segments: Steel Mills, Steel Products, and Raw Materials. The Steel Mills segment consists of carbon and alloy steel in sheet, bars, structural and plate, steel trading businesses, rebar distribution businesses, and Nucor's equity method investments. The Steel Products segment includes steel joists and joist girders, steel deck, fabricated concrete reinforcing steel, cold finished steel, steel fasteners, metal building systems, steel grating, tubular products businesses, piling products businesses, and wire and wire mesh. The Raw Materials segment consists of direct reduced iron, and ferrous and nonferrous metals. The company was founded by Ransom E. Olds in 1905 and is headquartered in Charlotte, NC.
Predefined Scans Triggered: P&F Double Top Breakout.
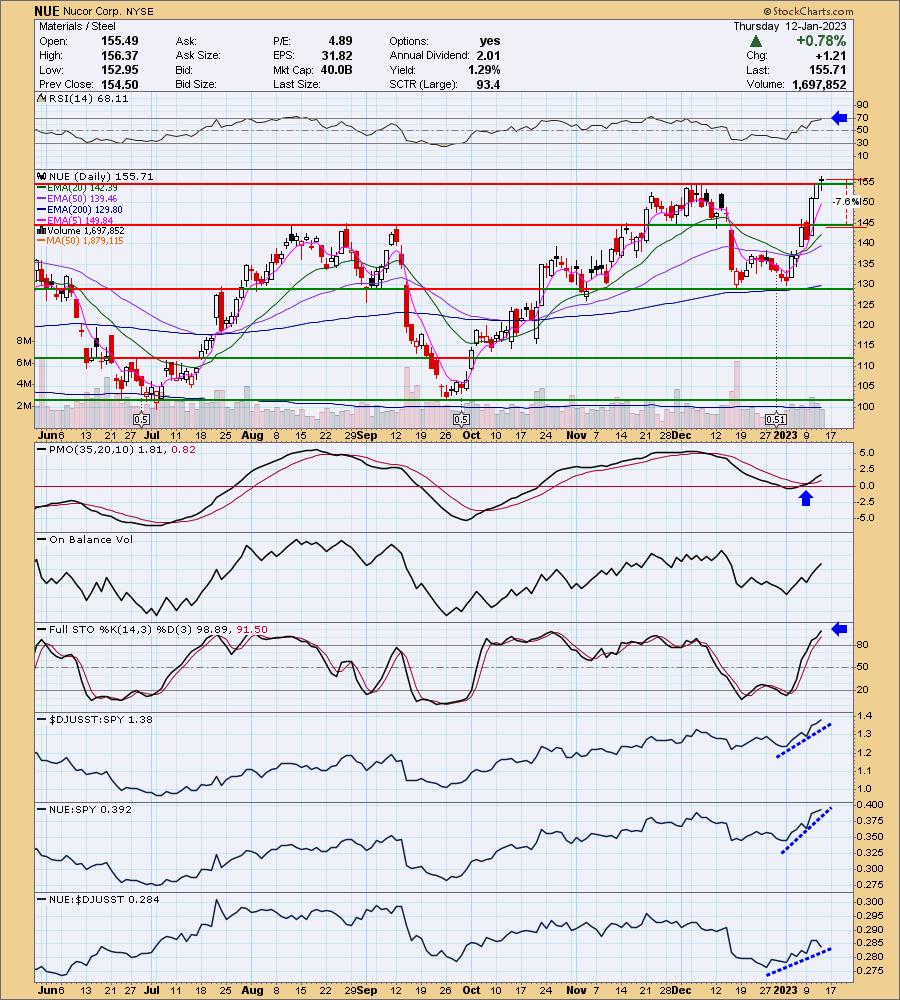
NUE is unchanged in after hours trading. US Steel (X) was requested, but I like Nucor better. Price broke out today. The RSI is positive and not yet overbought. The PMO is rising on a crossover BUY signal. Volume is coming in based on the rise of the OBV. Stochastics are above 80. If you compare relative strength of NUE to X, you'll note that NUE is outperforming the group, while X is not. The group is looking good and this one is an outperformer. The stop is set below support at 7.6% around $143.87.
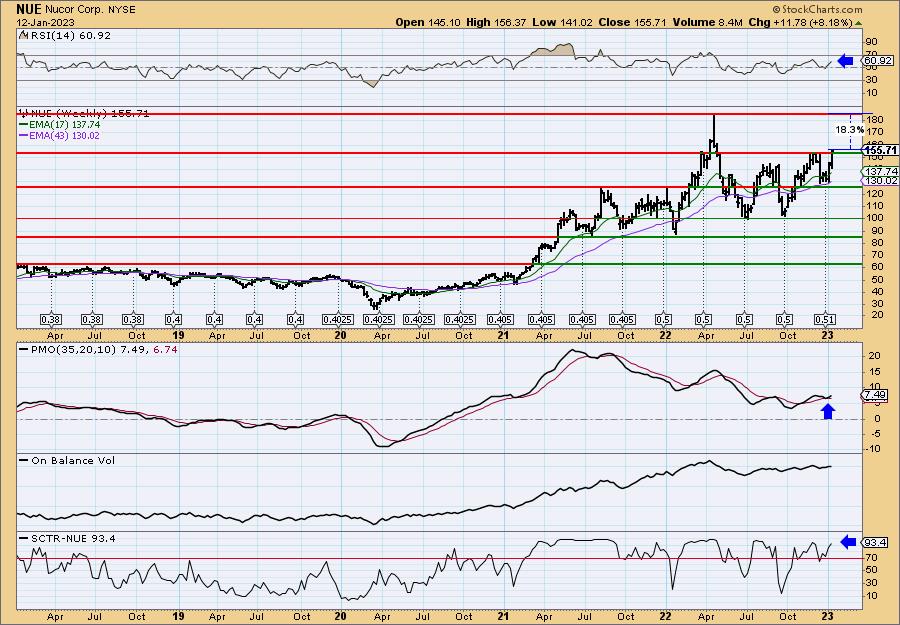
The weekly chart shows us how important the recent breakout is. The weekly RSI is positive and the weekly PMO has bottomed above its signal line which is especially bullish. The SCTR is excellent at 93.4%. This one looks good in the short- and intermediate-term timeframes.
Don't forget, on Thursdays I look at reader-requested symbols, click HERE to send me an email. I read every email I receive and try to answer them all!
Current Market Outlook:
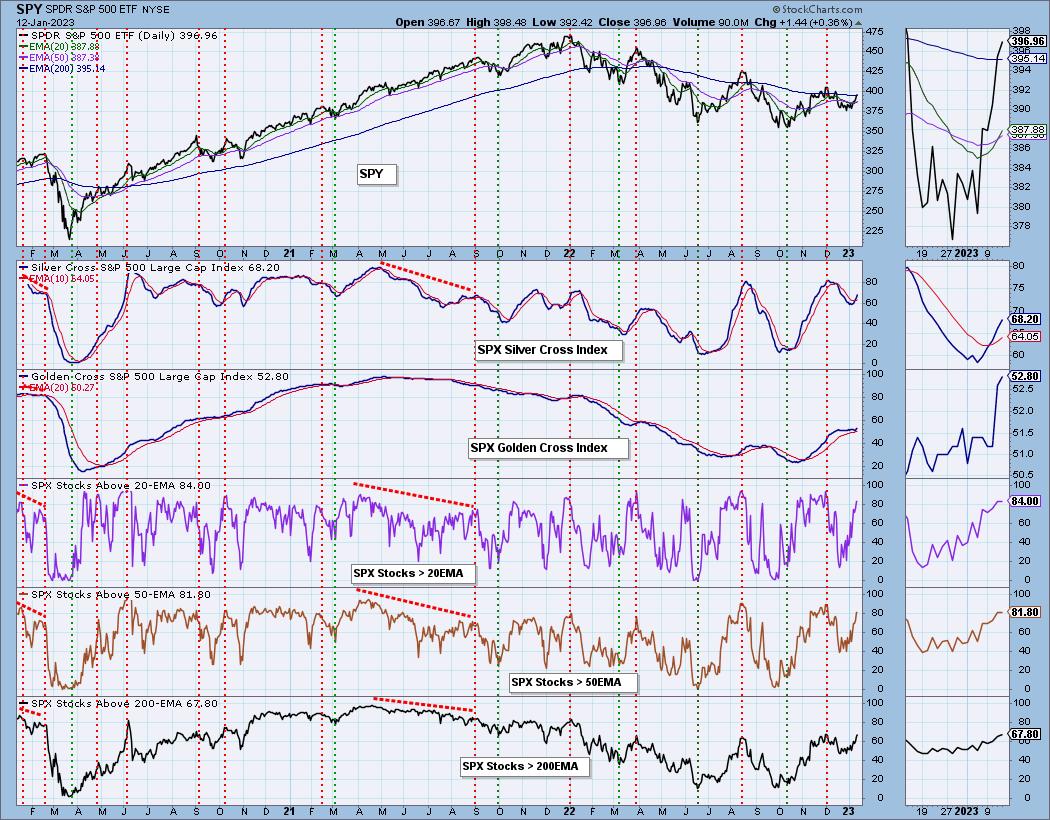
Market Environment: It is important to consider the odds for success by assessing the market tides. The following chart uses different methodologies for objectively showing the depth and trend of participation for intermediate- and long-term time frames.
- The Silver Cross Index (SCI) shows the percentage of SPX stocks on IT Trend Model BUY signals (20-EMA > 50-EMA)
- The Golden Cross Index (GCI) shows the percentage of SPX stocks on LT Trend Model BUY signals (50-EMA > 200-EMA)
Don't forget that as a "Diamonds" member, you have access to our GCI/SCI curated ChartList on DecisionPoint.com. You'll find it under "Members Only" links on the left side on the Blogs and Links Page.
Here is the current chart:
Full Disclosure: I am 20% exposed. I will be watching CDEV and ENLC as I don't have an Energy position currently. I'm also stalking CECO. I didn't present it because it was too overbought, but I'd like to get in on a pause or pullback.
I'm required to disclose if I currently own a stock I mention and/or may buy/short it within the next 72 hours.
"Technical Analysis is a windsock, not a crystal ball." - Carl Swenlin
(c) Copyright 2023 DecisionPoint.com
Watch the latest episode of DecisionPoint Trading Room with Carl & Erin Swenlin on Mondays 7:00p EST or on the DecisionPoint playlist on the StockCharts TV YouTube channel here!
NOTE: The stocks reported herein are from mechanical trading model scans that are based upon moving average relationships, momentum and volume. DecisionPoint analysis is then applied to get five selections from the scans. The selections given should prompt readers to do a chart review using their own analysis process. This letter is not a call for a specific action to buy, sell or short any of the stocks provided. There are NO sure things or guaranteed returns on the daily selection of "Diamonds in the Rough."
Regarding BUY/SELL Signals: The signal status reported herein is based upon mechanical trading model signals and crossovers. They define the implied bias of the price index/stock based upon moving average relationships and momentum, but they do not necessarily call for a specific action. They are information flags that should prompt chart review. Further, they do not call for continuous buying or selling during the life of the signal. For example, a BUY signal will probably (but not necessarily) return the best results if action is taken soon after the signal is generated. Additional opportunities for buying may be found as price zigzags higher, but the trader must look for optimum entry points. Conversely, exit points to preserve gains (or minimize losses) may be evident before the model mechanically closes the signal.
Helpful DecisionPoint Links:
DecisionPoint Shared ChartList and DecisionPoint Chart Gallery
Price Momentum Oscillator (PMO)
Swenlin Trading Oscillators (STO-B and STO-V)
For more links, go to DecisionPoint.com