
Today's scan results were lopsided to the short side. I have two primary scans, the Diamond PMO Scan and the Diamond Dog PMO Scan. Today the bullish Diamond PMO Scan turned up only two results and neither looked worthy to be called a "Diamond in the Rough". When I ran the bearish Diamond Dog Scan, I had over 100 results. It wasn't too hard to switch to the sell side given the selection of shorts was so plentiful.
I haven't listed shorts in awhile so let me explain briefly what I look for. Primarily I want broken support with plenty of downside potential. The scan already finds negative setups for the PMO so that makes it fairly easy. I prefer to find shorts within a dying sector and/or industry group. A few today are in groups with some relative strength but they are underperforming the group.
Basically turn my analysis upside down and you'll understand.
Good Luck & Good Trading!
Erin
Today's "Diamonds in the Rough": TRU (Short), WOLF (Short) and ZLAB (Short).
Other shorting opportunities: SEF, RWM, MRVL (Short), ALGT (Short) and NTR (Short).

RECORDING LINK (11/29/2022 - No Diamond Mine on 12/2):
Topic: DecisionPoint Diamond Mine (11/29/2022) LIVE Trading Room
Start Time: Nov 29, 2022 09:00 AM
Passcode: Nov#25th
REGISTRATION for 12/9/2022:
When: Dec 9, 2022 09:00 AM Pacific Time (US and Canada)
Topic: DecisionPoint Diamond Mine (12/9/2022) LIVE Trading Room
Register in advance for this webinar HERE

Here is the last recording:
Welcome to DecisionPoint Diamonds, wherein I highlight ten "Diamonds in the Rough" per week. These are selected from the results of my DecisionPoint Scans which search for stocks that could benefit from the trend and condition of the market. Remember, these are not recommendations to buy or sell, but are the most interesting of the stocks that surfaced in my scans. My objective is to save you the work of the initial, tedious culling process, but you need to apply your own analysis to see if these stocks pique your interest as well. There are no guaranteed winners here!
"Predefined Scans Triggered" are taken from StockCharts.com using the "Symbol Summary" option instead of a "SharpChart" on the workbench.
TransUnion.com (TRU) - Short
EARNINGS: 02/21/2023 (BMO)
TransUnion engages in the provision of information and risk management solutions. It also provides consumer reports, risk scores, analytical services and decision making capabilities to businesses. The firm operates through the following segments: U.S. Markets, International, Consumer Interactive, and Corporate. The U.S. Markets segment provides consumer reports, risk scores, analytical services and decision making capabilities to businesses. The International segment provides credit reports, analytics and decision making services and other value-added risk management services. The Consumer Interactive segment offers solutions that help consumers manage their personal finances and take precautions against identity theft. The Corporate segment provides support services to each segment, holds investments and conducts enterprise functions. The company was founded on February 15, 2012, and is headquartered in Chicago, IL.
Predefined Scans Triggered: Bearish MACD Crossovers and P&F Double Bottom Breakout.
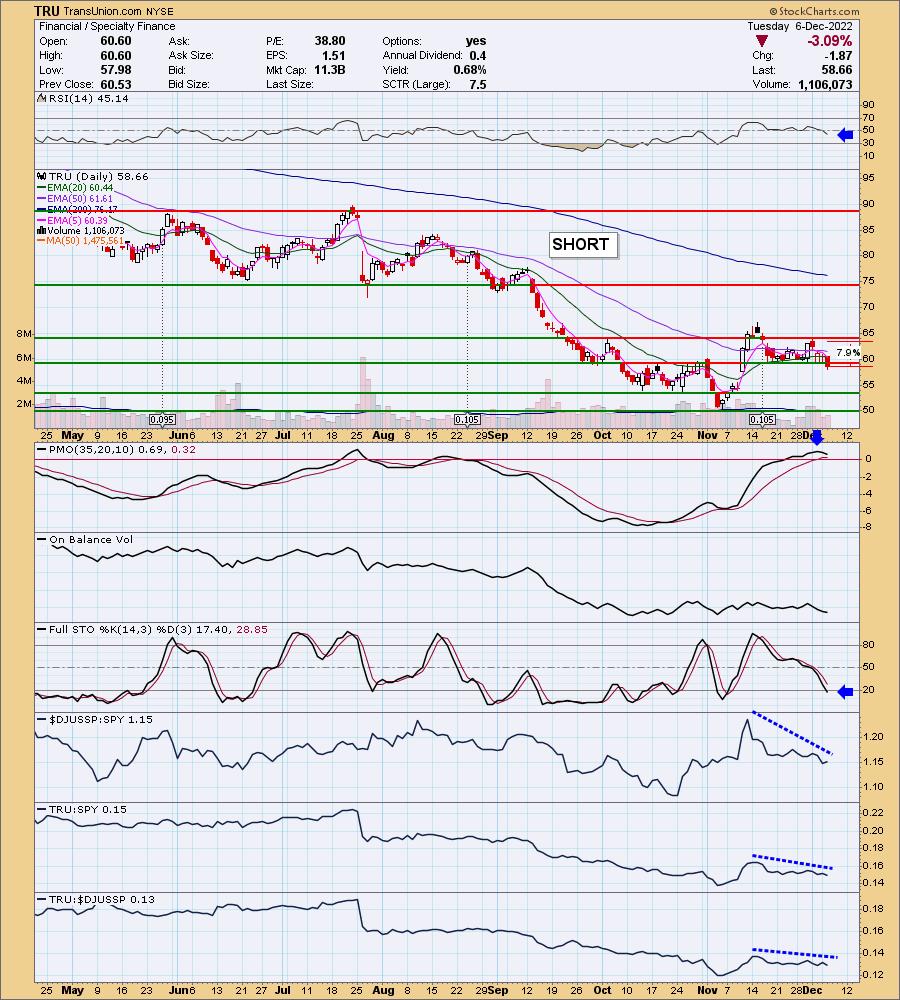
TRU is unchanged in after hours trading. This is in the sagging Financial sector. Today saw a short-term breakdown below strong support. The RSI is negative and the PMO is topping in near-term overbought territory. Stochastics are below 20. The group is certainly suffering within the already weak sector. TRU is underperforming the group and the SPY. Since this is a short, the stop is to the upside. I wanted to put it above overhead resistance but that was just too deep for me. The stop to the upside is 7.9% around $63.29.
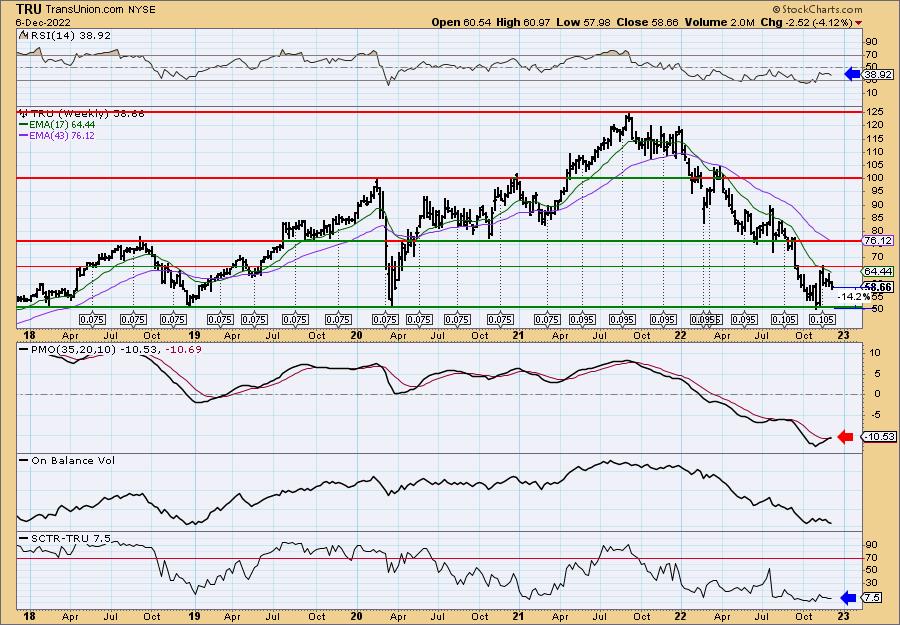
Unfortunately we need to think short-term for this short given the weekly PMO has just triggered a crossover BUY signal. The weekly RSI is firmly negative and the SCTR is a very low 7.5% indicating it is weaker than over 92% of large-cap stocks based on trend and condition. Downside potential to the nearest support level is over 14% away.
Wolfspeed, Inc. (WOLF) - Short
EARNINGS: 01/25/2023 (AMC)
Wolfspeed, Inc. is an innovator of Wolfspeed power and radio frequency (RF) semiconductors. Its Wolfspeed product families include silicon carbide materials, power-switching devices and RF devices targeted for applications such as electric vehicles, fast charging inverters, power supplies, telecom and military and aerospace. The company was founded by Calvin H. Carter Jr., John W. Palmour, F. Neal Hunter, Eric Hunter, and John Edmond in 1987 and is headquartered in Durham, NC.
Predefined Scans Triggered: P&F Descending Triple Bottom Breakdown, New CCI Sell Signals and P&F Double Bottom Breakout.
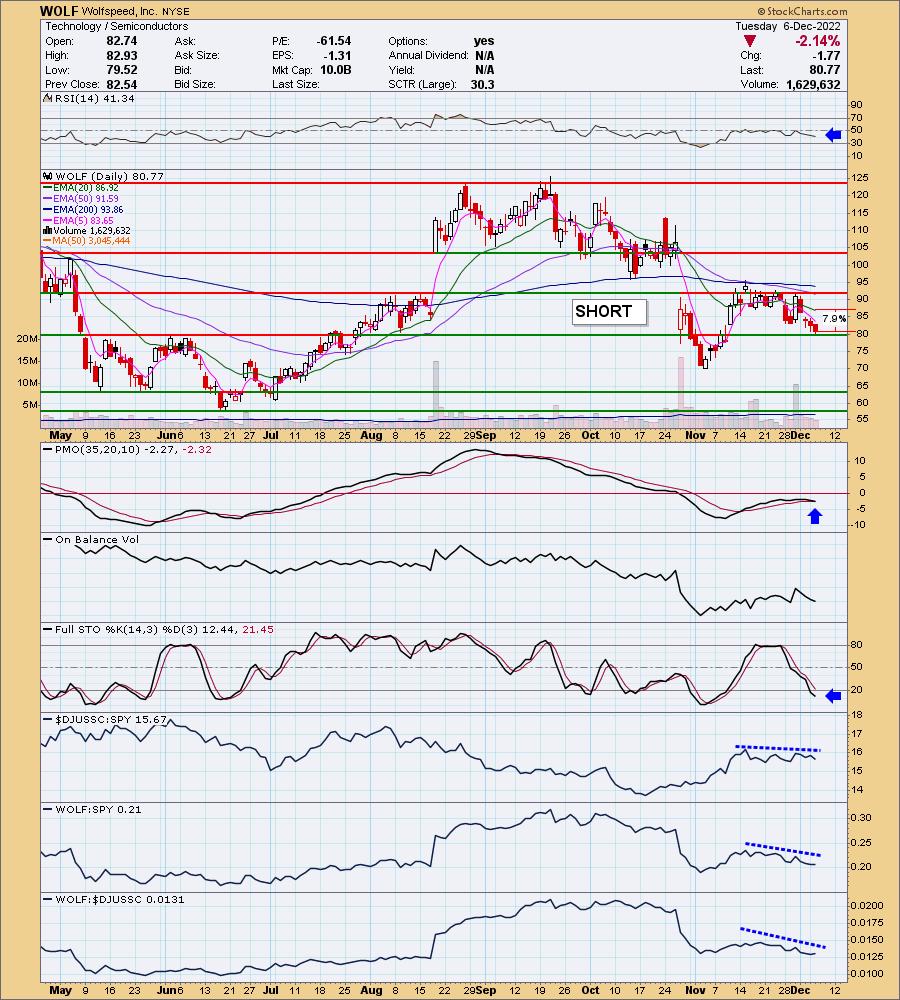
WOLF is up +0.01% in after hours trading. Let's start with the group. Semiconductors are just now beginning to underperform the market. There is a news story about a Chinese company opening a chip factory in Arizona. Not sure how that will affect the semis so keep that in mind. Price is actually sitting on support right now, but a breakdown seems imminent given the negative RSI and nearing PMO crossover SELL signal beneath the zero line. Stochastics are below 20. Even if semis do well, WOLF is underperforming the group and the SPY. I've set the upside stop at 7.9% around $87.15.
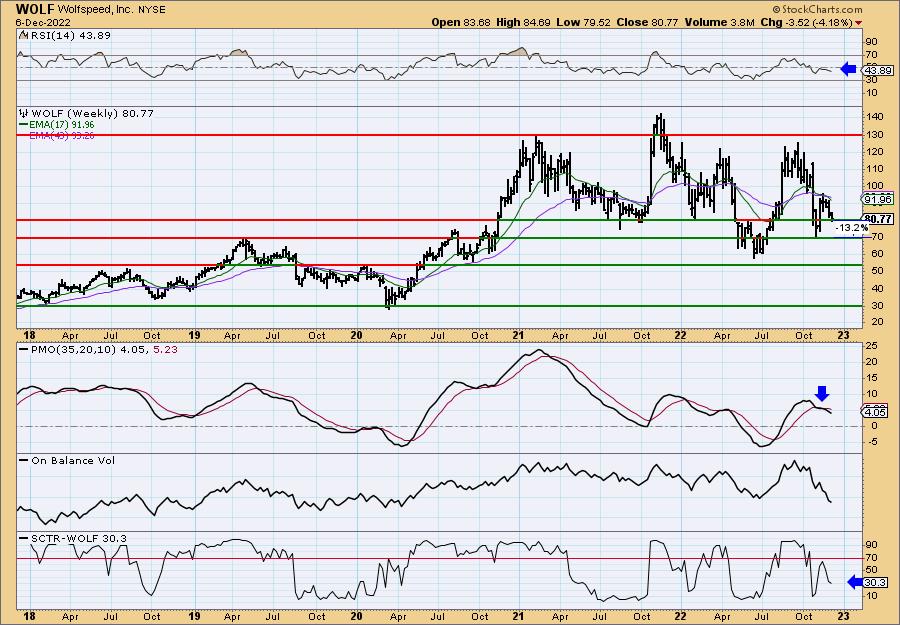
WOLF has the ugliest weekly chart of the bunch. There are a few support levels available, but even if it just reaches the first level of support, it would be a 13.2% gain on a short. The weekly RSI is negative and the SCTR is a low 30.3%.
Zai Lab, Ltd. (ZLAB) - Short
EARNINGS: 02/28/2023 (AMC)
Zai Lab Ltd. is a biopharmaceutical company, which engages in the developing and commercializing therapies that address medical conditions with unmet needs in oncology, autoimmune disorders, infectious diseases, and neuroscience. Its products include Zejula, Optune, Qinlock, and Nuzyra. The company was founded by Samantha Ying Du and Marietta Wu in April 2014 and is headquartered in Shanghai, China.
Predefined Scans Triggered: None.
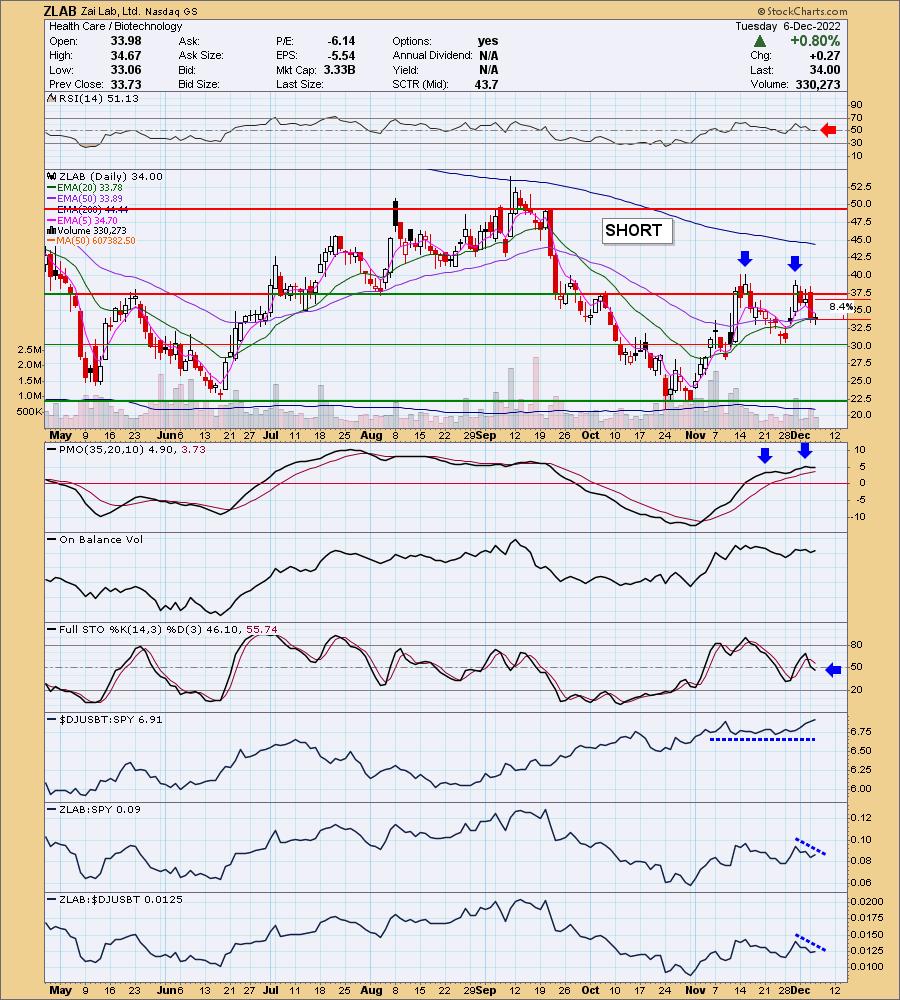
ZLAB is down -2.94% in after hours trading so we may be onto something here. This one is in the process of a breakdown. There is a bearish double-top on the chart that will be confirmed on a breakdown below the confirmation line at the last low. The RSI is not quite negative yet, but another decline will fix that. The PMO has topped twice and it is somewhat overbought. Stochastics just dropped below 50. I hesitated on this one because the Biotech group is one of the few that are outperforming. However, if you're familiar with the group, it is very hit and miss. Even as the group has been improving performance, ZLAB continues to underperform the group and the SPY. The upside stop on this short is about 8.4% around $36.85.
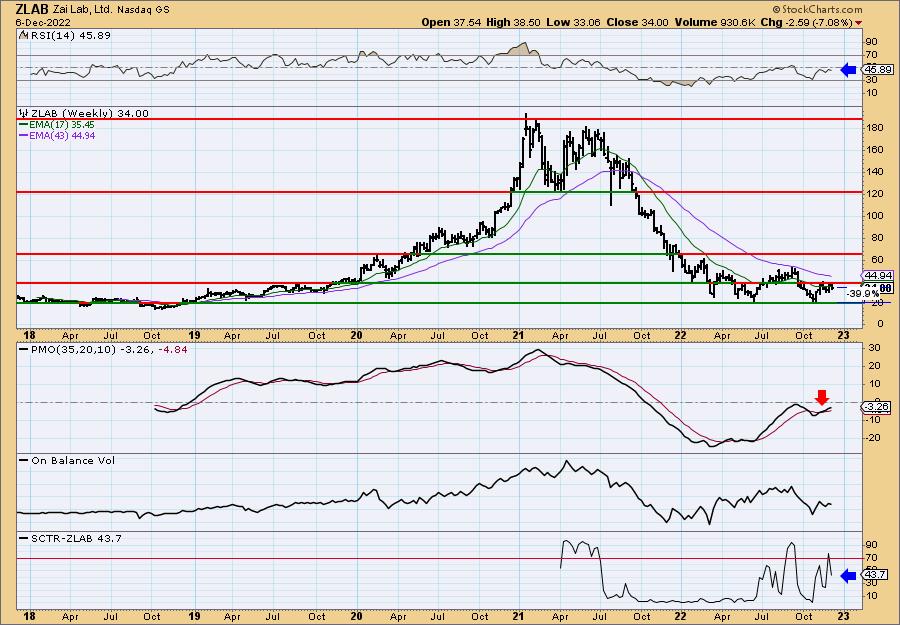
This weekly chart isn't all that bad given the weekly PMO is on a crossover BUY signal. However, the PMO is below the zero line. The weekly RSI is negative and now falling. The SCTR is a weak 43.7%.
Don't forget, on Thursdays I look at reader-requested symbols, click HERE to send me an email. I read every email I receive and try to answer them all!
Current Market Outlook:
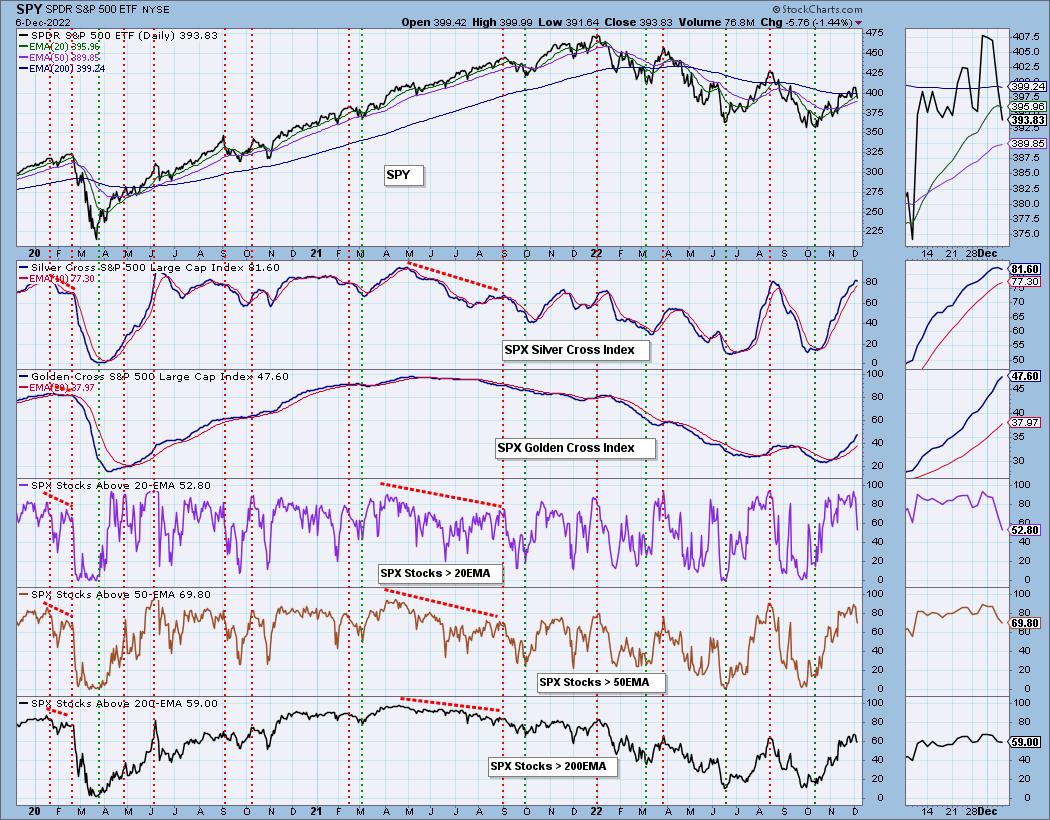
Market Environment: It is important to consider the odds for success by assessing the market tides. The following chart uses different methodologies for objectively showing the depth and trend of participation for intermediate- and long-term time frames.
- The Silver Cross Index (SCI) shows the percentage of SPX stocks on IT Trend Model BUY signals (20-EMA > 50-EMA)
- The Golden Cross Index (GCI) shows the percentage of SPX stocks on LT Trend Model BUY signals (50-EMA > 200-EMA)
Don't forget that as a "Diamonds" member, you have access to our GCI/SCI curated ChartList on DecisionPoint.com. You'll find it under "Members Only" links on the left side on the Blogs and Links Page.
Here is the current chart:
Full Disclosure: I am 10% exposed.
I'm required to disclose if I currently own a stock I mention and/or may buy/short it within the next 72 hours.
"Technical Analysis is a windsock, not a crystal ball." - Carl Swenlin
(c) Copyright 2022 DecisionPoint.com
Watch the latest episode of DecisionPoint with Carl & Erin Swenlin on Mondays 7:00p EST or on the DecisionPoint playlist on the StockCharts TV YouTube channel here!
NOTE: The stocks reported herein are from mechanical trading model scans that are based upon moving average relationships, momentum and volume. DecisionPoint analysis is then applied to get five selections from the scans. The selections given should prompt readers to do a chart review using their own analysis process. This letter is not a call for a specific action to buy, sell or short any of the stocks provided. There are NO sure things or guaranteed returns on the daily selection of "Diamonds in the Rough."
Regarding BUY/SELL Signals: The signal status reported herein is based upon mechanical trading model signals and crossovers. They define the implied bias of the price index/stock based upon moving average relationships and momentum, but they do not necessarily call for a specific action. They are information flags that should prompt chart review. Further, they do not call for continuous buying or selling during the life of the signal. For example, a BUY signal will probably (but not necessarily) return the best results if action is taken soon after the signal is generated. Additional opportunities for buying may be found as price zigzags higher, but the trader must look for optimum entry points. Conversely, exit points to preserve gains (or minimize losses) may be evident before the model mechanically closes the signal.
Helpful DecisionPoint Links:
DecisionPoint Shared ChartList and DecisionPoint Chart Gallery
Price Momentum Oscillator (PMO)
Swenlin Trading Oscillators (STO-B and STO-V)
For more links, go to DecisionPoint.com