
Welcome to another Reader Request Day. The pool of stocks wasn't very large, but I did find some "Diamonds in the Rough" hiding in them. Interestingly, today the majority of requests were from the Healthcare sector. I noticed yesterday while reviewing ETFs that the Healthcare sector ETFs were quite favorable so I'm not surprised that the ones I picked were heavy healthcare.
Two of the selections have cup with handle chart patterns that we'll discuss. The pattern is bullish and suggests excellent followthrough when the patterns execute.
I'm cutting this short as I have a flight to Vegas this evening. Remember no Diamond Mine trading room tomorrow as I have the day off. Publications including the DP Diamonds Recap will be published by Sunday.
Good Luck & Good Trading!
Erin
Today's "Diamonds in the Rough": ADP, ALT, INMD and NBIX.
Other requests of note: BABA, RBLX, CPRX, GLP, SNDX, WIX and LNG.
** SCHEDULE CHANGE **
Next week there will be no Diamond Mine on December 2nd and the Recap will go out by Sunday December 4th.

RECORDING LINK (11/25/2022):
Topic: DecisionPoint Diamond Mine (11/25/2022) LIVE Trading Room
Start Time: Nov 25, 2022 09:00 AM
Passcode: Nov#25th
** NO DIAMOND MINE on December 2nd **
The Diamonds Recap will be published on December 3rd.

Here is the last recording:
Welcome to DecisionPoint Diamonds, wherein I highlight ten "Diamonds in the Rough" per week. These are selected from the results of my DecisionPoint Scans which search for stocks that could benefit from the trend and condition of the market. Remember, these are not recommendations to buy or sell, but are the most interesting of the stocks that surfaced in my scans. My objective is to save you the work of the initial, tedious culling process, but you need to apply your own analysis to see if these stocks pique your interest as well. There are no guaranteed winners here!
"Predefined Scans Triggered" are taken from StockCharts.com using the "Symbol Summary" option instead of a "SharpChart" on the workbench.
Automatic Data Processing, Inc. (ADP)
EARNINGS: 01/25/2023 (BMO)
Automatic Data Processing, Inc. engages in the provision of business outsourcing solutions specializing in cloud-based human capital management. It operates through the following business segments: Employer Services, Professional Employer Organization Services, and Other. The Employer Services segment provides clients ranging from single-employee small businesses to large enterprises with tens of thousands of employees around the world, offering a range of human resources outsourcing and technology-based human capital management solutions, including strategic, cloud-based platforms. The Professional Employer Organization Services segment offers small and mid-sized businesses a human resources outsourcing solution through a co-employment mode. The company was founded by Henry Taub in 1949 and is headquartered in Roseland, NJ.
Predefined Scans Triggered: New CCI Buy Signals, Moved Above Upper Keltner Channel, New 52-week Highs, Moved Above Upper Price Channel and P&F Double Top Breakout.
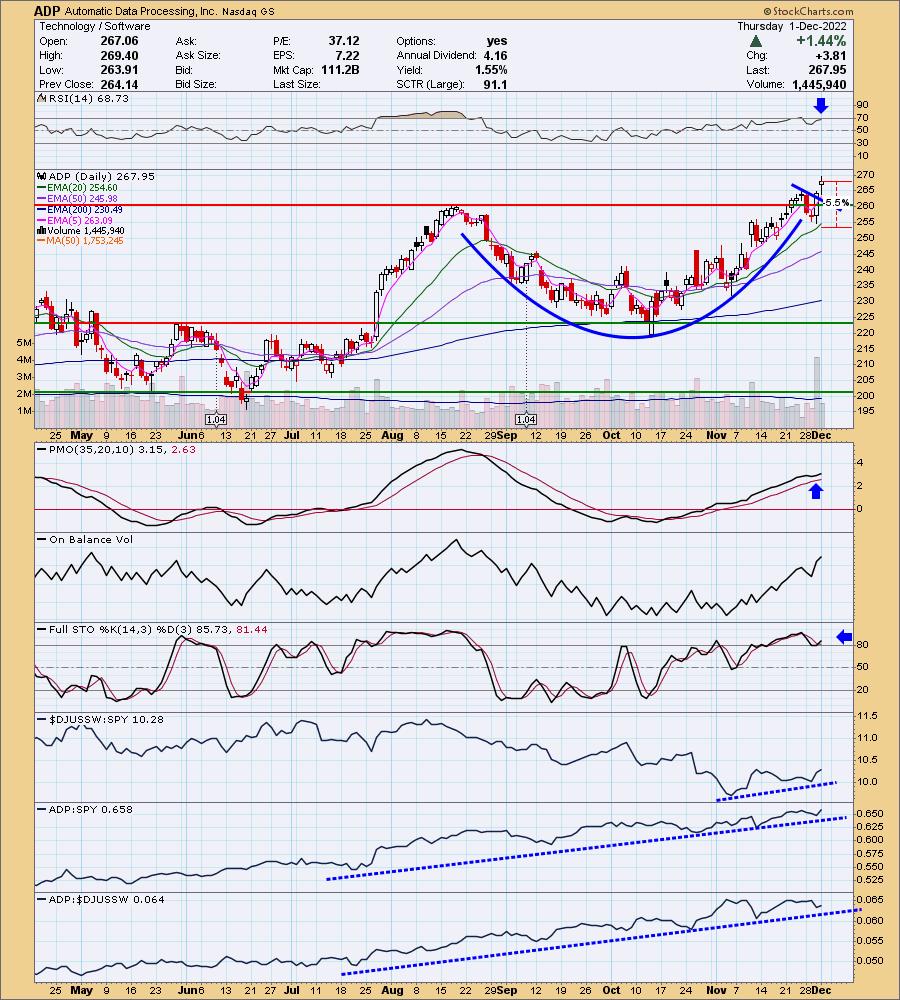
ADP is up +0.17% in after hours trading. Here is our first cup with handle chart pattern. The chart should see the second lip of the cup higher than the first. Then we see a pullback (handle). The RSI is positive and the PMO has bottomed above its signal line which is very bullish. Stochastics are firmly above 80 and relative strength is improving for the group and ADP is an excellent performer against the SPY and has leadership within the Software industry group. The stop can be set thinly at 5.5% or $253.21.
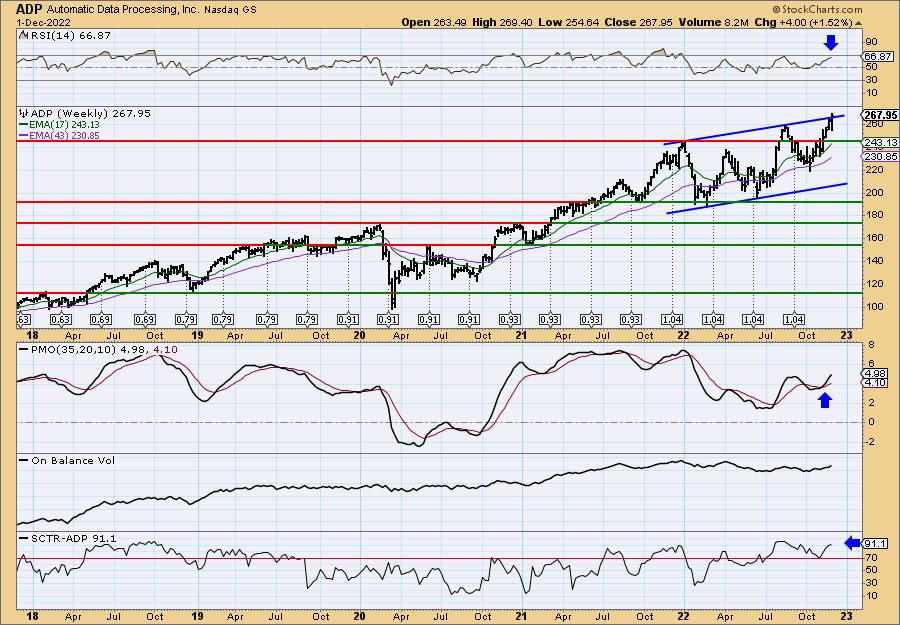
In the long term, ADP is in a rising trend channel. It is at the top so it is vulnerable to a decline right now. However, the indicators are very positive. The weekly RSI is positive, rising and not yet overbought. The weekly PMO is rising on a clean crossover BUY signal. The SCTR is 91.1% implying based on trend and condition, it is in the top 9% of all large-caps. Since it is at all-time highs, consider a 15% upside target around $308.14.
Altimmune, Inc. (ALT)
EARNINGS: 03/15/2023 (BMO)
Altimmune, Inc. is a clinical stage biopharmaceutical company, which focuses on the development of novel peptide-based therapeutics for the treatment of obesity and liver diseases. The company's lead product candidate, pemvidutide, is a GLP-1/glucagon dual receptor agonist that is being developed for the treatment of obesity and NASH. In addition, Altimmune is developing HepTcell, an immunotherapeutic designed to achieve a functional cure for chronic hepatitis B. The company was founded in 1997 and is headquartered in Gaithersburg, MD.
Predefined Scans Triggered: None.
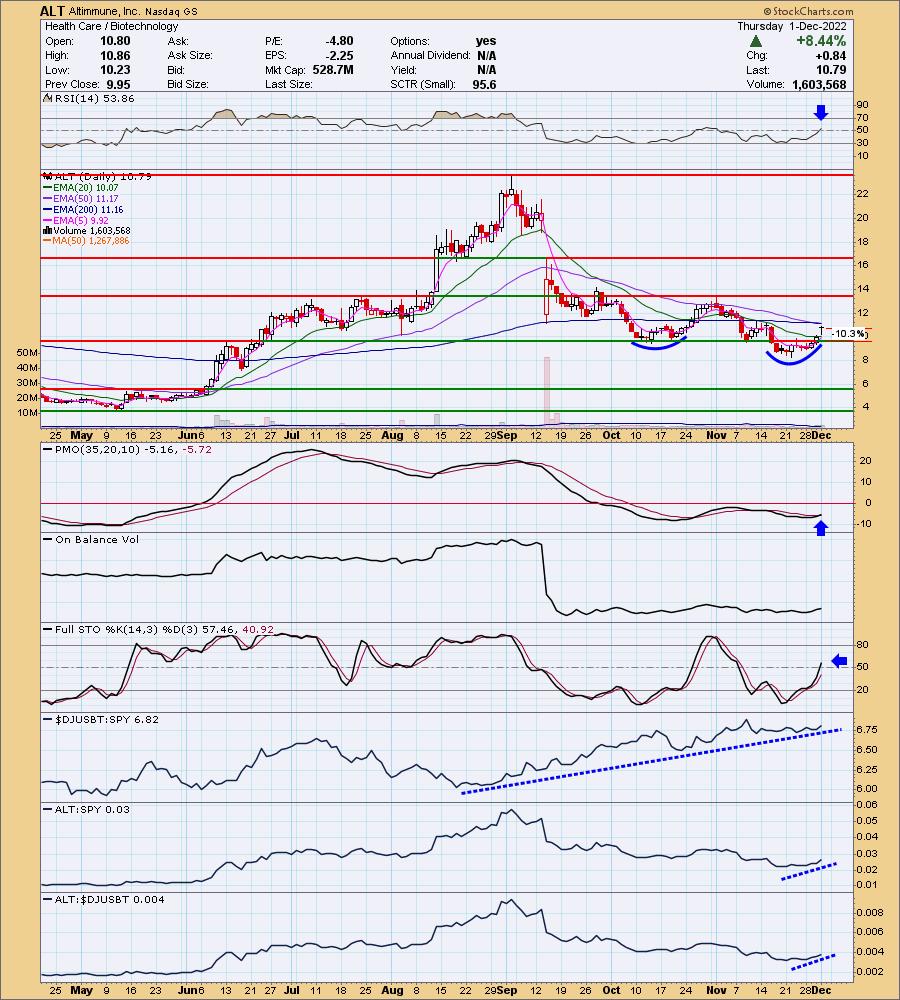
ALT is up +0.09% in after hours trading. Here we have a bullish double-bottom pattern forming. It won't confirmed until it breaks out above the October top and that would mean a huge rally so we'll see if it can push through. Indicators suggest it will. The RSI just moved into positive territory, the PMO just had a crossover BUY signal and Stochastics are rising nicely. I do not like that it had a recent "death cross" of the 50/200-day EMAs, but if price moves above the 200-day EMA, the 50-day EMA will follow and cancel out the signal. Relative strength is positive for the group and ALT is beginning to outperform both the group and consequently the SPY. The stop has to be very deep given today's 8.44% rally. I imagine you'll get a better entry and it won't be so daunting. The stop is at 10.3% around $9.67.
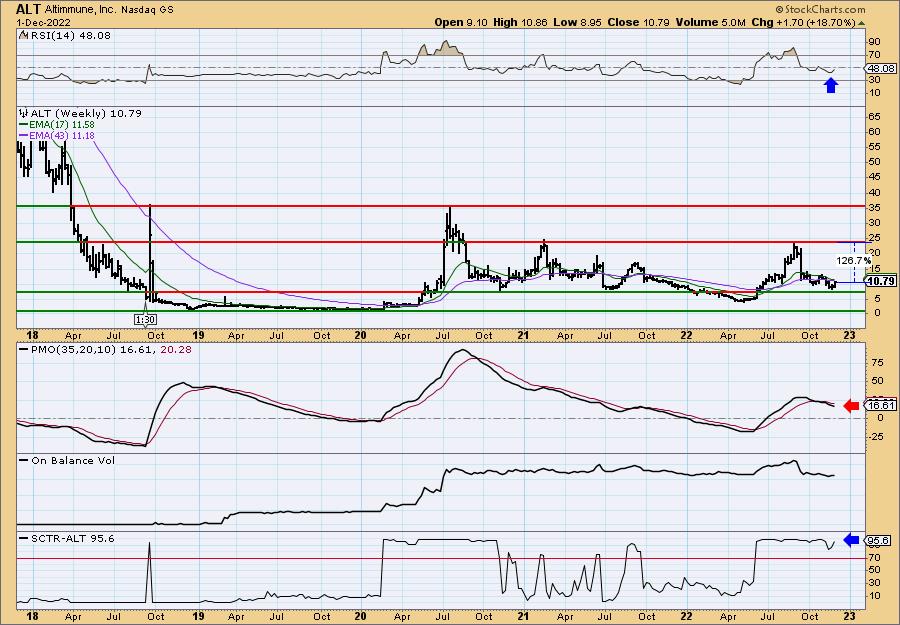
Good and bad on the weekly chart. Good is the rising RSI and high 95.6% SCTR. Bad is the weekly PMO declining on a crossover SELL signal alongside an RSI that is negative (below net neutral (50)).
InMode Ltd. (INMD)
EARNINGS: 02/09/2023 (BMO)
InMode Ltd. designs, develops, manufactures and markets minimally-invasive aesthetic medical products. It also designs, develops, manufactures and markets non-invasive medical aesthetic products that target a array of procedures including permanent hair reduction, facial skin rejuvenation, wrinkle reduction, cellulite treatment, skin appearance and texture and superficial benign vascular and pigmented lesions. The company was founded by Moshe Mizrahy and Michael Kreindel on January 2, 2008 and is headquartered in Yokneam, Israel.
Predefined Scans Triggered: New CCI Buy Signals and Ichimoku Cloud Turned Green.
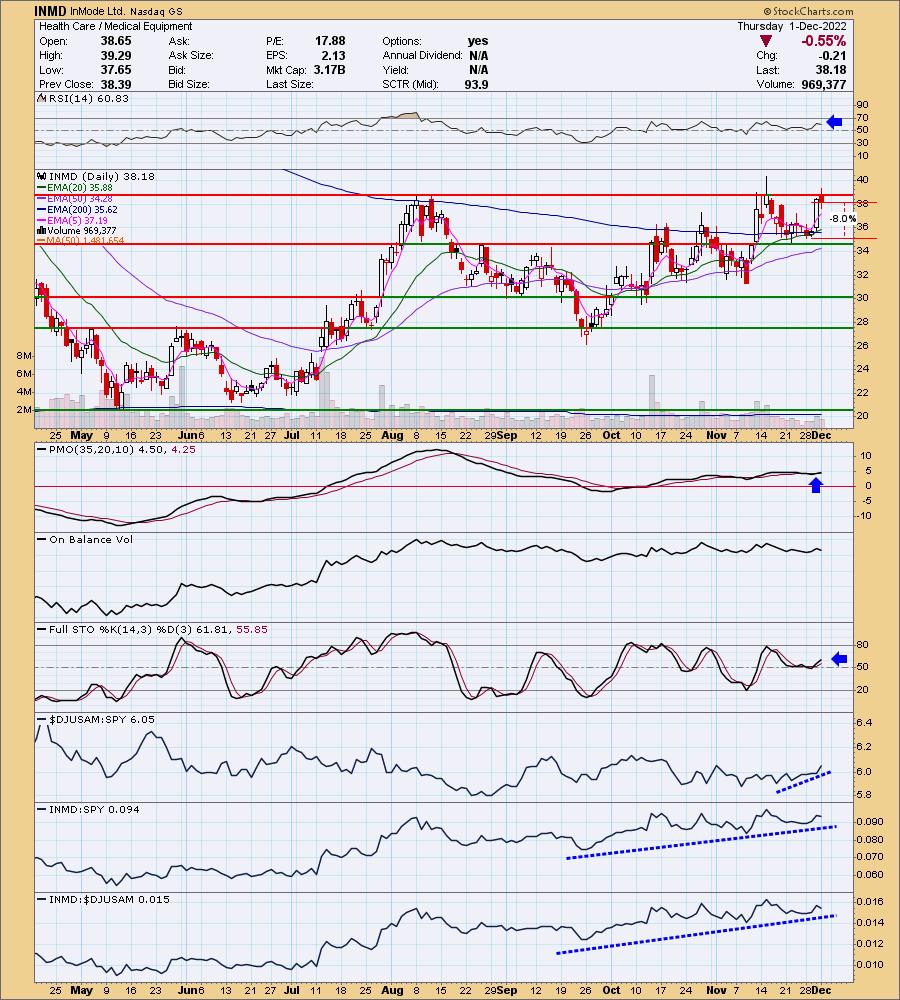
INMD is up +0.37% in after hours trading. The chart looks good, I would prefer to have confirmation with a strong breakout, but everything else looks pretty good. The RSI is positive and the PMO is on a crossover BUY signal and rising despite today's decline. Stochastics are in positive territory and rising. Relative strength for the group is improving. INMD is already a strong performer against the SPY. It's no wonder as it is also outperforming its industry group. I've set the stop at 8% below the 200-day EMA or around $35.12.
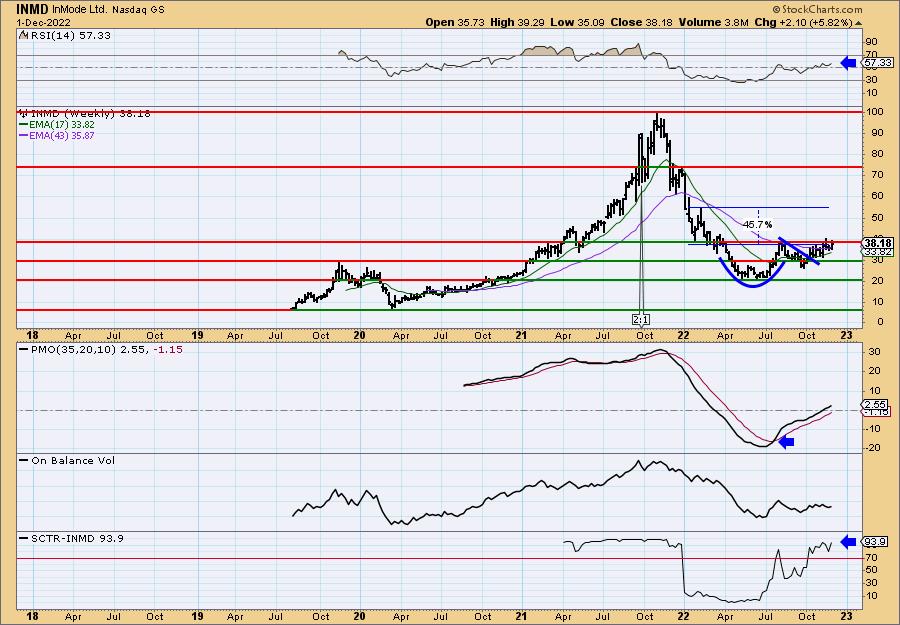
Here is the second cup with handle pattern. The second lip of the cup is under the first, but it still looks good to me. We are seeing a slight rising trend coming out of the handle. Again, I'd like to see the breakout here, but given the strong weekly indicators, it should. The weekly RSI is positive and the weekly PMO just made it above the zero line on an oversold crossover BUY signal. The SCTR is excellent at 93.9%.
Neurocrine Biosciences, Inc. (NBIX)
EARNINGS: 02/09/2023 (BMO)
Neurocrine Biosciences, Inc. is a neuroscience-focused, biopharmaceutical company. It discovers, develops and intends to commercialize drugs for the treatment of neurological and endocrine related diseases and disorders. The firm's product includes INGREZZA. The company was founded by Kevin C. Gorman and Wylie W. Vale in January 1992 and is headquartered in San Diego, CA.
Predefined Scans Triggered: New 52-week Highs, P&F Ascending Triple Top Breakout and P&F Double Top Breakout.
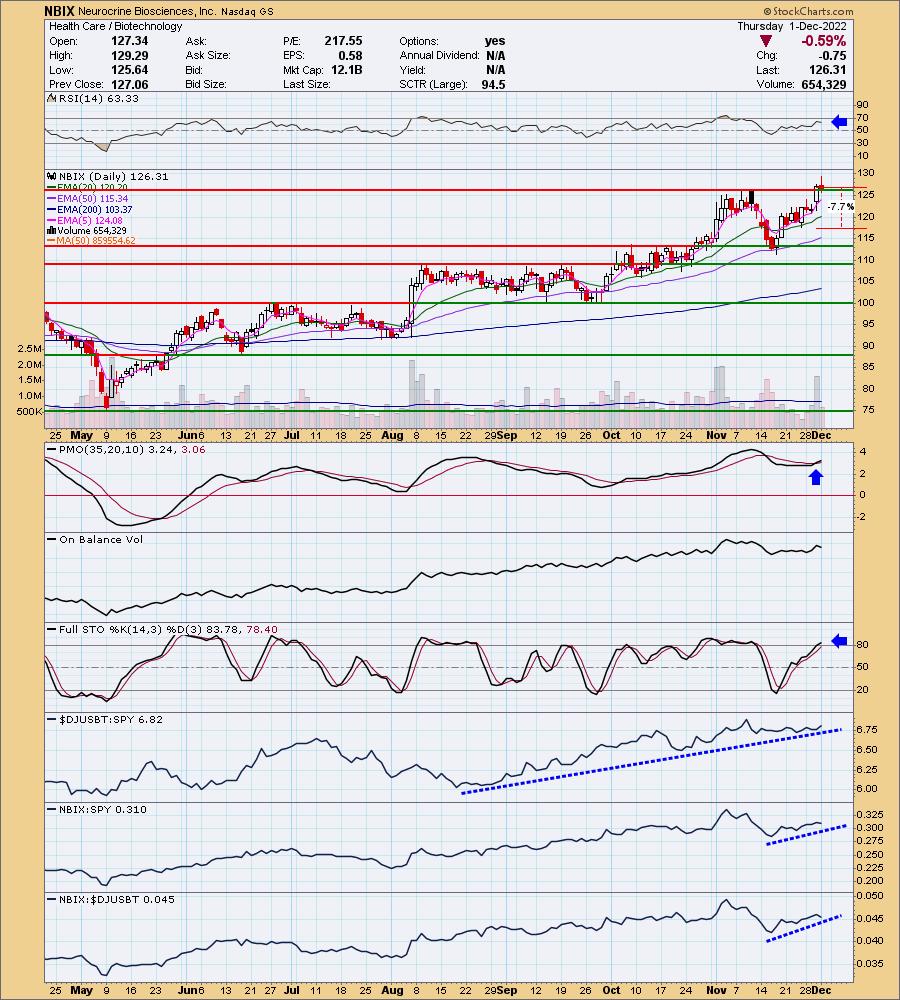
NBIX is up +2.09% after hours. Price did manage to close just above support even on today's decline. The RSI is positive and the PMO just generated a crossover BUY signal. Stochastics have now moved above 80 and relative strength is excellent. The group has been outperforming since August and NBIX is just now picking up some strength. The stop is set between the 20/50-day EMAs below the last November bottom around $116.58.
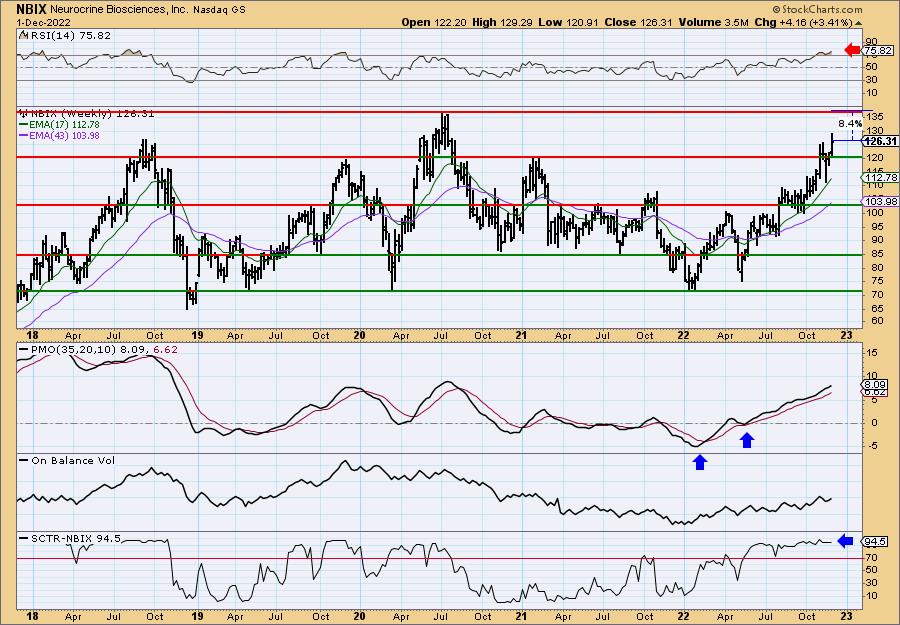
It's about to reach all-time highs so consider an upside target of about 15% around $145.26. Two problems with this weekly chart. The weekly RSI is very overbought. However, remember that overbought conditions can persist in a bull market and NBIX is definitely in one. The other issue I have is the wide trading range. While the indicators are very positive, I worry that it will pull back to $120 before moving higher again. This is complete speculation, but a condition I've seen numerous times. The weekly PMO is rising strongly after an oversold crossover BUY signal and a follow on bottom above its signal line. The SCTR is a healthy 94.5%.
Don't forget, on Thursdays I look at reader-requested symbols, click HERE to send me an email. I read every email I receive and try to answer them all!
Current Market Outlook:
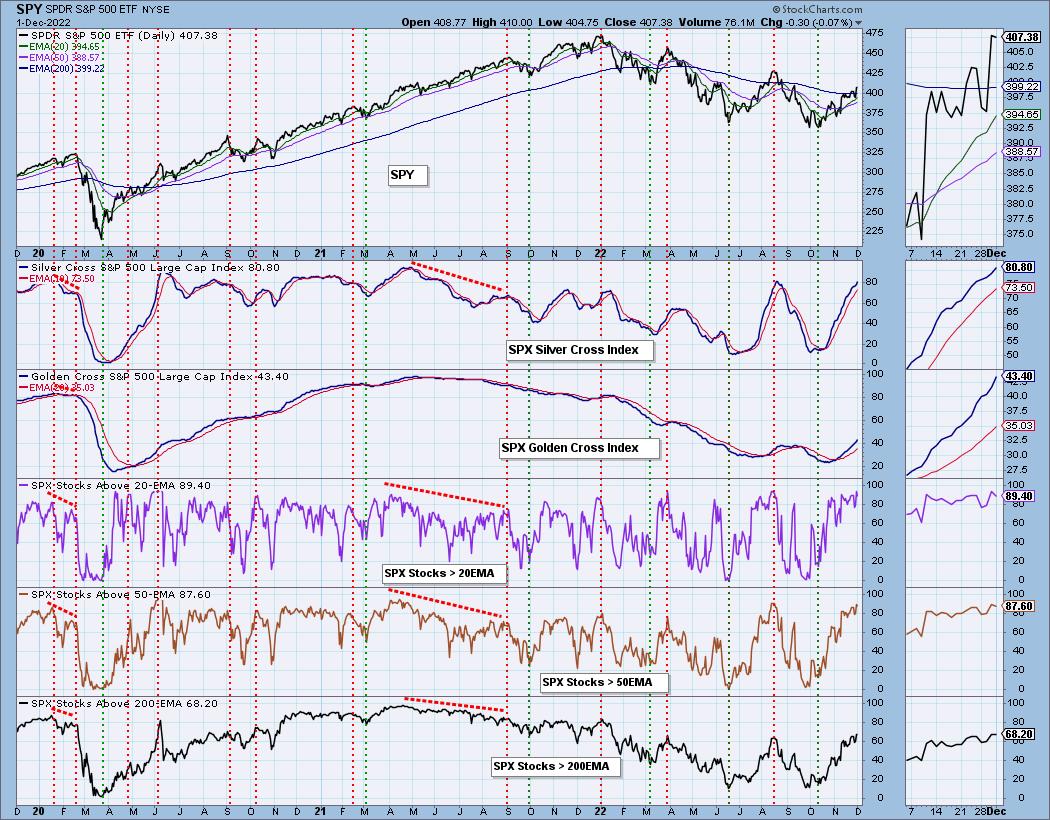
Market Environment: It is important to consider the odds for success by assessing the market tides. The following chart uses different methodologies for objectively showing the depth and trend of participation for intermediate- and long-term time frames.
- The Silver Cross Index (SCI) shows the percentage of SPX stocks on IT Trend Model BUY signals (20-EMA > 50-EMA)
- The Golden Cross Index (GCI) shows the percentage of SPX stocks on LT Trend Model BUY signals (50-EMA > 200-EMA)
Don't forget that as a "Diamonds" member, you have access to our GCI/SCI curated ChartList on DecisionPoint.com. You'll find it under "Members Only" links on the left side on the Blogs and Links Page.
Here is the current chart:
Full Disclosure: I am 10% exposed.
I'm required to disclose if I currently own a stock I mention and/or may buy/short it within the next 72 hours.
"Technical Analysis is a windsock, not a crystal ball." - Carl Swenlin
(c) Copyright 2022 DecisionPoint.com
Watch the latest episode of DecisionPoint with Carl & Erin Swenlin on Mondays 7:00p EST or on the DecisionPoint playlist on the StockCharts TV YouTube channel here!
NOTE: The stocks reported herein are from mechanical trading model scans that are based upon moving average relationships, momentum and volume. DecisionPoint analysis is then applied to get five selections from the scans. The selections given should prompt readers to do a chart review using their own analysis process. This letter is not a call for a specific action to buy, sell or short any of the stocks provided. There are NO sure things or guaranteed returns on the daily selection of "Diamonds in the Rough."
Regarding BUY/SELL Signals: The signal status reported herein is based upon mechanical trading model signals and crossovers. They define the implied bias of the price index/stock based upon moving average relationships and momentum, but they do not necessarily call for a specific action. They are information flags that should prompt chart review. Further, they do not call for continuous buying or selling during the life of the signal. For example, a BUY signal will probably (but not necessarily) return the best results if action is taken soon after the signal is generated. Additional opportunities for buying may be found as price zigzags higher, but the trader must look for optimum entry points. Conversely, exit points to preserve gains (or minimize losses) may be evident before the model mechanically closes the signal.
Helpful DecisionPoint Links:
DecisionPoint Shared ChartList and DecisionPoint Chart Gallery
Price Momentum Oscillator (PMO)
Swenlin Trading Oscillators (STO-B and STO-V)
For more links, go to DecisionPoint.com