
Today is Reader Request Day! For new members, this is a day where I look at all of the requests I've received for the week and determine if any are prospective "Diamonds in the Rough". I have four requests but one of the stocks I see as risky and maybe not a "Diamond in the Rough". We'll talk about that later.
I've gotten a lot of questions regarding the viability of the Energy sector 2x bear ETF (ERY). Most of you know I currently own a position in ERY which might be prompting the questions. Crude did rally somewhat this week and that did put downside pressure on ERY, however I still see it as a holdable position.
Tomorrow is the subscriber-only Diamond Mine trading room! Be sure to register using the link below the Diamonds logo. If you lose the confirmation or are having trouble finding your way into the room, you can always re-register and a new confirmation email will be sent.
Good Luck & Good Trading!
Erin
Today's "Diamonds in the Rough": ERY, GTLB, PWSC, RCKT and YEXT.
Other requests: CWEB, JBHT, MRNA, IBM, BOX and TALO.

RECORDING LINK 12/9/2022:
Topic: DecisionPoint Diamond Mine (12/9/2022) LIVE Trading Room
Start Time: Dec 9, 2022 09:00 AM PT
Passcode: December@9
REGISTRATION for 12/16/2022:
When: Dec 16, 2022 09:00 AM Pacific Time (US and Canada)
Topic: DecisionPoint Diamond Mine (12/16/2022) LIVE Trading Room
Register in advance for this webinar HERE

Here is the last recording:
Welcome to DecisionPoint Diamonds, wherein I highlight ten "Diamonds in the Rough" per week. These are selected from the results of my DecisionPoint Scans which search for stocks that could benefit from the trend and condition of the market. Remember, these are not recommendations to buy or sell, but are the most interesting of the stocks that surfaced in my scans. My objective is to save you the work of the initial, tedious culling process, but you need to apply your own analysis to see if these stocks pique your interest as well. There are no guaranteed winners here!
"Predefined Scans Triggered" are taken from StockCharts.com using the "Symbol Summary" option instead of a "SharpChart" on the workbench.
Direxion Daily Energy Bear 2x Shares (ERY)
EARNINGS: N/A
ERY provides 2x inverse exposure to a market-cap-weighted index of US large-cap companies in the energy industry. Click HERE for more information.

Predefined Scans Triggered: Filled Black Candles, P&F High Pole and Entered Ichimoku Cloud.
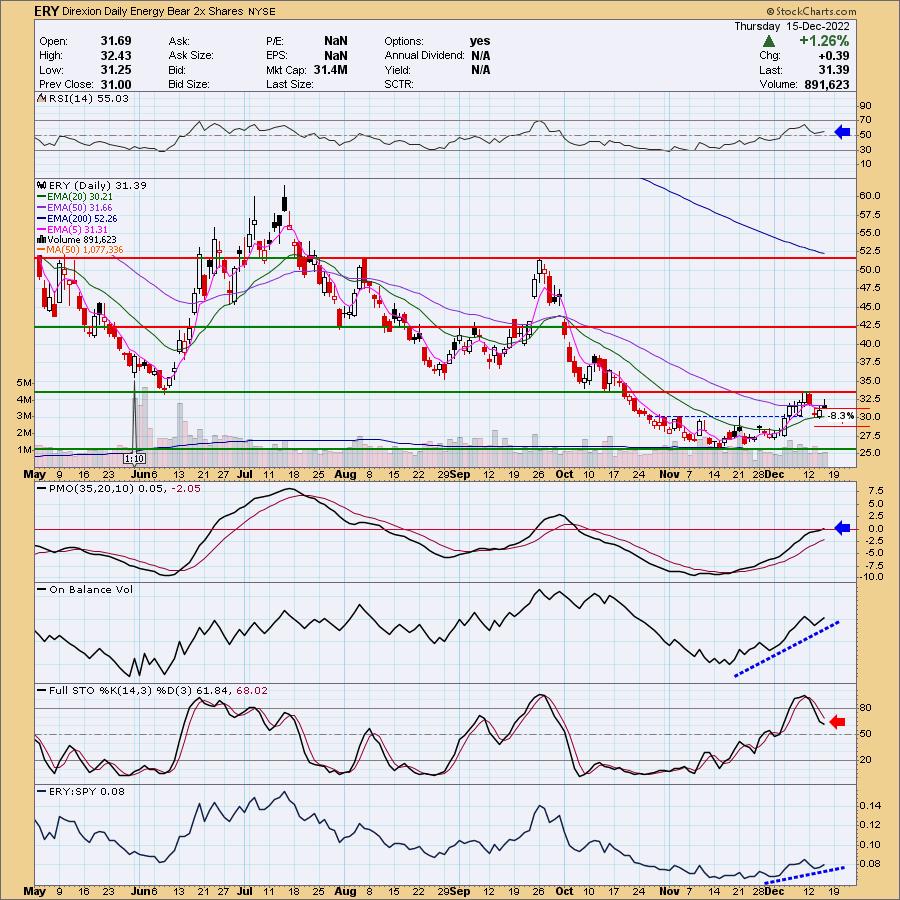
ERY is down -0.41% in after hours trading. With the rally in Crude Oil, this inverse hasn't paid off yet. However, I now see a bullish cup with handle pattern. Today's filled black candle does imply another down day tomorrow. Notice that the RSI has remained positive and the PMO, while decelerating somewhat, did make it over the zero line today and continues to rise. The OBV is definitely confirming this rising trend. I do not like Stochastics at all. They tend to be an early warning system and they have topped and are moving lower. Good news, they are decelerating in positive territory. I've reset the stop. You can make it thinner, but because this is a 2x ETF, I believe we need deeper stop levels. Remember, this is a hedge. It is there to make losses on other positions less severe when the market is weak and falling. The stop is 8.3% around $28.78.
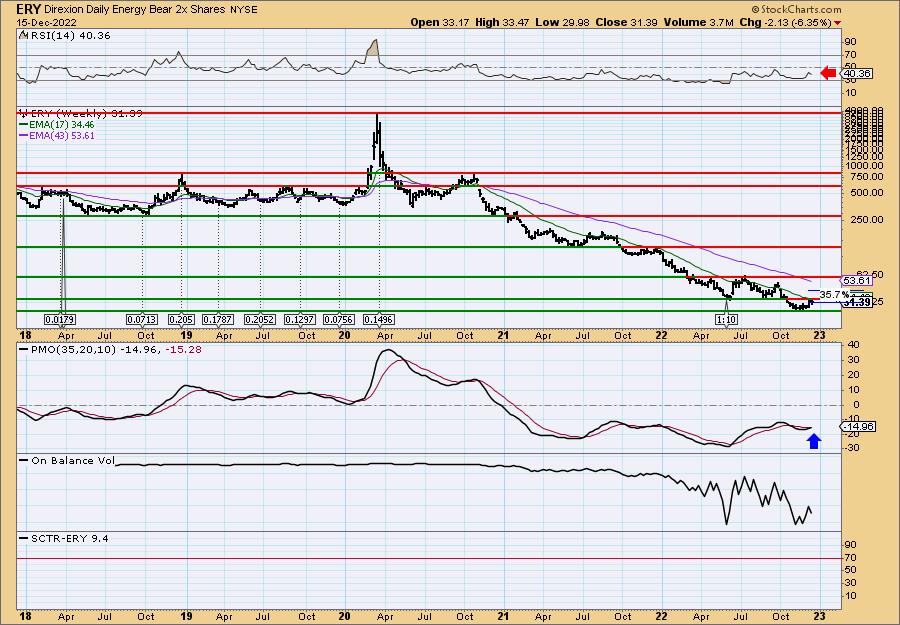
The weekly PMO has since had a positive crossover. Overhead resistance is holding, but a breakout here could mean excellent returns. I see ERY as a hold and possible buy.
Gitlab Inc. (GTLB)
EARNINGS: 03/13/2023 (AMC)
Gitlab, Inc. provides code hosting and collaboration platform services. It offers continuous integration, source code management, out-of-the-box pipelines, agile development, and value stream management. The company was founded by Dmitriy Zaporozhets and Sid Sijbrandij in 2014 and is headquartered in San Francisco, CA.
Predefined Scans Triggered: Elder Bar Turned Blue and Hollow Red Candles.
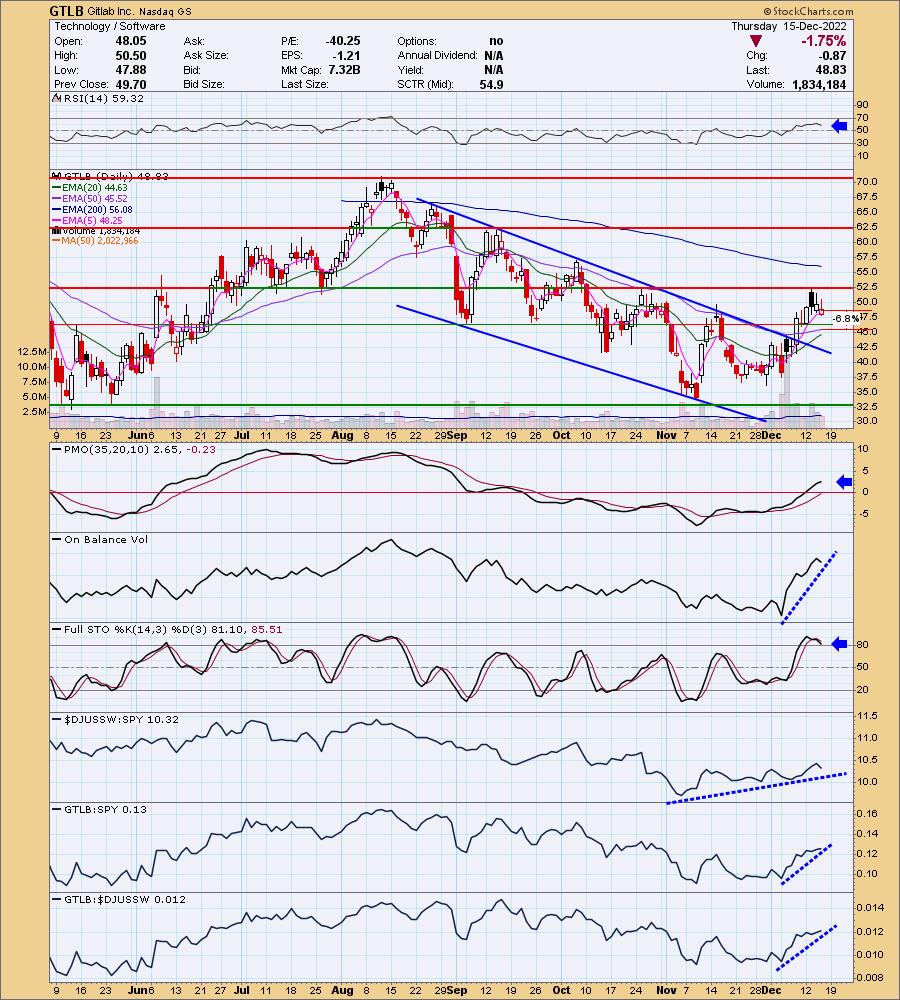
GTLB is down -0.68% in after hours trading. I'd be careful with Technology positions. If the market continues its decline, those stocks will likely be the hardest hit. This chart does have merit though. We have a strong breakout from a bullish falling wedge. It is pulling back toward the breakout point and could see a bit more downside before it reverses higher. The RSI is comfortably positioned in positive territory above net neutral (50). The PMO decelerated on the decline, but is still rising on a BUY signal. The OBV is certainly confirming the rally. Stochastics remain above 80 although they have topped and could move below 80. The stop is set at 6.8% or around $45.51.
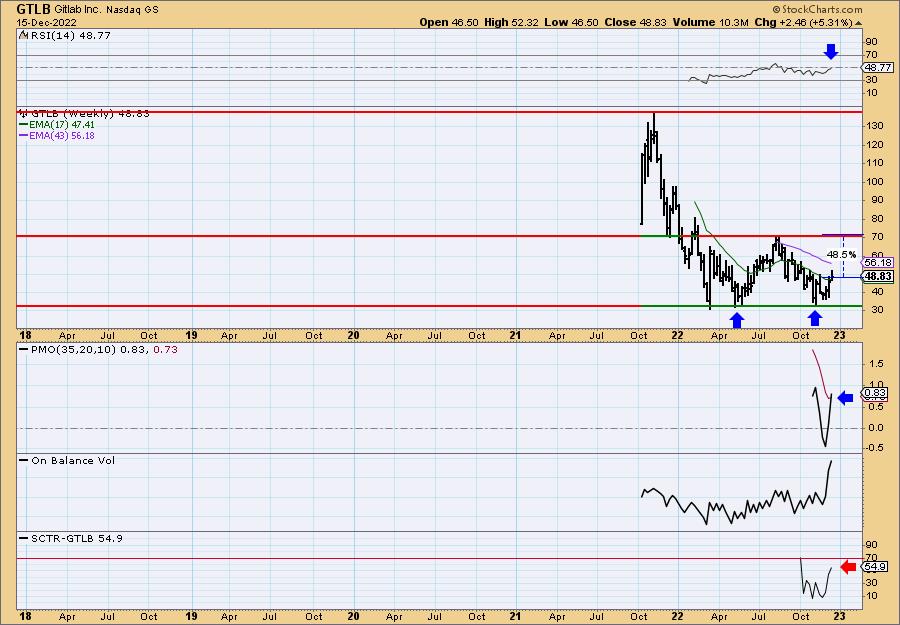
We have a large bullish double-bottom forming on the weekly chart. The weekly PMO just generated a crossover BUY signal. The weekly RSI is rising and should get back above net neutral (50) soon. If it can complete the double-bottom formation that would be an over 48% gain. I'm not that bullish on it, but the weekly chart does seem to say the trade will be successful.
PowerSchool Holdings Inc. (PWSC)
EARNINGS: 03/02/2023 (AMC)
PowerSchool Holdings, Inc. is a holding company, which provides cloud-based software to the K-12 education market. It provides a unified platform that includes the core system of record used by districts and schools and leverage their rich data to deliver insights and analytics to improve education outcomes. The company was founded on November 30, 2020 and is headquartered in Folsom, CA.
Predefined Scans Triggered: New 52-week Highs and P&F Double Top Breakout.
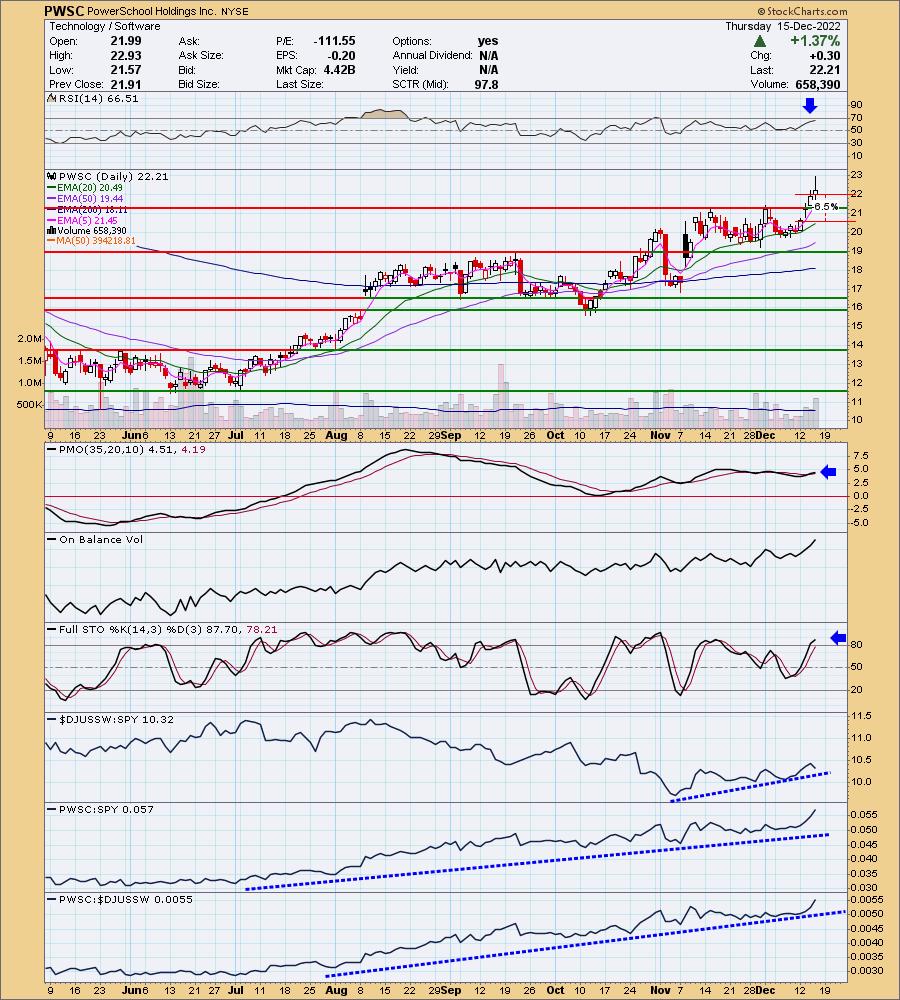
PWSC is unchanged in after hours trading. We have a nice breakout to new 52-week highs. The PMO recently triggered a crossover BUY signal. It's not yet overbought. The RSI is rising in positive territory and is also not yet overbought. Stochastics just moved above 80 and the OBV is confirming the rise. Relative strength is very good across the board. The stop is set at 6.5% around $20.76.
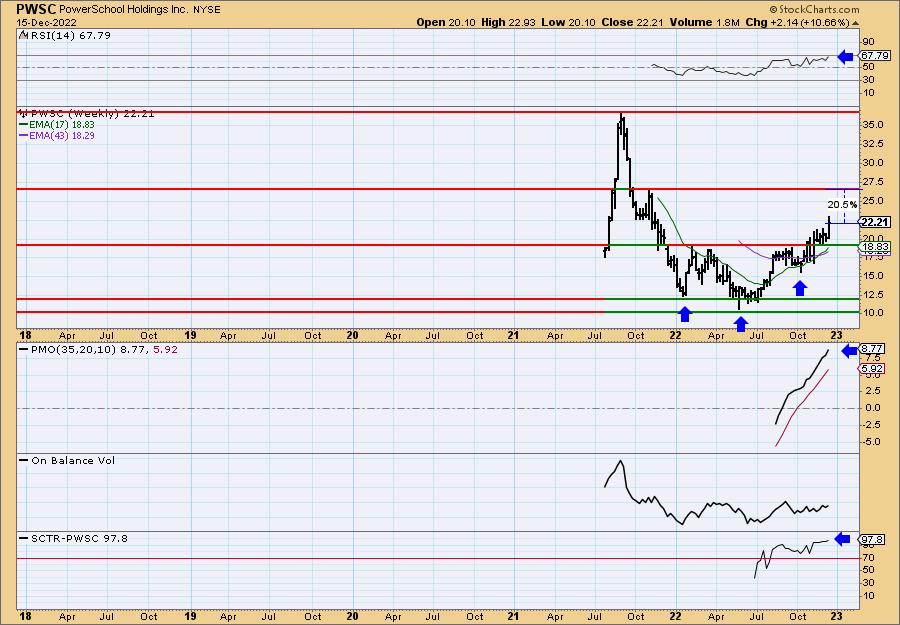
We have a confirmed reverse head and shoulders on the weekly chart. The upside target would give this investment a 20%+ gain. The weekly RSI is positive and rising and the weekly PMO is rising strongly. The SCTR is excellent at 97.8% which suggests PWSC is in the top 4% of all mid-cap stocks based on trend and condition.
Rocket Pharmaceuticals Corp. (RCKT)
EARNINGS: 02/23/2023 (AMC)
Rocket Pharmaceuticals, Inc. is a clinical-stage biotechnology company, which engages in the development of gene therapy treatment options for rare and devastating pediatric diseases. Its multi-platform development approach applies the lentiviral vector (LVV) and adeno-associated viral vector (AAV) gene therapy platforms. The firm's clinical program is a LVV-based gene therapy for the treatment of Fanconi Anemia (FA), a difficult to treat genetic disease that leads to bone marrow failure and potentially cancer. The company was founded on July 7, 1999 and is headquartered in Cranbury, NJ.
Predefined Scans Triggered: P&F Double Top Breakout and P&F Bullish Triangle.
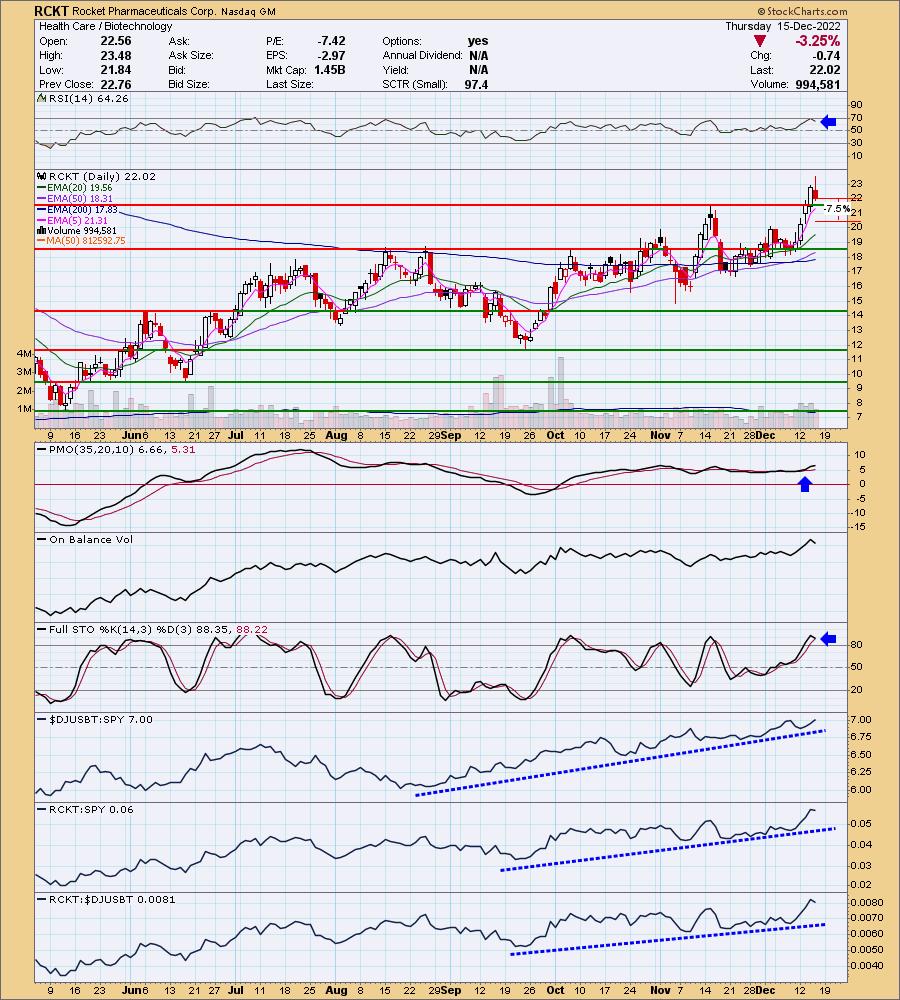
RCKT is down -0.94% in after hours trading. It was a difficult day for RCKT, but it was technically a nice pullback after a strong rally breakout. The RSI remains positive and the PMO while decelerating is still rising on a crossover BUY signal. If this one doesn't bounce off this support level, it would be more risky in my mind. Stochastics are above 80 and relative strength is rising across the board. The stop is set below support at 7.5% (although you could tighten it if you wish) around $20.37.
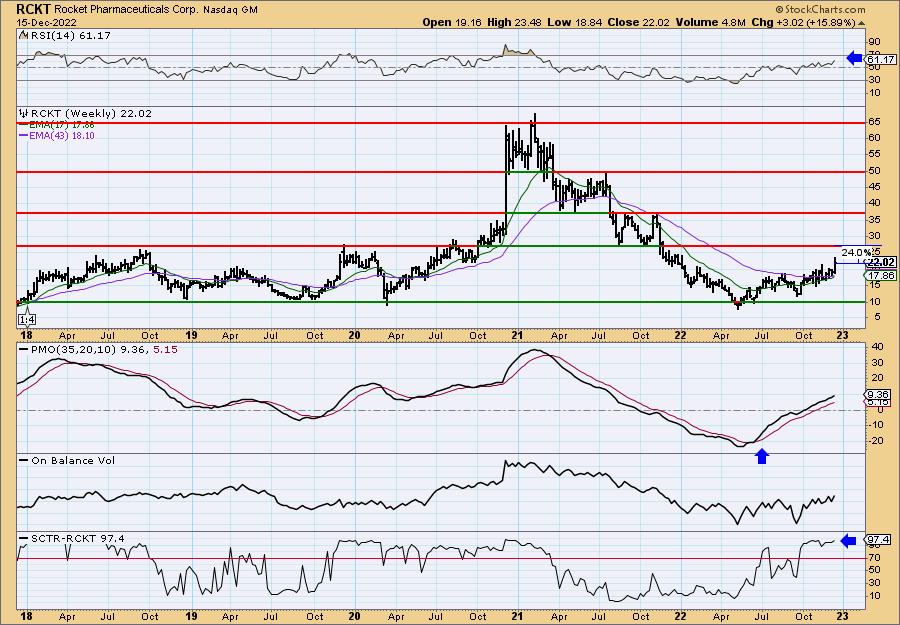
It's a great looking weekly chart. The weekly RSI is positive and rising and the weekly PMO is on an oversold crossover BUY signal and rising. The SCTR is excellent at 97.4%. The price pattern is bullish too with a cup-shaped or even reverse head and shoulders. If it makes it to the next level of overhead resistance it should be a 24% gain.
Yext, Inc. (YEXT)
EARNINGS: 03/07/2023 (AMC)
Yext, Inc. is an emerging growth company engaged in software development. It offers a cloud-based digital knowledge platform, which allows businesses to manage their digital knowledge in the cloud such as financial information, resources and performance of these resources on a consolidated basis and sync it to other application such as Apple Maps, Bing, Cortana, Facebook, Google, Google Maps, Instagram, Siri, and Yelp. It offers the Yext Knowledge Engine package on a subscription basis, which has an access to Listings, Pages, Reviews and other features. The Listing feature provides customers with control over their digital presence, including their location and other related attributes published on the used third-party applications. The Pages feature allows customers to establish landing pages on their own websites and to manage digital content on those sites, including calls to action. The Reviews presence enables customers to encourage and facilitate reviews from end consumers. The company was founded by Howard Lerman, Brent Metz, and Brian Distelburger in 2006 and is headquartered in New York, NY.
Predefined Scans Triggered: Hollow Red Candles, P&F Double Top Breakout, P&F Triple Top Breakout and Bullish 50/200-day MA Crossovers.
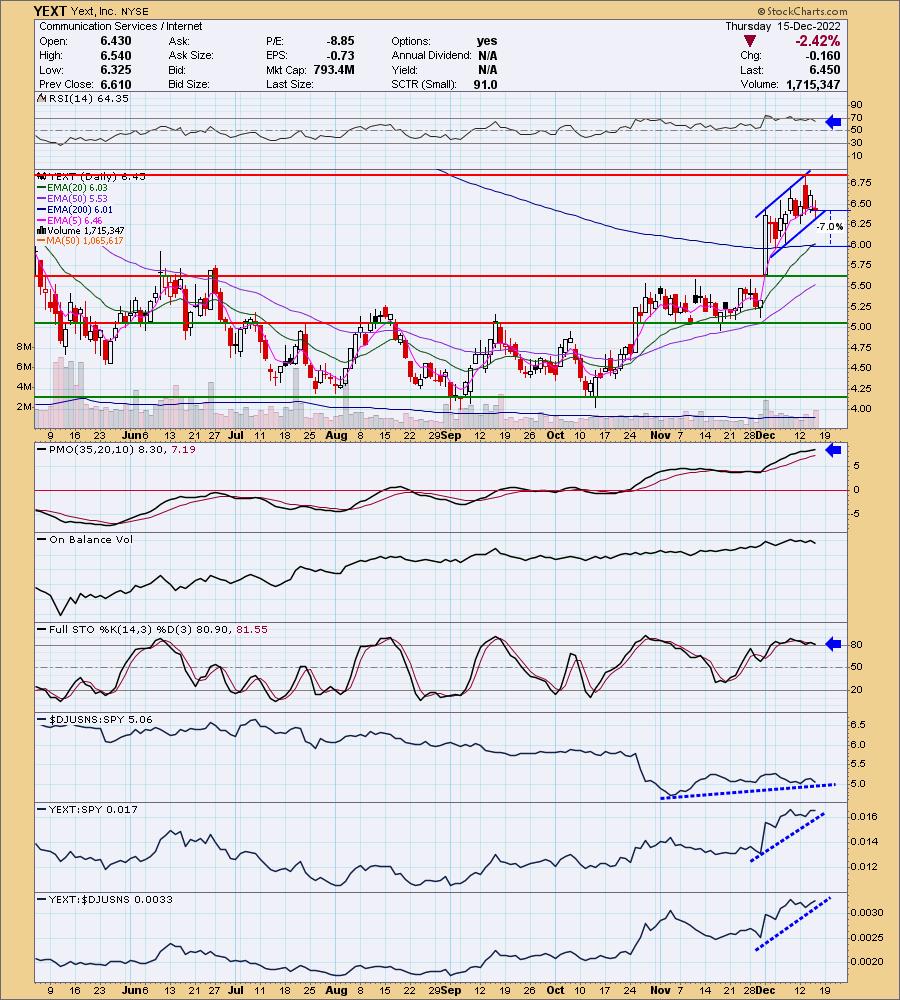
YEXT is unchanged in after hours trading. This one I have reservations about. Here are the reasons. While price is in a rising trend channel, it is on a flagpole. Rising flags tend to break down. Other than that, the chart is pretty good. We have a positive RSI and rising PMO (although it is on the overbought side). Stochastics are looking toppy, but remain over 80 so it's forgivable. Relative strength is very good against the group and the SPY. The group itself is in a rising relative trend over the past two months, but the trend is down this month. This one wouldn't necessarily be a "Diamond in the Rough", but as I said it does have merit.
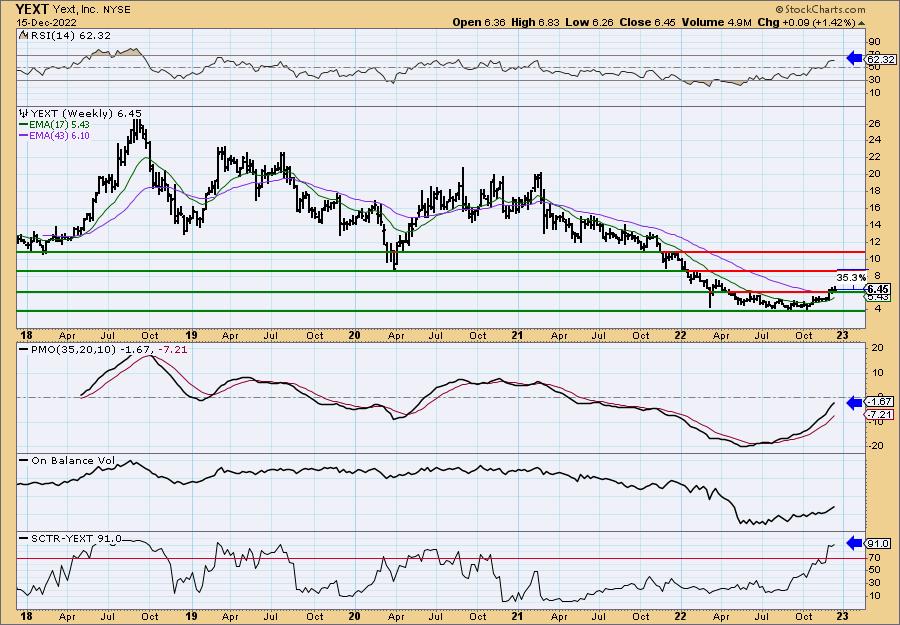
The weekly chart helped me determine this was certainly presentable and viable. There is a nice cup shaped low and price is above long-term resistance. Price also overcame the 43-week EMA on this rally. The OBV is confirming with a rising trend. In fact, prior to this rising trend the OBV held a positive divergence with price, falling price lows and rising OBV lows. Upside potential is excellent should it continue on to the next level of overhead resistance.
Don't forget, on Thursdays I look at reader-requested symbols, click HERE to send me an email. I read every email I receive and try to answer them all!
Current Market Outlook:
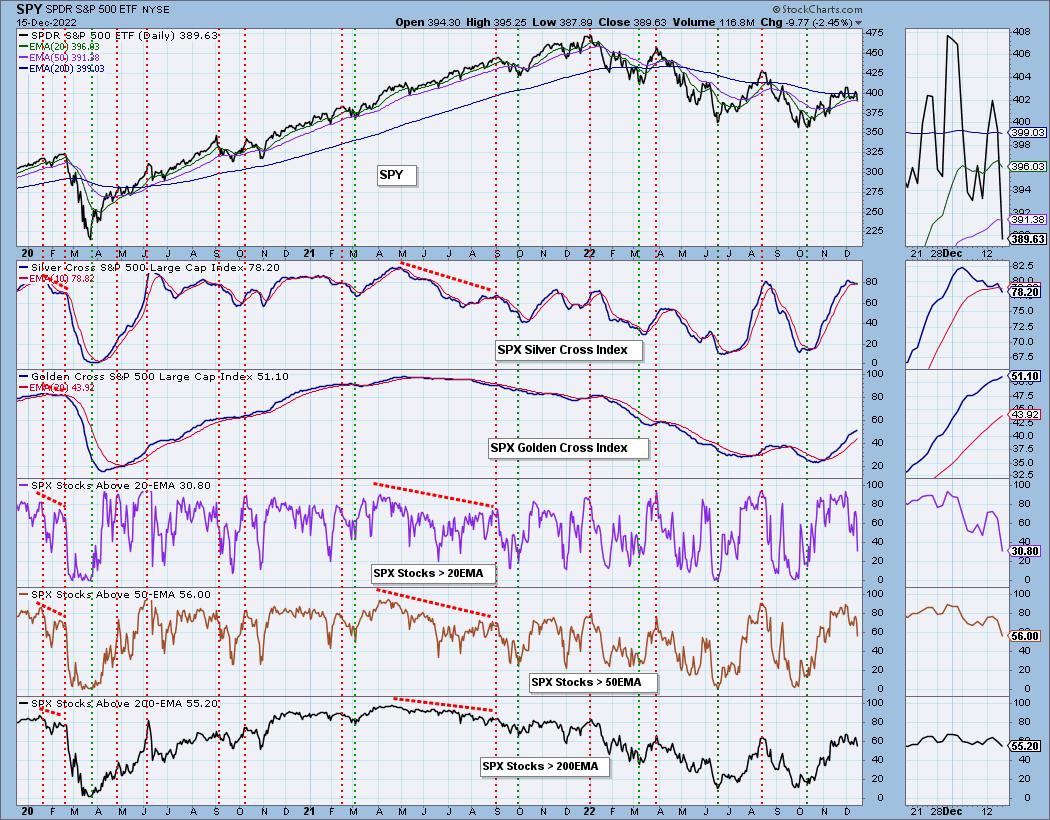
Market Environment: It is important to consider the odds for success by assessing the market tides. The following chart uses different methodologies for objectively showing the depth and trend of participation for intermediate- and long-term time frames.
- The Silver Cross Index (SCI) shows the percentage of SPX stocks on IT Trend Model BUY signals (20-EMA > 50-EMA)
- The Golden Cross Index (GCI) shows the percentage of SPX stocks on LT Trend Model BUY signals (50-EMA > 200-EMA)
Don't forget that as a "Diamonds" member, you have access to our GCI/SCI curated ChartList on DecisionPoint.com. You'll find it under "Members Only" links on the left side on the Blogs and Links Page.
Here is the current chart:
Full Disclosure: I am 12% exposed with a 5% hedge.
I'm required to disclose if I currently own a stock I mention and/or may buy/short it within the next 72 hours.
"Technical Analysis is a windsock, not a crystal ball." - Carl Swenlin
(c) Copyright 2022 DecisionPoint.com
Watch the latest episode of DecisionPoint with Carl & Erin Swenlin on Mondays 7:00p EST or on the DecisionPoint playlist on the StockCharts TV YouTube channel here!
NOTE: The stocks reported herein are from mechanical trading model scans that are based upon moving average relationships, momentum and volume. DecisionPoint analysis is then applied to get five selections from the scans. The selections given should prompt readers to do a chart review using their own analysis process. This letter is not a call for a specific action to buy, sell or short any of the stocks provided. There are NO sure things or guaranteed returns on the daily selection of "Diamonds in the Rough."
Regarding BUY/SELL Signals: The signal status reported herein is based upon mechanical trading model signals and crossovers. They define the implied bias of the price index/stock based upon moving average relationships and momentum, but they do not necessarily call for a specific action. They are information flags that should prompt chart review. Further, they do not call for continuous buying or selling during the life of the signal. For example, a BUY signal will probably (but not necessarily) return the best results if action is taken soon after the signal is generated. Additional opportunities for buying may be found as price zigzags higher, but the trader must look for optimum entry points. Conversely, exit points to preserve gains (or minimize losses) may be evident before the model mechanically closes the signal.
Helpful DecisionPoint Links:
DecisionPoint Shared ChartList and DecisionPoint Chart Gallery
Price Momentum Oscillator (PMO)
Swenlin Trading Oscillators (STO-B and STO-V)
For more links, go to DecisionPoint.com