
My scans were rather dry on the buy side today with only a handful of stocks. The short side saw 62 results from the Diamond Dog Scan. This is a characteristic of a bear market. An ETF popped up using Carl's Scan and it is timely.
One theme I'm seeing is Bonds and Yields. Carl and I believe the correction in interest rates is about over. The ETF I brought to the table is the Ultrashort 20+ Year Treasuries (TTT). An alternative that I'll likely present tomorrow is the Interest Rate Hedge ETF (PFIX) as it is not leveraged like TTT; it rises with interest rates.
I was happy to see TTT in the scan results of "Carl's Scan". The scan was developed by me as I sat beside my Dad and asked him what are the characteristics of a good buy? He provided guidance so I could build the scan. It seeks out beatdown stocks/ETFs that are beginning to show signs of recovery. The scan isn't always productive, but today it definitely was as it brought TTT to the table.
Good Luck & Good Trading!
Erin
Today's "Diamonds in the Rough": GTN (Short), NETI and TTT.
Other requests: ENSG, AVO, TK, ARLP and CABO (Short).

RECORDING LINK (12/16/2022):
Topic: DecisionPoint Diamond Mine (12/16/2022) LIVE Trading Room
Start Time: Dec 16, 2022 09:00 AM
Recording Link HERE
Passcode: Dec#16th
REGISTRATION for 12/23/2022:
When: Dec 23, 2022 09:00 AM Pacific Time (US and Canada)
Topic: DecisionPoint Diamond Mine (12/23/2022) LIVE Trading Room
Register in advance for this webinar HERE
After registering, you will receive a confirmation email containing information about joining the webinar.

Here is the last recording:
Welcome to DecisionPoint Diamonds, wherein I highlight ten "Diamonds in the Rough" per week. These are selected from the results of my DecisionPoint Scans which search for stocks that could benefit from the trend and condition of the market. Remember, these are not recommendations to buy or sell, but are the most interesting of the stocks that surfaced in my scans. My objective is to save you the work of the initial, tedious culling process, but you need to apply your own analysis to see if these stocks pique your interest as well. There are no guaranteed winners here!
"Predefined Scans Triggered" are taken from StockCharts.com using the "Symbol Summary" option instead of a "SharpChart" on the workbench.
Gray Television, Inc. (GTN)
EARNINGS: 02/24/2023 (BMO)
Gray Television, Inc. is a television broadcasting company, which engages in owning and operating television stations and digital assets in markets throughout the United States. It operates through the following segments: Broadcasting, and Production Companies. The Broadcasting segment operates television stations located across local markets in the United States. The firm's segment includes the production of television and event content. The company was founded in January 1897 and is headquartered in Atlanta, GA.
Predefined Scans Triggered: Moved Below Lower Price Channel.
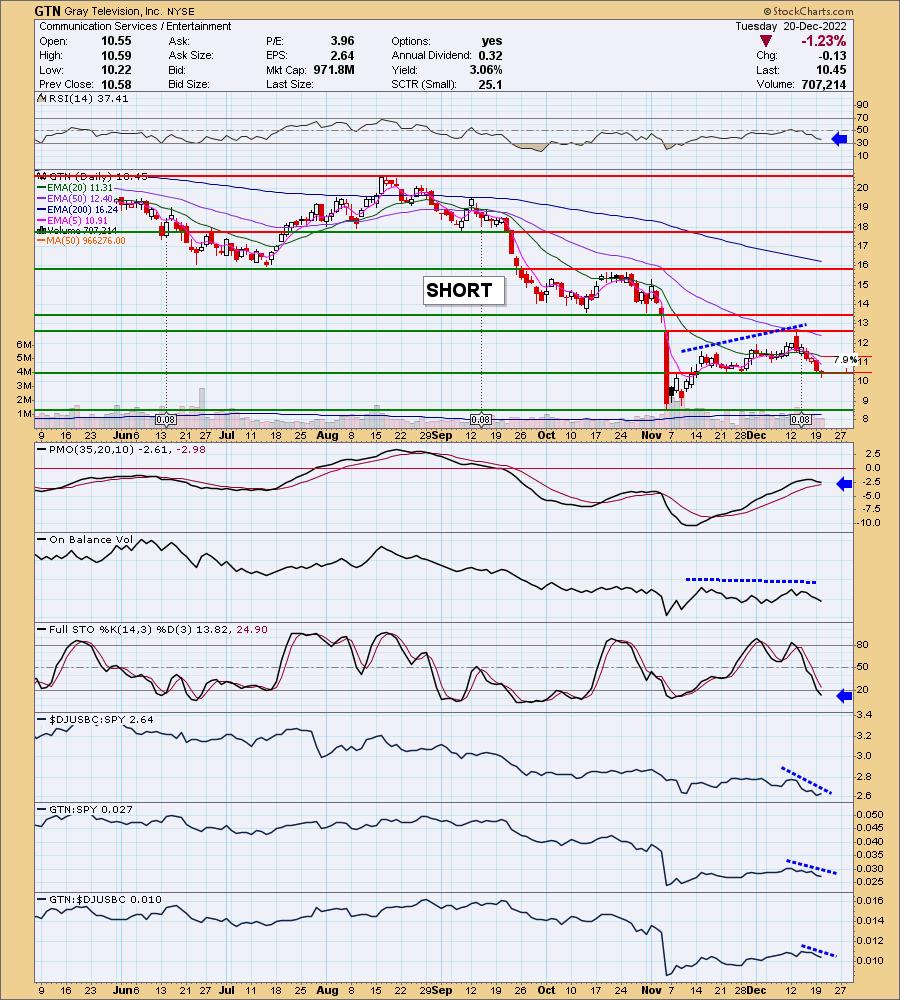
GTN is unchanged in after hours trading. I really wanted to find one that had already broken support. This one is half and half. It dropped below support, but then closed on it. This could be a bullish hammer candlestick, but the indicators are pretty bleak. You'll have time before you buy it to see it breakdown. If it doesn't keep it on the watchlist for later. Remember this one is a short, so we want bearish conditions and an upside stop level. The RSI is negative and the PMO has topped well beneath the zero line. It should trigger a SELL signal shortly. There is a negative OBV divergence as OBV tops are declining and price tops are rising. Stochastics are terrible and moving lower. Relative strength is failing in the near term. The stop is set below the 20-day EMA at 7.9% or $11.28.
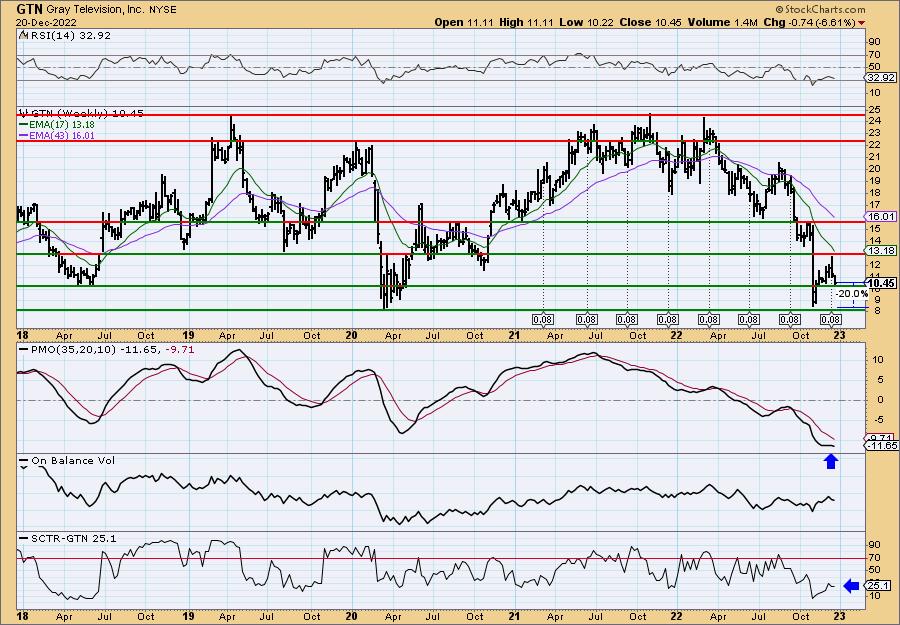
The weekly chart is excellent for a short with the exception that support hasn't quite been lost. The rising trend certainly has and the weekly PMO is topping beneath the signal line. The RSI is very negative and the SCTR is a lowly 25.1%. This may not be the most bearish chart you've ever seen, but it is early. Should the breakdown occur and it reaches the next level of support, that would be a 20% gain.
Eneti Inc. (NETI)
EARNINGS: 02/01/2023 (BMO)
Eneti, Inc. is focused on the offshore wind and marine-based renewable energy industry and has invested in the next generation of wind turbine installation vessels. It provides innovative maritime solutions to a wide variety of customers across the globe, safeguarding the environment, embracing sustainable business practices and generating risk-adjusted returns throughout the industry cycle. The company was founded by Emanuele A. Lauro and Robert L. Bugbee on March 20, 2013 and is headquartered in Monaco.
Predefined Scans Triggered: Elder Bar Turned Green, New CCI Buy Signals, New 52-week Highs, Moved Above Upper Bollinger Band, Stocks in a New Uptrend (Aroon), Moved Above Upper Price Channel, Parabolic SAR Buy Signals, P&F Ascending Triple Top Breakout and P&F Double Top Breakout.
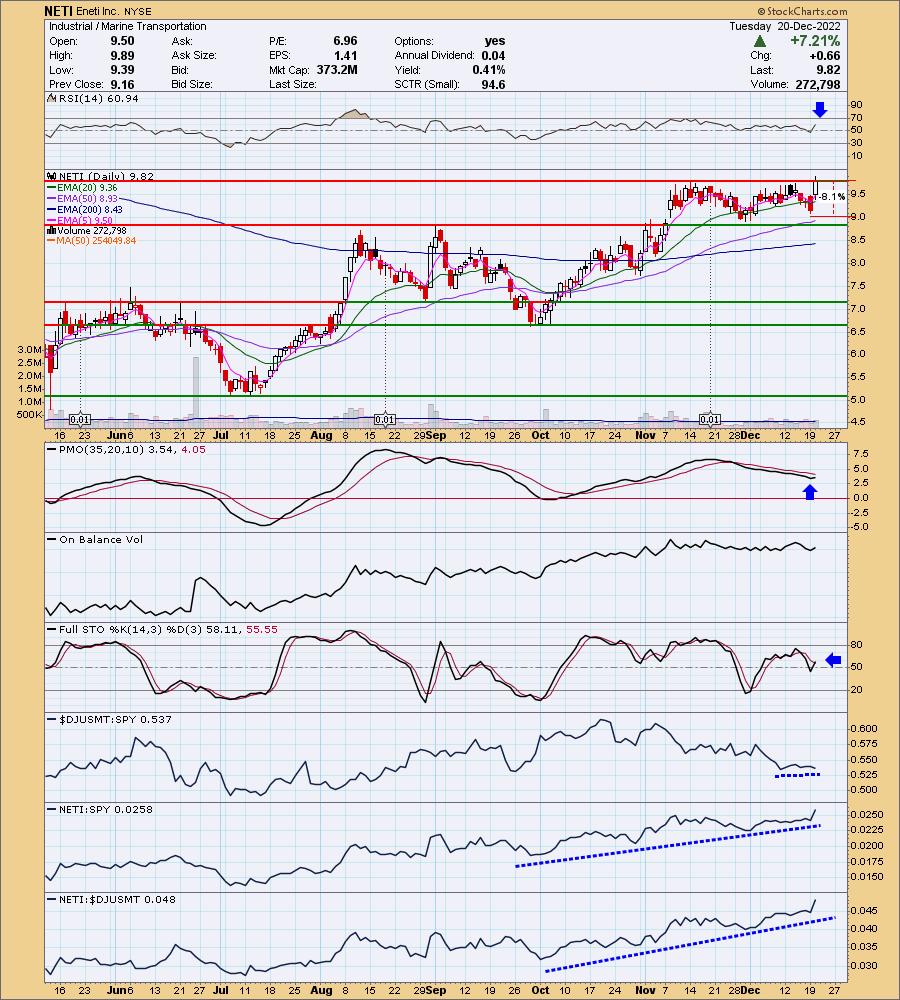
NETI is up +1.53% in after hours trading. This stock probably triggered the most predefined scans I've seen since doing Diamonds. It seems this stock is likely on a lot of radars depending on what your analysis process is. It had a breakout day and apparently based on after hours trading, that will continue tomorrow. The RSI is positive and not overbought. The PMO has just bottomed. Stochastics are rising again. The group isn't too great against the SPY, but NETI is clearly outperforming the group and consequently the SPY. The only possible issue is that we are getting what looks like a "pig's ear" pattern. It's one that Carl coined. It means you have consolidation at a top and then a false breakout/bull trap on a quick pop and drop. Given after hours follow-through, I think that's fine. There was a bearish double-top pattern and this breakout busted it. A bullish conclusion to a bearish chart pattern is especially bullish. The stop is set below the short-term support from yesterday at 8.1% or $9.02.
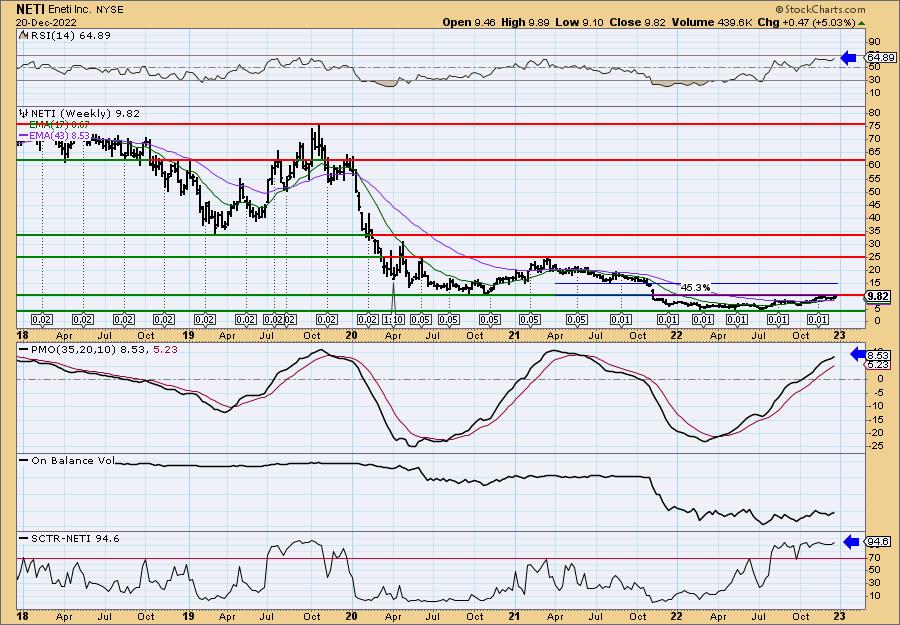
This one took a bath in 2020 and really never recovered. It is now beginning to wake up. A breakout right now would put it back in its prior trading range. The weekly RSI is positive and not overbought. The weekly PMO is rising, but is getting on the overbought side. The SCTR is an excellent 94.6%. Upside potential if it reaches the 2021 3rd quarter low is 45.3%.
ProShares UltraPro Short 20+ Year Treasury (TTT)
EARNINGS: N/A
TTT provides 3x inverse exposure, reset daily, to a market-value-weighted index that tracks the performance of US Treasury securities with remaining maturities greater than 20 years. Click HERE for more information.
Predefined Scans Triggered: Gap Ups, Filled Black Candles, Runaway Gap Ups and P&F Double Top Breakout.
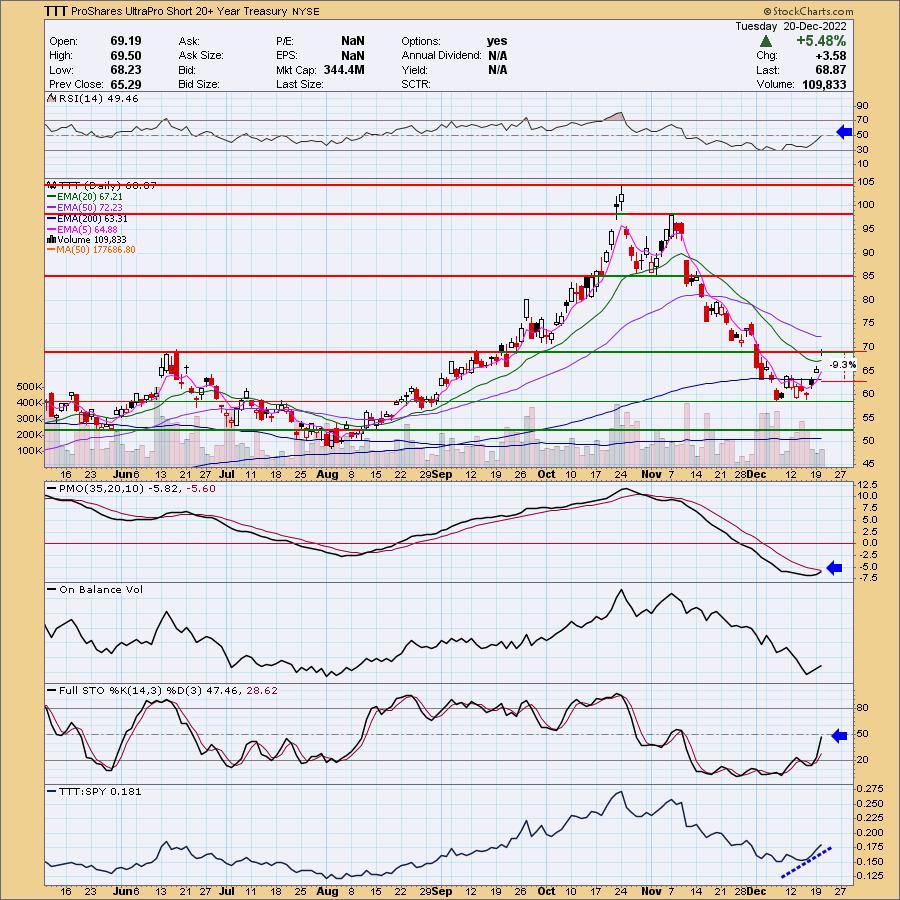
TTT is up +2.18% in after hours trading. This is likely going to be an excellent hedge. Just remember this is a "juiced" or leveraged ETF that gives you 3x exposure on the inverse of TLT basically. You don't need to sink too much into it based on that volatility. If you like volatility and can take downswings of 8% then position size as you wish. We have a double-bottom that was confirmed on yesterday's breakout. Today it nearly overcame resistance at the June high. The RSI is about to turn positive, the PMO is ready for a crossover BUY signal in oversold territory. Stochastics are rising vertically and relative strength is picking up against the SPY. The stop is at 9.3% due to the volatility of this ETF around $62.46.
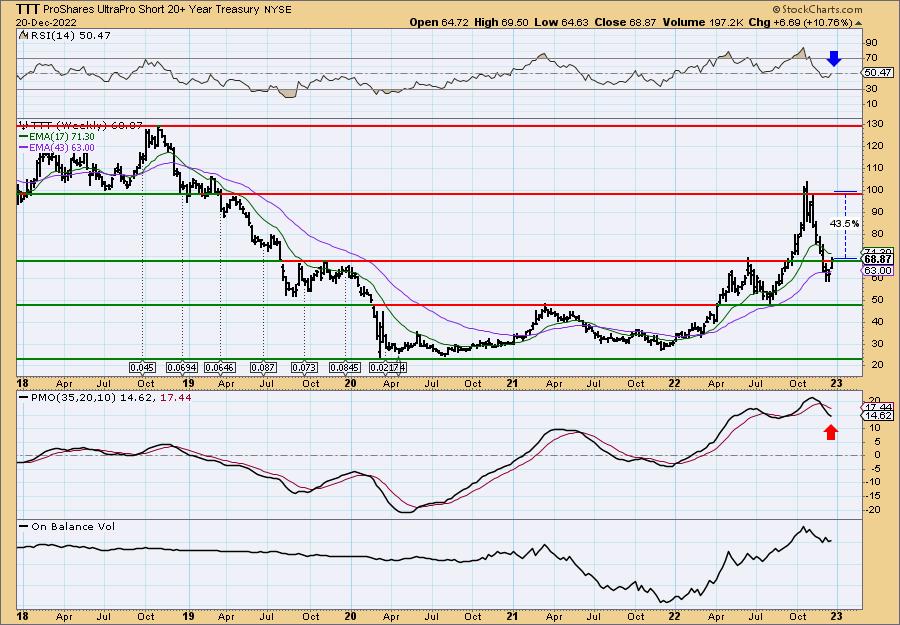
The weekly chart adjusts the resistance line based on the 2019 tops. Currently price has broken above that level. The weekly RSI is rising and back in positive territory. The weekly PMO doesn't look great, but we sense this is it for the Bonds rally. The upside target of this ETF is over 43%.
Don't forget, on Thursdays I look at reader-requested symbols, click HERE to send me an email. I read every email I receive and try to answer them all!
Current Market Outlook:
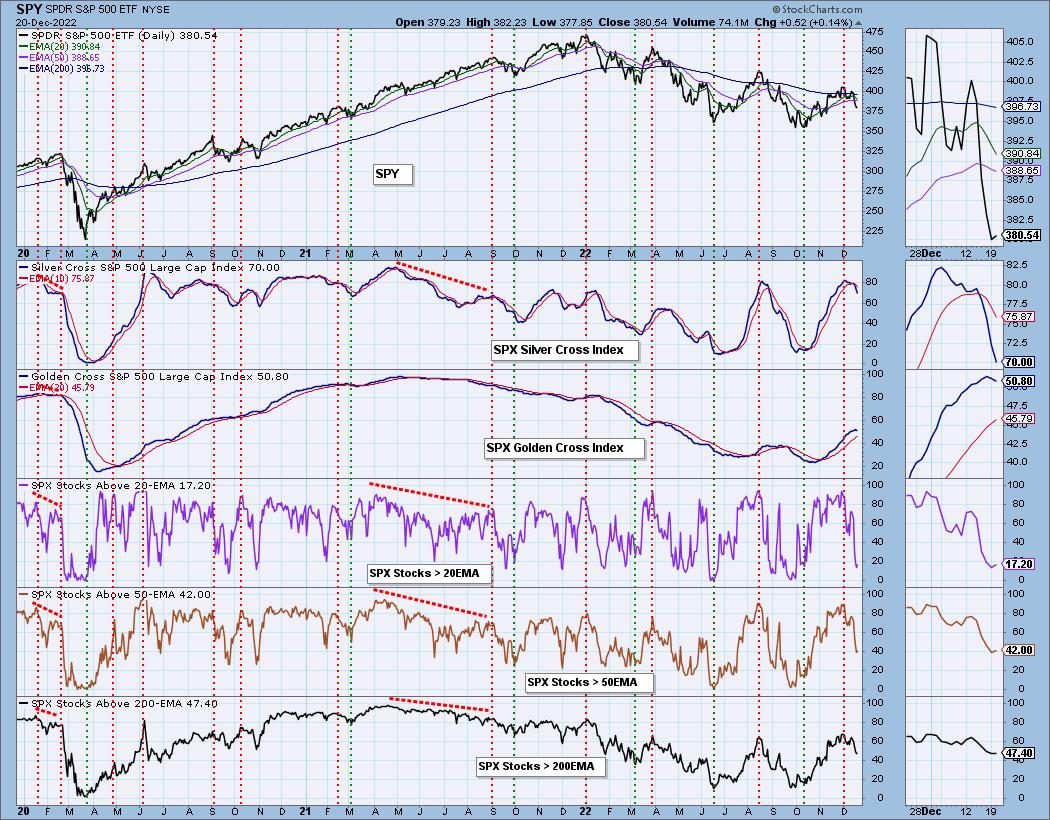
Market Environment: It is important to consider the odds for success by assessing the market tides. The following chart uses different methodologies for objectively showing the depth and trend of participation for intermediate- and long-term time frames.
- The Silver Cross Index (SCI) shows the percentage of SPX stocks on IT Trend Model BUY signals (20-EMA > 50-EMA)
- The Golden Cross Index (GCI) shows the percentage of SPX stocks on LT Trend Model BUY signals (50-EMA > 200-EMA)
Don't forget that as a "Diamonds" member, you have access to our GCI/SCI curated ChartList on DecisionPoint.com. You'll find it under "Members Only" links on the left side on the Blogs and Links Page.
Here is the current chart:
Full Disclosure: I am 12% exposed with a 5% hedge. Likely to add TTT next week if it appears Carl and I are right about interest rates rallying further.
I'm required to disclose if I currently own a stock I mention and/or may buy/short it within the next 72 hours.
"Technical Analysis is a windsock, not a crystal ball." - Carl Swenlin
(c) Copyright 2022 DecisionPoint.com
Watch the latest episode of DecisionPoint with Carl & Erin Swenlin on Mondays 7:00p EST or on the DecisionPoint playlist on the StockCharts TV YouTube channel here!
NOTE: The stocks reported herein are from mechanical trading model scans that are based upon moving average relationships, momentum and volume. DecisionPoint analysis is then applied to get five selections from the scans. The selections given should prompt readers to do a chart review using their own analysis process. This letter is not a call for a specific action to buy, sell or short any of the stocks provided. There are NO sure things or guaranteed returns on the daily selection of "Diamonds in the Rough."
Regarding BUY/SELL Signals: The signal status reported herein is based upon mechanical trading model signals and crossovers. They define the implied bias of the price index/stock based upon moving average relationships and momentum, but they do not necessarily call for a specific action. They are information flags that should prompt chart review. Further, they do not call for continuous buying or selling during the life of the signal. For example, a BUY signal will probably (but not necessarily) return the best results if action is taken soon after the signal is generated. Additional opportunities for buying may be found as price zigzags higher, but the trader must look for optimum entry points. Conversely, exit points to preserve gains (or minimize losses) may be evident before the model mechanically closes the signal.
Helpful DecisionPoint Links:
DecisionPoint Shared ChartList and DecisionPoint Chart Gallery
Price Momentum Oscillator (PMO)
Swenlin Trading Oscillators (STO-B and STO-V)
For more links, go to DecisionPoint.com