
Since the bear market began this year in earnest, I haven't seen that many weekly charts that have promise. It makes sense. If the majority of the market is trading lower, the weekly charts will continue to break down. I pick my "Diamonds in the Rough" based on the daily charts. I add the weekly charts here so that you have an idea as to whether the investment could be considered longer-term. It also gives us context regarding any bullish moves on the daily charts.
Today I was pleasantly surprised as nearly all of the weekly charts looked excellent. This means these choices may not require the kind of babysitting we've had to do in this market environment. I will likely add some of these to my portfolio.
Materials was the big theme today with the sector blowing the others away. Friday's "Sector to Watch" is cooking! I mentioned two of today's "Diamonds in the Rough" as possibilities going into this week as they are all in the the Nonferrous Metals group which was the "Industry Group to Watch". They've performed admirably and have more upside potential.
I've already gotten a handful of reader requests to go over for Thursday. Send yours along before Thursday Noon ET for possible inclusion.
Good Luck & Good Trading!
Erin
Today's "Diamonds in the Rough": FCX, MAG and SCCO.
Runner-ups: MTB, AMKBY, DLNG, FLNG, DT, ICUI, PEN, TROX and PLG.

TODAY'S RECORDING LINK (11/4/2022):
Topic: DecisionPoint Diamond Mine (11/4/2022) LIVE Trading Room
Start Time: Nov 4, 2022 09:00 AM
Recording Link HERE
Passcode: November*4
NEXT DIAMOND MINE Trading Room on November 11th 2022:
When: Nov 11, 2022 09:00 AM Pacific Time (US and Canada)
Topic: DecisionPoint Diamond Mine (11/11/2022) LIVE Trading Room
Register in advance for this webinar HERE
After registering, you will receive a confirmation email containing information about joining the webinar.

Here is the last recording:
Welcome to DecisionPoint Diamonds, wherein I highlight ten "Diamonds in the Rough" per week. These are selected from the results of my DecisionPoint Scans which search for stocks that could benefit from the trend and condition of the market. Remember, these are not recommendations to buy or sell, but are the most interesting of the stocks that surfaced in my scans. My objective is to save you the work of the initial, tedious culling process, but you need to apply your own analysis to see if these stocks pique your interest as well. There are no guaranteed winners here!
"Predefined Scans Triggered" are taken from StockCharts.com using the "Symbol Summary" option instead of a "SharpChart" on the workbench.
Freeport-McMoRan, Inc. (FCX)
EARNINGS: 01/26/2023 (BMO)
Freeport-McMoRan, Inc. engages in the mining of copper, gold, and molybdenum. It operates through the following segments: North America Copper Mines, South America Mining, Indonesia Mining, Molybdenum Mines, Rod and Refining, Atlantic Copper Smelting and Refining and Corporate, Other and Eliminations. The North America Copper Mines segment operates open-pit copper mines in Morenci, Baghdad, Safford, Sierrita, and Miami in Arizona and Chino and Tyrone in New Mexico. The South America Mining segment includes Cerro Verde in Peru and El Abra in Chile. The Indonesia Mining segment handles the operations of Grasberg minerals district that produce copper concentrate containing significant quantities of gold and silver. The Molybdenum Mines segment includes the Henderson underground mine and Climax open pit mine, both in Colorado. The Rod and Refining segment consists of copper conversion facilities located in North America and includes a refinery, rod mills, and a specialty copper products facility. The Atlantic Copper Smelting and Refining segment smelts and refines copper concentrate and markets refined copper and precious metals in slimes. The Corporate, Other and Eliminations segment consists of other mining and eliminations, oil and gas operations and other corporate and elimination items. The company was founded by James R. Moffett on November 10, 1987, and is headquartered in Phoenix, AZ.
Predefined Scans Triggered: P&F Double Top Breakout
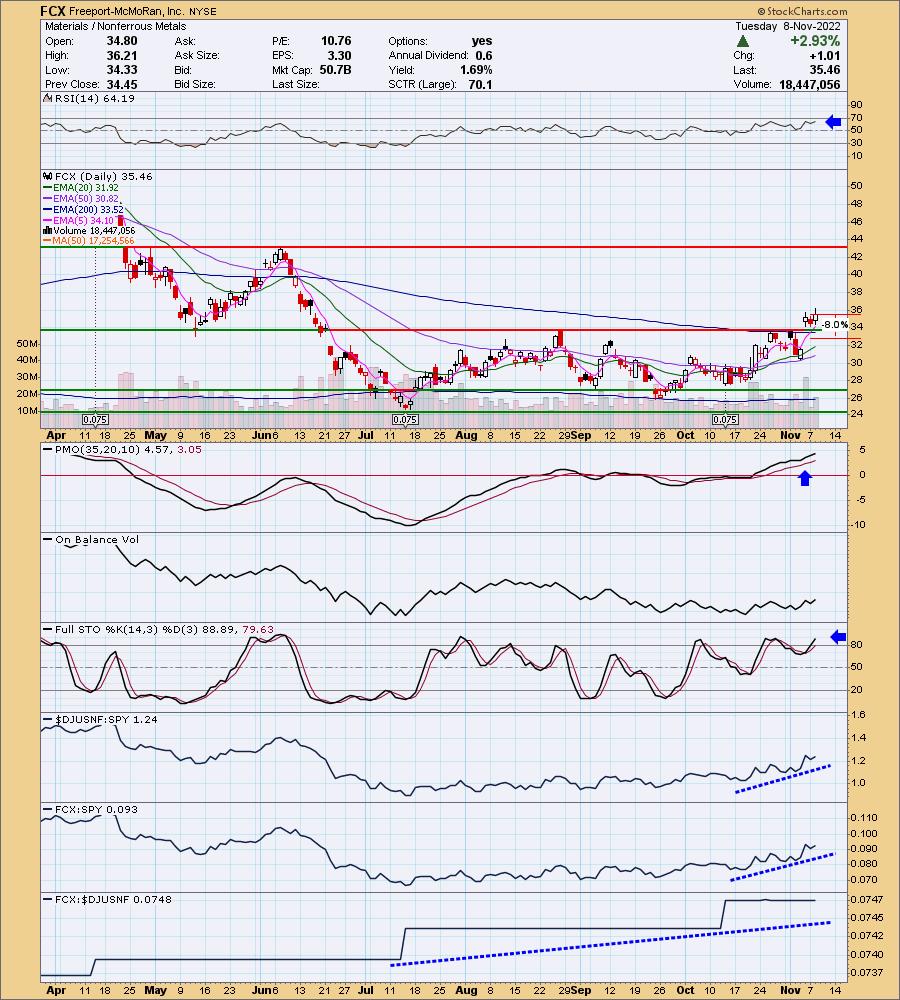
FCX is up +0.11% in after hours trading. This was one I mentioned in Friday's Diamonds Recap. I believe it deserves the title "Diamond in the Rough". Price gapped up on Friday above strong resistance, now support, at the 200-day EMA and May Low/August top. It spent yesterday digesting the move and today it is back off to the races. The RSI is positive and the PMO is rising nicely. It appears overbought, but the bottom of the range is closer to -8 or -10 which means the top of the range is +8 or +10. Stochastics are back above 80 and relative strength of the group and FCX against the SPY is rising. I'm checking on why FCX to its industry group looks so weird, but overall its a rising trend so I'll go with it. The stop is below the 200-day EMA plus some around 8% or $32.62. I'd like to use gap support but it is too far away.
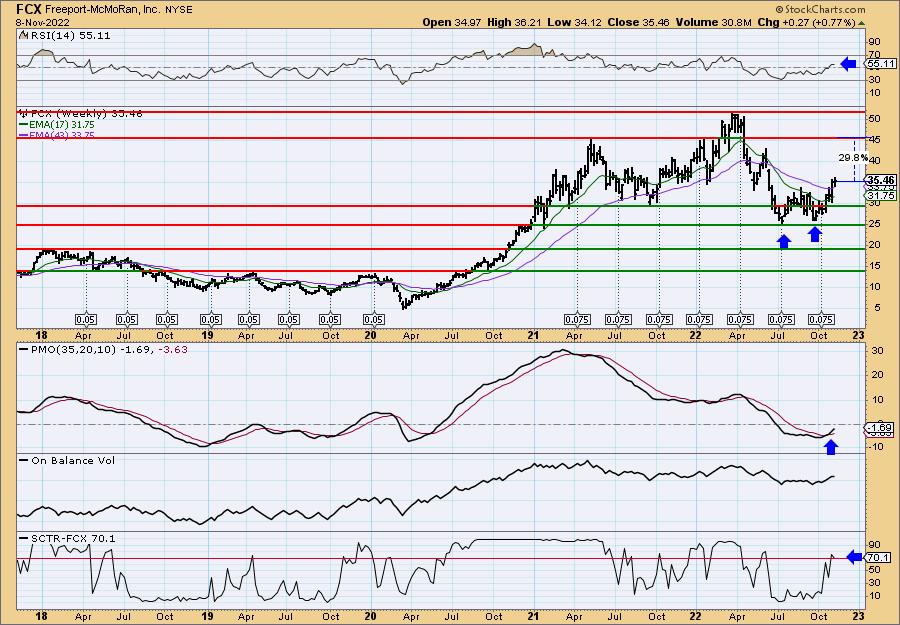
The weekly chart sports a large double-bottom formation that was confirmed last week. The minimum upside target of the pattern (height of pattern added to confirmation line) is right at the June top. The weekly RSI is positive and not overbought. The weekly PMO is rising on an oversold crossover BUY signal. The SCTR just entered the "hot zone" above 70 (meaning it is in the top 30% of all large-cap stocks as far as trend and condition).
MAG Silver Corp. (MAG)
EARNINGS: 11/14/2022 ** REPORTS NEXT WEEK **
MAG Silver Corp. operates as a Canadian development and exploration company, which focuses on becoming a top-tier primary silver mining company by exploring and advancing high-grade, district scale, silver-dominant projects in the Americas. Its principal focus and asset is the Juanicipio Project (44%), being developed with Fresnillo Plc (56%), the Operator. The project is located in the Fresnillo Silver Trend in Mexico, the world's premier silver mining camp, where the Juanicipio shareholders are currently developing an underground mine and constructing a 4,000 tonnes per day processing plant. MAG is also exploring at the Deer Trail 100% earn-in project in Utah. The company was founded by Peter Kenneth McNeill Megaw, Frank R. Hallam and Michael R. Jones on April 21, 1999 and is headquartered in Vancouver, Canada.
Predefined Scans Triggered: Moved Above Upper Keltner Channel, Moved Above Upper Price Channel, P&F Double Top Breakout.
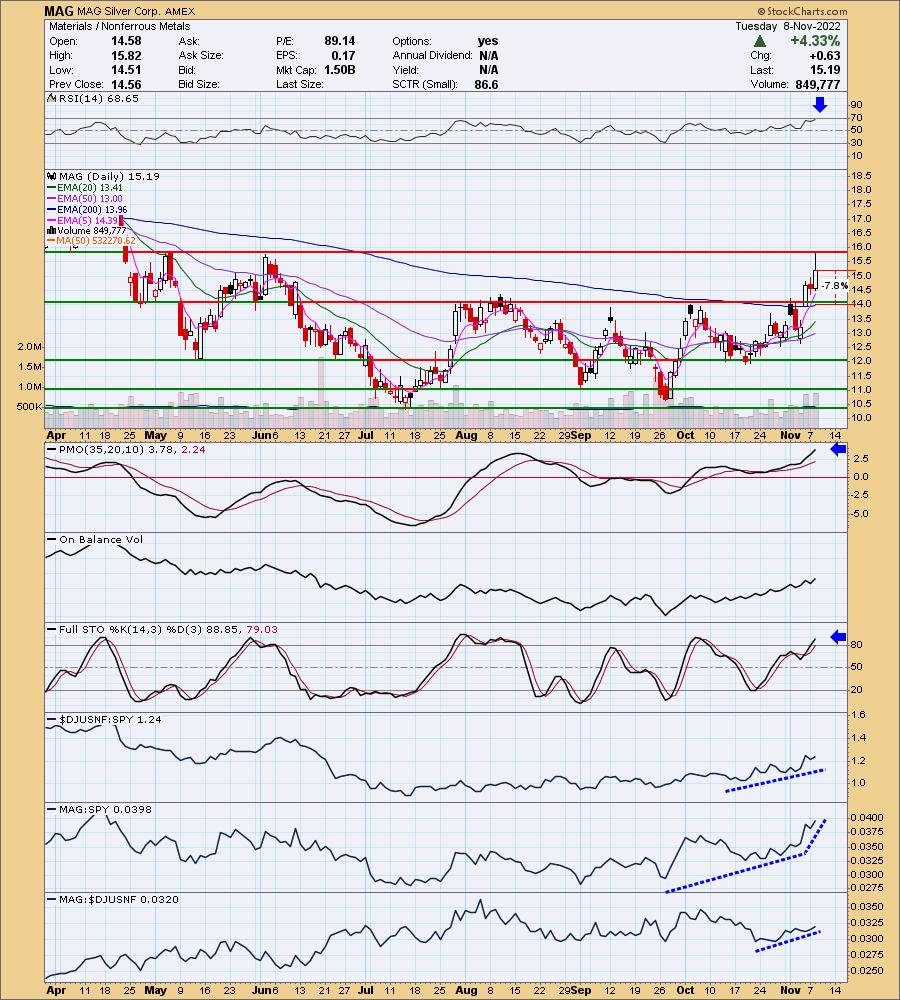
MAG is down -1.25% in after hours trading. It may be taking back some of today's gains. I still love the chart given the positive and rising RSI, the strong rising trend combined with a gap up breakout last Friday and accelerating PMO. Stochastics are also above 80 and relative strength is rising against the group and the SPY. It was turned away at overhead resistance today so it may need another digestion day before it attempts it again. The stop is set below the 200-day EMA and May/June tops at 7.8% around $14.00.
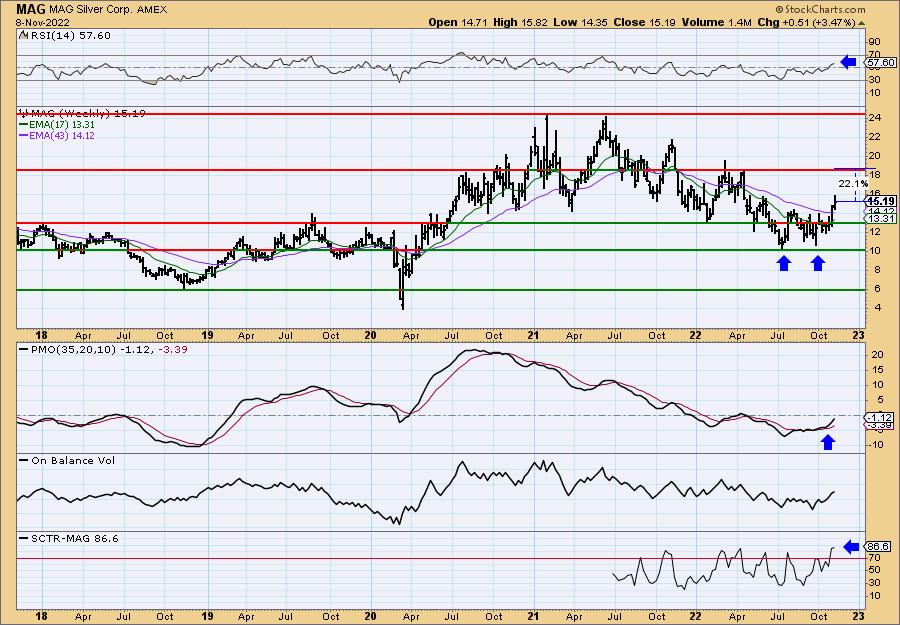
Another strong weekly chart for you. The weekly RSI is rising, positive and not overbought. The weekly PMO is accelerating higher after a crossover BUY signal. The SCTR is very high at 86.6%. Upside potential is about 22%+. It could move to $24, but the first step would be locking in that 22% gain.
Southern Copper Corp. (SCCO)
EARNINGS: 01/31/2023 (AMC)
Southern Copper Corp. engages in the development, production, and exploration of copper, molybdenum, zinc, and silver. It operates through the following segments: Peruvian Operations, Mexican Open-Pit Operations, and Mexican Underground Mining Operations. The Peruvian Operations segment focuses on the Toquepala and Cuajone mine complexes and the smelting and refining plants, industrial railroad, and port facilities that service both mines. The Mexican Open-Pit Operations segment comprises the La Caridad and Buenavista mine complexes, the smelting, and refining plants and support facilities, which service both mines. The Mexican Underground Mining Operations segment is involved in the operation of five underground mines, a coal mine, and several industrial processing facilities. The company was founded on December 12, 1952 and is headquartered in Phoenix, AZ.
Predefined Scans Triggered: Moved Above Upper Keltner Channel, Moved Above Upper Price Channel, P&F Ascending Triple Top Breakout and P&F Double Top Breakout.
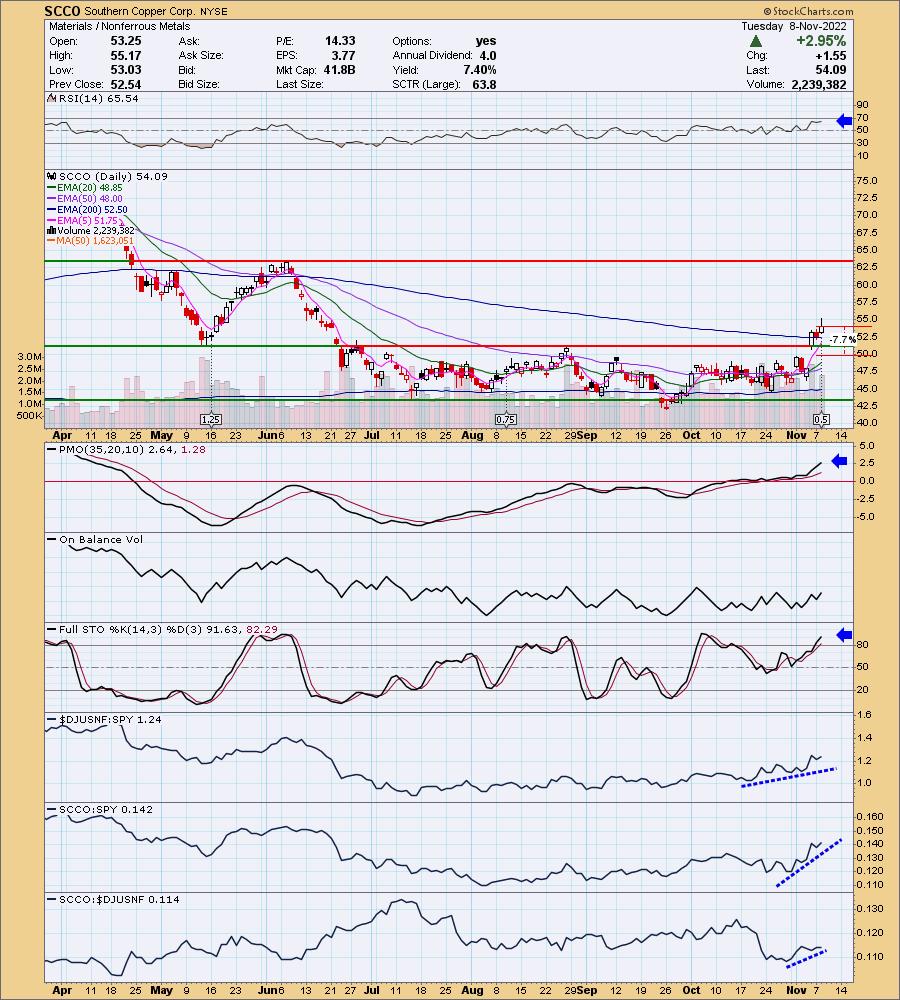
SCCO is unchanged in after hours trading. It shouldn't surprise you that all of these charts are similar, they come from the same industry group. Clearly Friday was an awesome day for this group given all the gap ups I'm seeing on these charts. SCCO also has overcome resistance at the 200-day EMA. The RSI is positive and not overbought. The PMO is accelerating higher and is not overbought. Stochastics are above 80 and have been basically in positive territory above 50 since the beginning of October. Relative strength of the group and SCCO against the SPY has been steadily rising with SCCO beginning to show some outperformance against the group. The stop is set below support at 7.7% around $49.92.
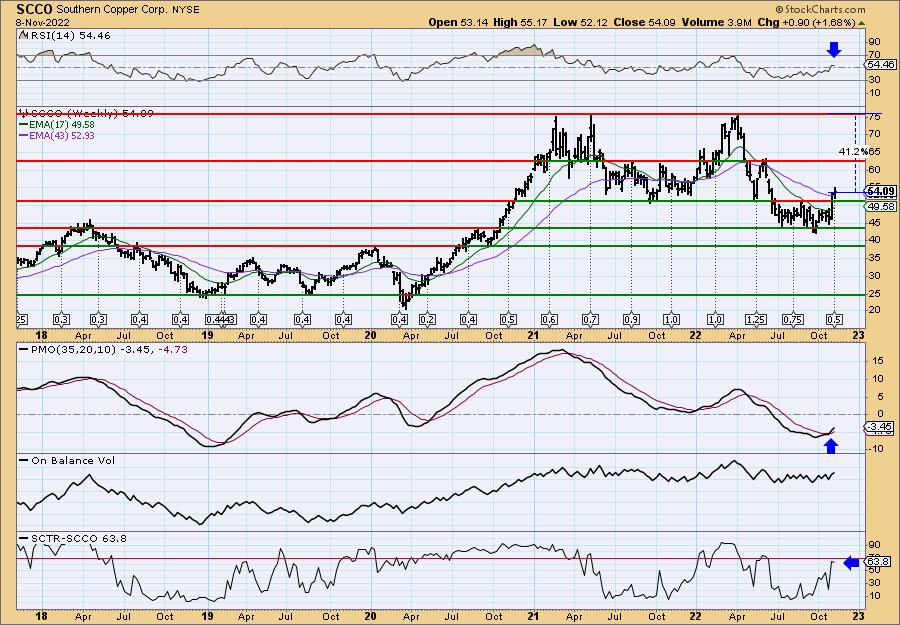
We don't have a double-bottom, but we do have a beautiful breakout from a tight trading range and the 43-week EMA. The weekly RSI just entered positive territory above net neutral (50). The weekly PMO recently triggered an oversold crossover BUY signal. The SCTR is below 70, but improved greatly last week on the big breakout. I don't know if SCCO will hit all-time highs again, but we would certainly see price test the $63 level which would be at least an 18% gain on the investment.
Don't forget, on Thursdays I look at reader-requested symbols, click HERE to send me an email. I read every email I receive and try to answer them all!
Current Market Outlook:
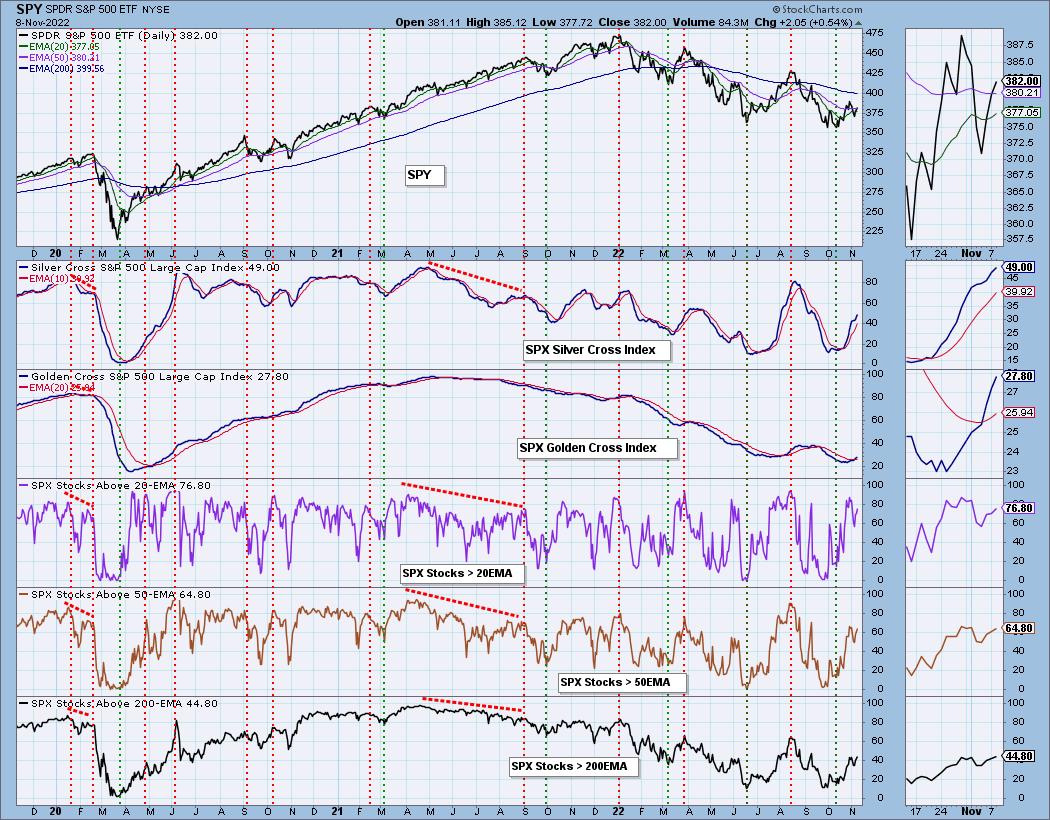
Market Environment: It is important to consider the odds for success by assessing the market tides. The following chart uses different methodologies for objectively showing the depth and trend of participation for intermediate- and long-term time frames.
- The Silver Cross Index (SCI) shows the percentage of SPX stocks on IT Trend Model BUY signals (20-EMA > 50-EMA)
- The Golden Cross Index (GCI) shows the percentage of SPX stocks on LT Trend Model BUY signals (50-EMA > 200-EMA)
Don't forget that as a "Diamonds" member, you have access to our GCI/SCI curated ChartList on DecisionPoint.com. You'll find it under "Members Only" links on the left side on the Blogs and Links Page.
Here is the current chart:
Full Disclosure: I am 50% exposed.
I'm required to disclose if I currently own a stock I mention and/or may buy/short it within the next 72 hours.
"Technical Analysis is a windsock, not a crystal ball." - Carl Swenlin
(c) Copyright 2022 DecisionPoint.com
Watch the latest episode of DecisionPoint with Carl & Erin Swenlin on Mondays 7:00p EST or on the DecisionPoint playlist on the StockCharts TV YouTube channel here!
NOTE: The stocks reported herein are from mechanical trading model scans that are based upon moving average relationships, momentum and volume. DecisionPoint analysis is then applied to get five selections from the scans. The selections given should prompt readers to do a chart review using their own analysis process. This letter is not a call for a specific action to buy, sell or short any of the stocks provided. There are NO sure things or guaranteed returns on the daily selection of "Diamonds in the Rough."
Regarding BUY/SELL Signals: The signal status reported herein is based upon mechanical trading model signals and crossovers. They define the implied bias of the price index/stock based upon moving average relationships and momentum, but they do not necessarily call for a specific action. They are information flags that should prompt chart review. Further, they do not call for continuous buying or selling during the life of the signal. For example, a BUY signal will probably (but not necessarily) return the best results if action is taken soon after the signal is generated. Additional opportunities for buying may be found as price zigzags higher, but the trader must look for optimum entry points. Conversely, exit points to preserve gains (or minimize losses) may be evident before the model mechanically closes the signal.
Helpful DecisionPoint Links:
DecisionPoint Shared ChartList and DecisionPoint Chart Gallery
Price Momentum Oscillator (PMO)
Swenlin Trading Oscillators (STO-B and STO-V)
For more links, go to DecisionPoint.com