
I really wasn't surprised that reader requests were a bit thin this week. Stock picking becomes quite tricky when the market begins to roll over as it is. I normally will not include my picks, but I felt that they looked better than some of the requests this week. Forgive me if your request wasn't picked, but I want to present stocks/ETFs that fit the "Diamond in the Rough" analysis process. I've listed the other picks we got so you can decide for yourself which look best to you. Always a good exercise for learning.
Backtesting on "Diamonds in the Rough" continues and reviewing the last three months, they are doing very well. I've always felt fairly confident in my picks, but since I don't go back, I didn't realize how well they tend to do overall. One test over the time period of November 2020 to about May 2021 showed that 50% were up at an average of 16% while the other 50% averaged -4%. Holy cow! I'll keep you apprised as we find out more.
Don't forget to register for tomorrow's Diamond Mine trading room! The registration link is below the Diamonds logo.
Good Luck & Good Trading!
Erin
Today's "Diamonds in the Rough": DECK, DRI, SEDG and TNP.
Other requests: STEM, ASRT, UNG, ASO, CPRT, HI and SLVM.

TODAY'S RECORDING LINK (11/11/2022):
Topic: DecisionPoint Diamond Mine (11/11/2022) LIVE Trading Room
Start Time: Nov 11, 2022 09:00 AM
Passcode: Nov*11th
NEXT DIAMOND MINE Trading Room on November 18th 2022:
When: Nov 18, 2022 09:00 AM Pacific Time (US and Canada)
Topic: DecisionPoint Diamond Mine (11/18/2022) LIVE Trading Room
Register in advance for this webinar HERE
After registering, you will receive a confirmation email containing information about joining the webinar.

Here is the last recording:
Welcome to DecisionPoint Diamonds, wherein I highlight ten "Diamonds in the Rough" per week. These are selected from the results of my DecisionPoint Scans which search for stocks that could benefit from the trend and condition of the market. Remember, these are not recommendations to buy or sell, but are the most interesting of the stocks that surfaced in my scans. My objective is to save you the work of the initial, tedious culling process, but you need to apply your own analysis to see if these stocks pique your interest as well. There are no guaranteed winners here!
"Predefined Scans Triggered" are taken from StockCharts.com using the "Symbol Summary" option instead of a "SharpChart" on the workbench.
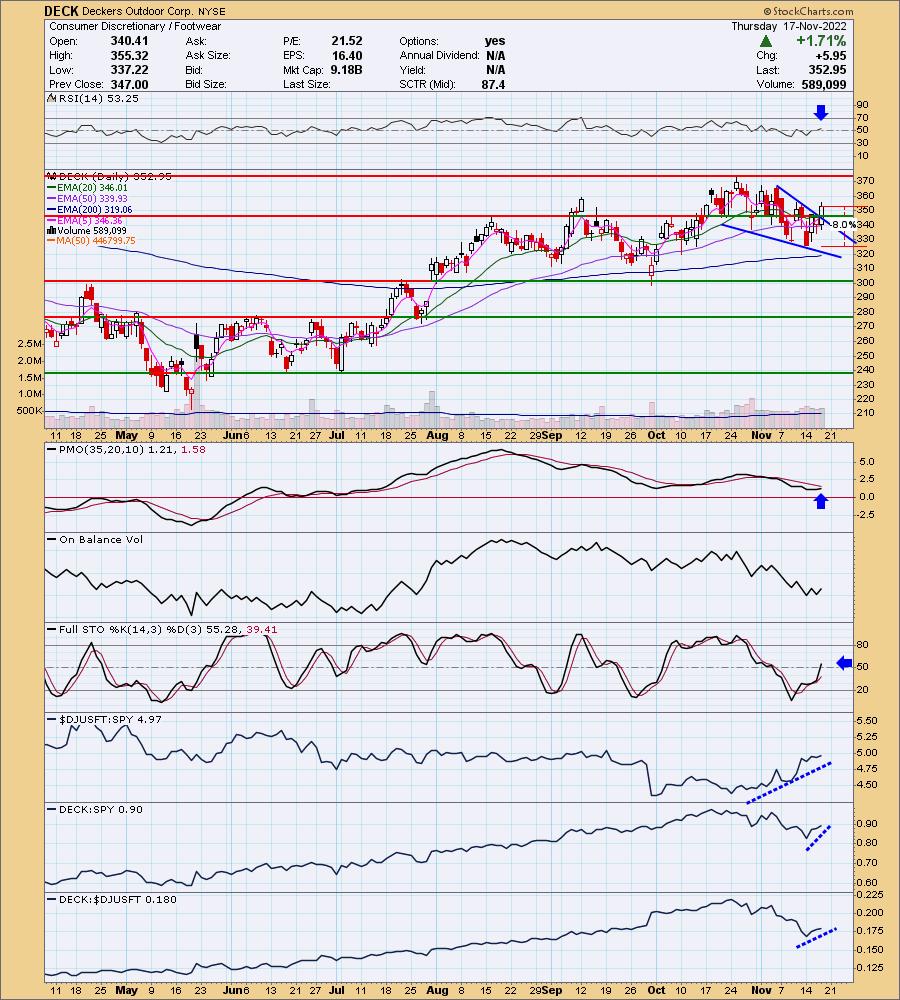
Deckers Outdoor Corp. (DECK)
EARNINGS: 02/02/2023 (AMC)
Deckers Outdoor Corp. engages in the business of designing, marketing, and distributing footwear, apparel, and accessories developed for both everyday casual lifestyle use and high performance activities. It operates through the following segments: UGG Brand, HOKA Brand, Teva Brand, Sanuk Brand, Other Brands, and Direct-to-Consumer. The UGG Brand segment offers a line of premium footwear, apparel, and accessories. The HOKA Brand segment sells footwear and apparel that offers enhanced cushioning and inherent stability with minimal weight, originally designed for ultra-runners. The Teva Brand segment focuses on the sport sandal and modern outdoor lifestyle category, such as sandals, shoes, and boots. The Sanuk Brand segment originated in Southern California surf culture and has emerged into a lifestyle brand with a presence in the relaxed casual shoe and sandal categories. The Other Brands segment includes the Koolaburra by UGG brand. The Direct-to-Consumer segment consists of retail stores and e-commerce websites. The company was founded by Douglas B. Otto in 1973 and is headquartered in Goleta, CA.
Predefined Scans Triggered: Parabolic SAR Buy Signals.
DECK is down -3.66% in after hours trading. This is one of my picks. I'm not happy to see it down so much in after hours trading, but it will afford you a better entry if the chart doesn't go south too quickly. It may need pullback after today's breakout. The breakout confirms a bullish falling wedge. The RSI just moved into positive territory and the PMO has turned up. It is new momentum given there isn't a crossover yet. However, that makes this a more risky trade. Stochastics are rising but aren't above 80 yet. Relative strength is great for the group and DECK is showing new strength against the group and SPY. The stop is set at 8% around $324.71.
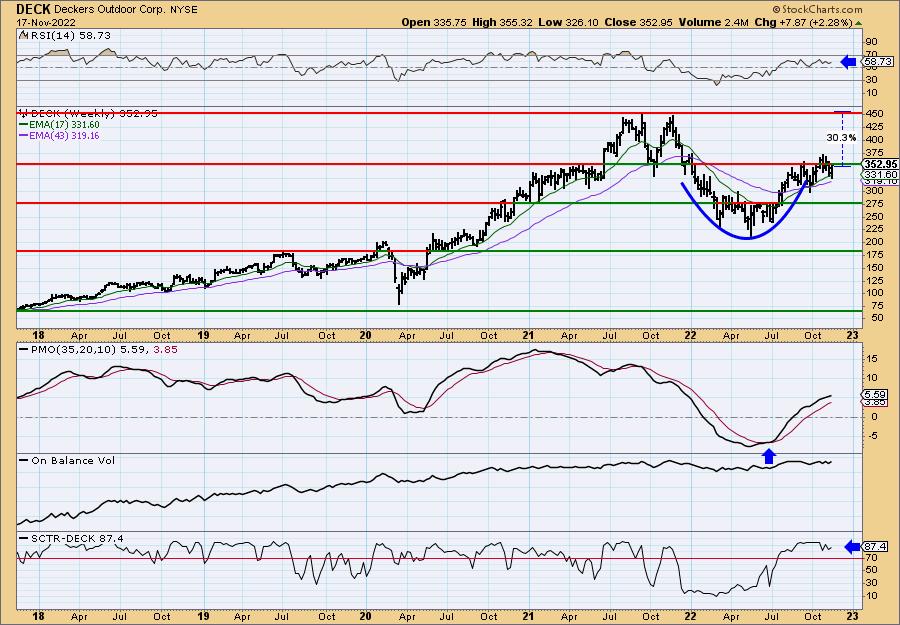
The weekly RSI has been positive for months. We have a nice cup shaped basing pattern. The weekly PMO is decelerating, but it remains comfortably on a BUY signal. The SCTR is in the "hot zone" above 70 meaning it is in the top third of all mid-cap stocks as far as trend and condition in all three timeframes. Upside potential is about 30%.
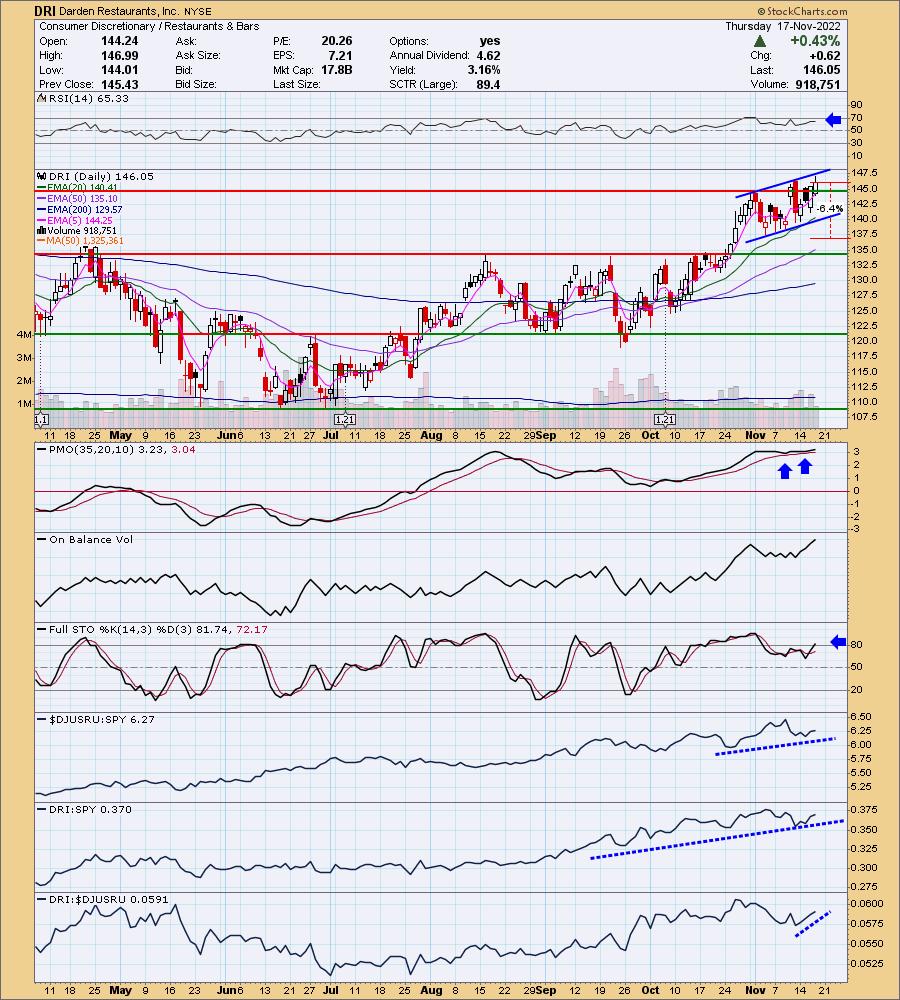
Darden Restaurants, Inc. (DRI)
EARNINGS: 12/16/2022 (BMO)
Darden Restaurants, Inc. is a full-service restaurant company, which engages in the provision of restaurant services. It operates through the following segments: Olive Garden, LongHorn Steakhouse, Fine Dining, and Other Business. The Olive Garden segment is the largest full-service dining Italian restaurant operator. The LongHorn Steakhouse segment includes the results of the company-owned LongHorn Steakhouse restaurants. The Fine Dining segment consists of the premium brands that operate within the fine-dining sub-segment of full-service dining and includes the results of its company-owned The Capital Grille and Eddie V's restaurants. The Other Business segment aggregates the remaining brands and includes the results of its company-owned Cheddar's Scratch Kitchen, Yard House, Seasons 52 and Bahama Breeze restaurants, and from franchises and consumer-packaged goods sales. The company was founded by William B. Darden in 1938 and is headquartered in Orlando, FL.
Predefined Scans Triggered: None.
DRI is unchanged in after hours trading. It is near the top of a rising trend channel so we could see a trip down to the bottom first, but that is what the stop accounts for. The RSI is positive and there are two PMO bottoms above the signal line which is great given it is on the overbought side. Stochastics have just moved above 80. Relative strength for the group has been up and down, but overall trending higher. DECK has been consistently better than the SPY. It is beginning to outperform its industry group. The stop is fairly thin at 6.4% around $136.70.
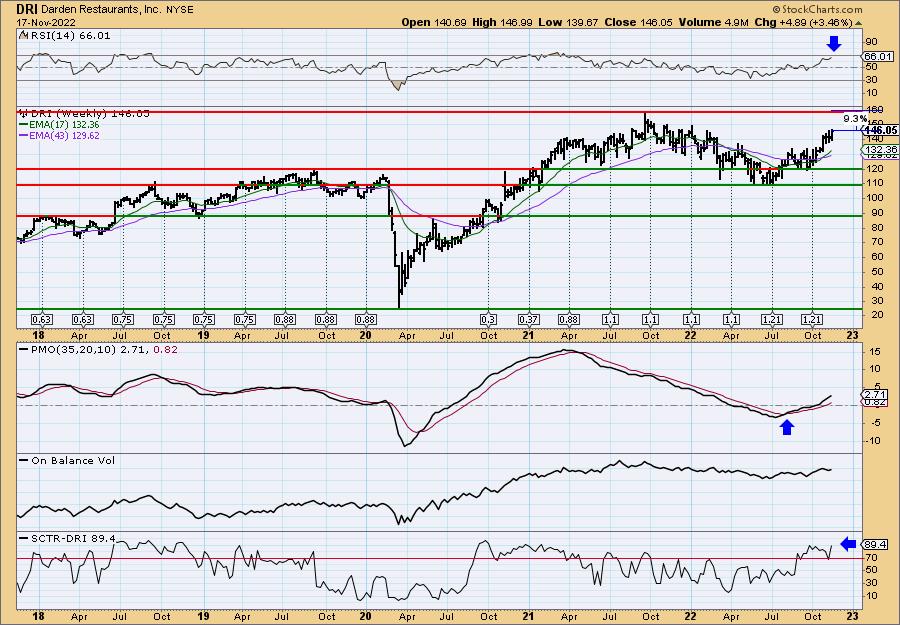
The weekly chart has been strong for weeks after price bottomed in July. The weekly RSI is positive and the PMO is rising on a crossover BUY signal and is far from overbought. The SCTR is very strong at 89.4%. Upside potential is more than 9.3% in my opinion, but that would take it to new all-time highs. Look at a possible upside target of 15% at $167.96.
SolarEdge Technologies, Inc. (SEDG)
EARNINGS: 02/14/2023 (AMC)
SolarEdge Technologies, Inc. engages in the development of energy technology, which provides inverter solutions. The firm operates through the following segments: Solar and All Other. The Solar segment includes the design, development, manufacturing, and sales of an inverter solution designed to maximize power generation. The All Other segment includes the design, development, manufacturing and sales of UPS products, energy storage products, e-Mobility products, and automated machines. Its products and services include photovoltaic inverters, power optimizers, photovoltaic monitoring, software tools, and electric vehicle chargers. The company was founded by Guy Sella, Lior Handelsman, Yoav Galin, Meir Adest, and Amir Fishelov in 2006 and is headquartered in Herzliya, Israel.
Predefined Scans Triggered: None.
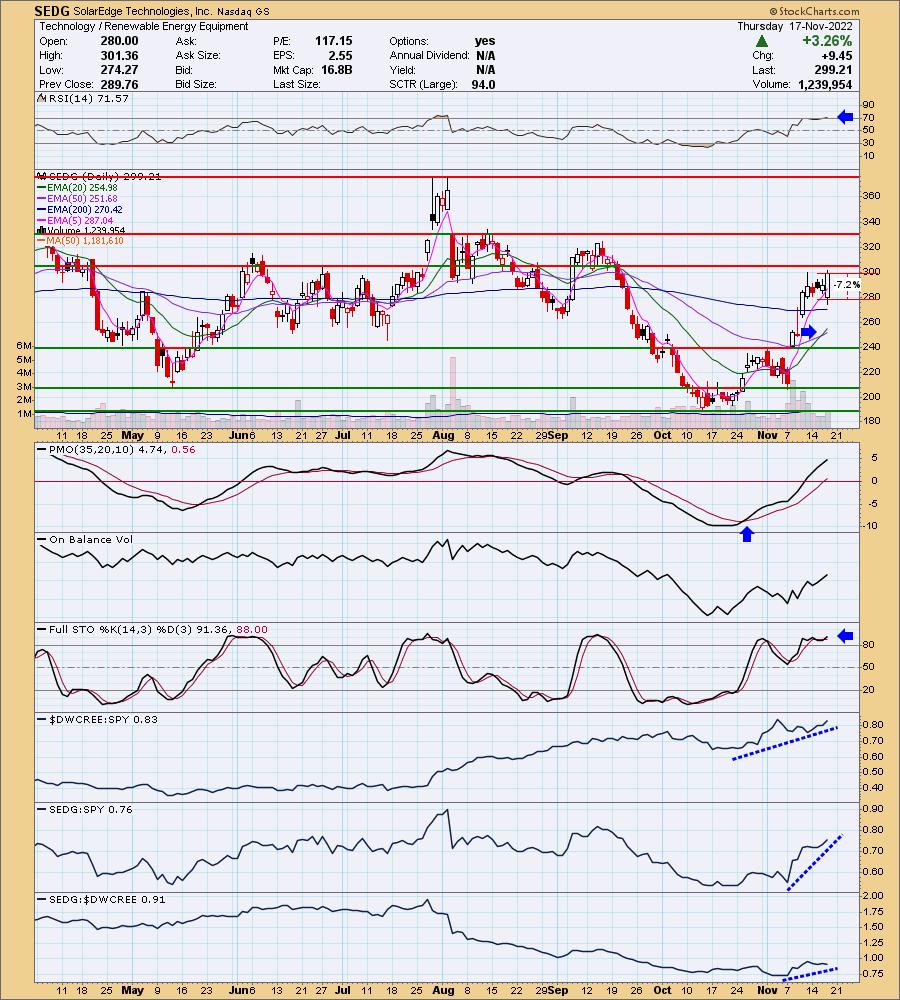
SEDG is down -0.03% in after hours trading. I still like the Solar industry group so this was actually an easy pick. We have a giant bullish engulfing candlestick today. There is a recent IT Trend Model "Silver Cross" BUY signal. The PMO is on an oversold BUY signal and while it is getting overbought, based on the -10 low on the PMO, it can travel up to +10 as a high. I'll take it. Stochastics have turned up above 80. Relative strength for the group is still fairly strong and SEDG tends to travel inline with the group. This would explain why it has done extremely well this month against the SPY. The stop is set around 7.2% or $277.66.
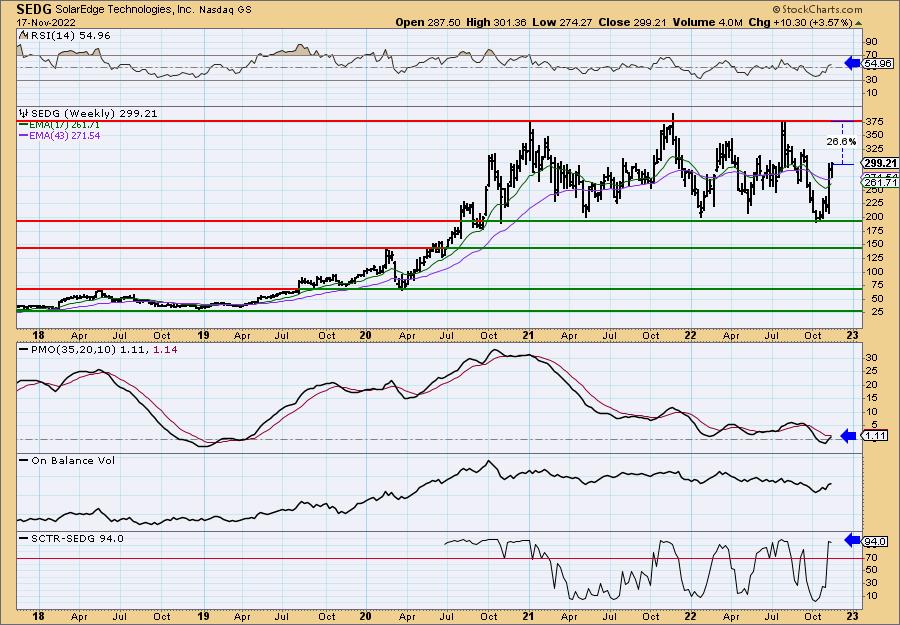
This one loves its trading range and it appears it is ready to travel back up to the top of it which would be an over 26% gain. The weekly RSI is positive and the weekly PMO is about to give us an oversold crossover BUY signal. The SCTR is outstanding at 94%.
Tsakos Energy Navigation Ltd. (TNP)
EARNINGS: 11/22/2022 (BMO)
Tsakos Energy Navigation Ltd. engages in the provision of seaborne crude oil and petroleum product transportation services. Its activities include the operation of crude tankers, product tankers, and liquefied natural gas carriers. The company was founded by Nikolas P. Tsakos and Michael Gordon Jolliffee in July 1993 and is headquartered in Athens, Greece.
Predefined Scans Triggered: Moved Above Upper Bollinger Band.
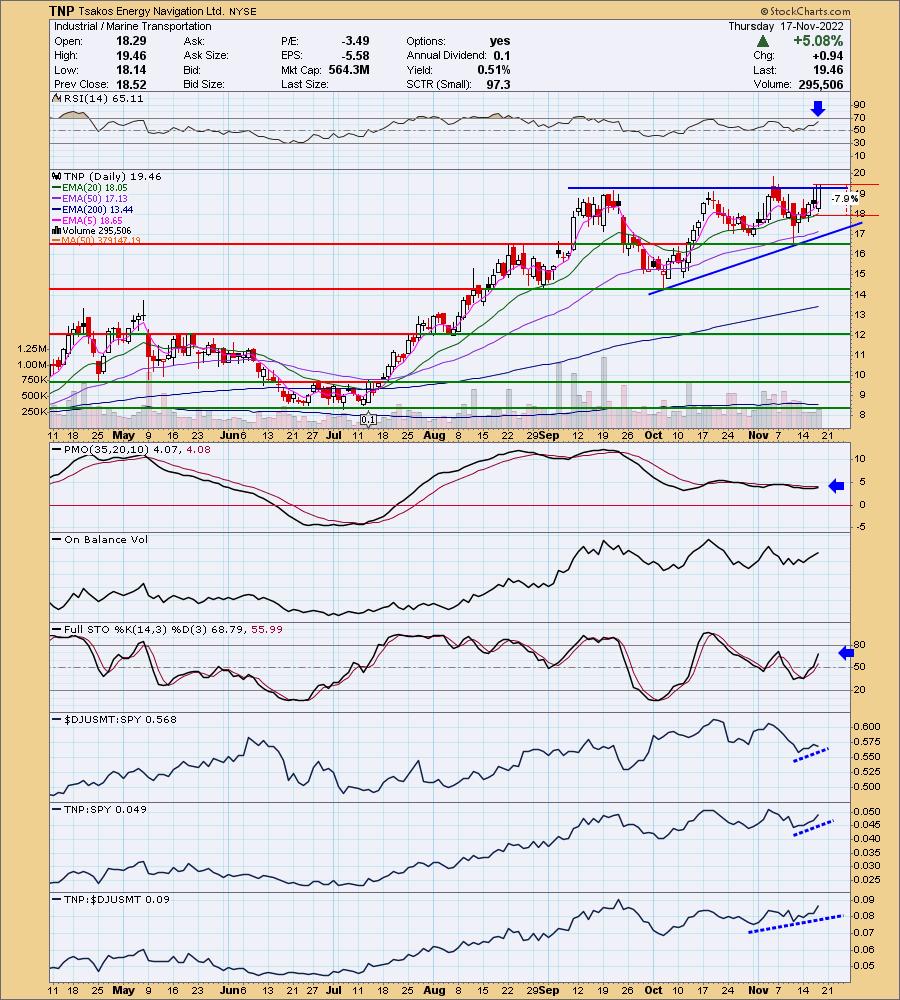
TNP is up +0.21% in after hours trading. This is my other selection. price is in a bullish ascending triangle. Price has now broken out of the pattern. It isn't completely confirmed mainly because the breakout isn't that expansive, but it is on the right track. The RSI is positive, rising and not overbought. The PMO is about to trigger a crossover BUY signal. Stochastics are rising toward 80. Relative strength for the group is somewhat weak, but appears to be improving this week. TNP is typically an out-performer of the group. It is now starting to outperform the SPY. The stop is set below the 20-day EMA at 7.9% around $17.92.
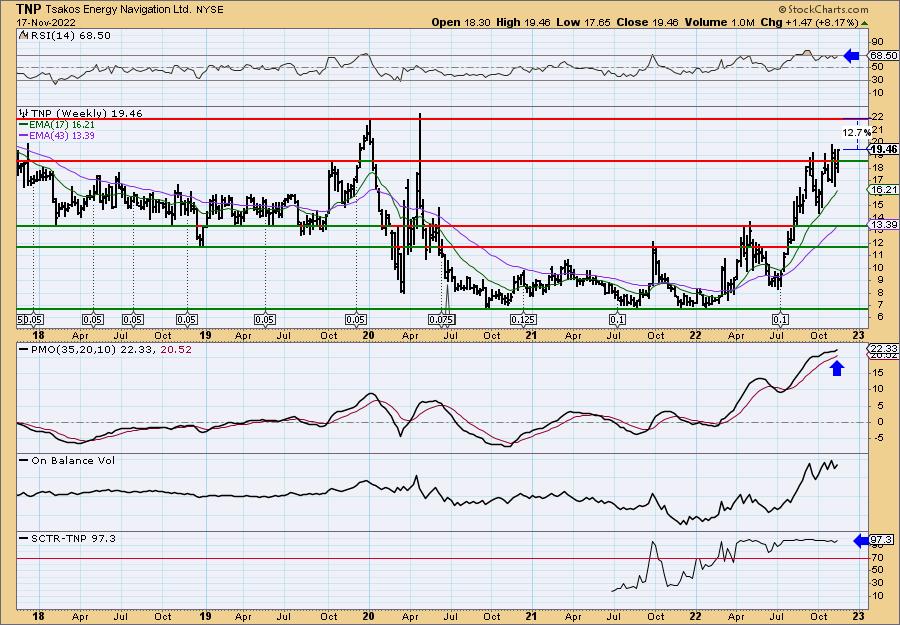
The breakout is a bit messy, but ultimately it has broken above the 2019 top. The weekly RSI is positive and the weekly PMO is accelerating higher. It should move higher than 12.7%. If you want to set the upside target around 15% that would be around $22.38.
Don't forget, on Thursdays I look at reader-requested symbols, click HERE to send me an email. I read every email I receive and try to answer them all!
Current Market Outlook:
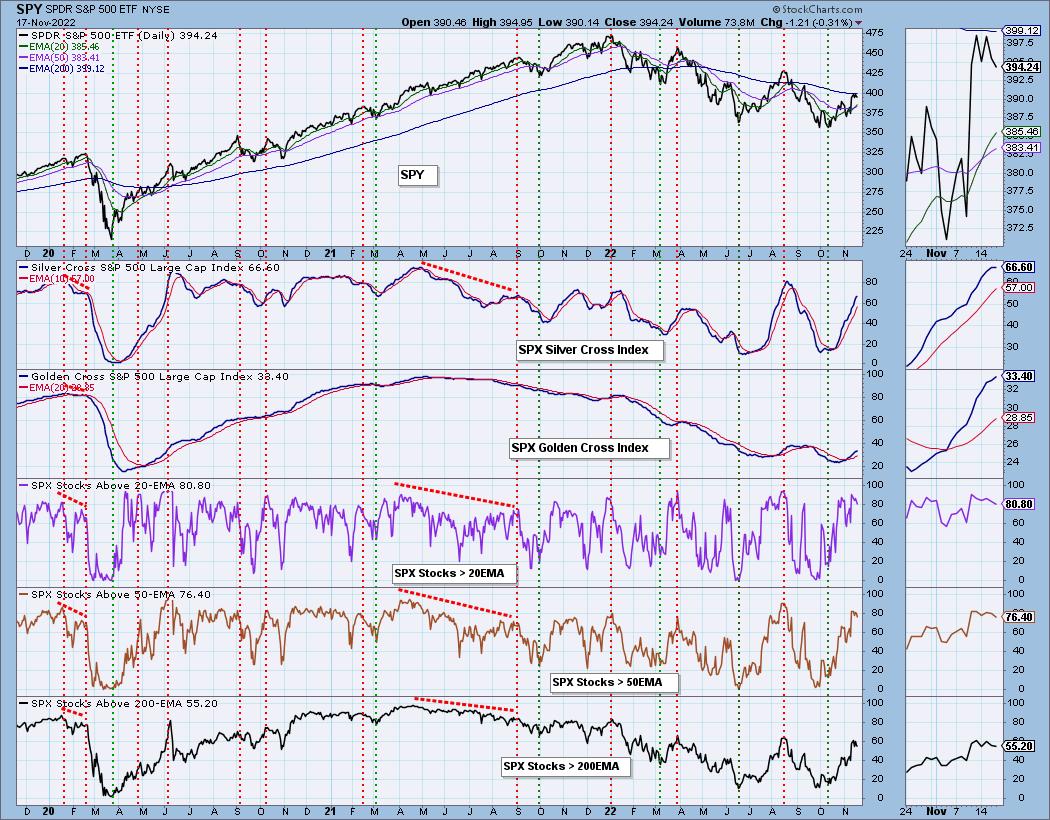
Market Environment: It is important to consider the odds for success by assessing the market tides. The following chart uses different methodologies for objectively showing the depth and trend of participation for intermediate- and long-term time frames.
- The Silver Cross Index (SCI) shows the percentage of SPX stocks on IT Trend Model BUY signals (20-EMA > 50-EMA)
- The Golden Cross Index (GCI) shows the percentage of SPX stocks on LT Trend Model BUY signals (50-EMA > 200-EMA)
Don't forget that as a "Diamonds" member, you have access to our GCI/SCI curated ChartList on DecisionPoint.com. You'll find it under "Members Only" links on the left side on the Blogs and Links Page.
Here is the current chart:
Full Disclosure: I am 55% exposed.
I'm required to disclose if I currently own a stock I mention and/or may buy/short it within the next 72 hours.
"Technical Analysis is a windsock, not a crystal ball." - Carl Swenlin
(c) Copyright 2022 DecisionPoint.com
Watch the latest episode of DecisionPoint with Carl & Erin Swenlin on Mondays 7:00p EST or on the DecisionPoint playlist on the StockCharts TV YouTube channel here!
NOTE: The stocks reported herein are from mechanical trading model scans that are based upon moving average relationships, momentum and volume. DecisionPoint analysis is then applied to get five selections from the scans. The selections given should prompt readers to do a chart review using their own analysis process. This letter is not a call for a specific action to buy, sell or short any of the stocks provided. There are NO sure things or guaranteed returns on the daily selection of "Diamonds in the Rough."
Regarding BUY/SELL Signals: The signal status reported herein is based upon mechanical trading model signals and crossovers. They define the implied bias of the price index/stock based upon moving average relationships and momentum, but they do not necessarily call for a specific action. They are information flags that should prompt chart review. Further, they do not call for continuous buying or selling during the life of the signal. For example, a BUY signal will probably (but not necessarily) return the best results if action is taken soon after the signal is generated. Additional opportunities for buying may be found as price zigzags higher, but the trader must look for optimum entry points. Conversely, exit points to preserve gains (or minimize losses) may be evident before the model mechanically closes the signal.
Helpful DecisionPoint Links:
DecisionPoint Shared ChartList and DecisionPoint Chart Gallery
Price Momentum Oscillator (PMO)
Swenlin Trading Oscillators (STO-B and STO-V)
For more links, go to DecisionPoint.com