
The market didn't return from the holidays strong, it has been more like a hangover. We don't like the way the market is acting so while I have some good picks today, expanding your exposure right now is risky. I personally am only 10% exposed to the market with no plans to add to my portfolio this week.
I like Coal and one of our prior "Diamonds in the Rough" in Coal, CONSOL Energy (CEIX) is up over 13% since being picked on November 22nd. It's overbought right now so I opted to include a Coal stock that came up in two of my scans today. With winter arriving, we would expect to see coal stocks do well.
We have a schedule change this week. There will be no Diamond Mine Trading Room on Friday this week. I'm back in Las Vegas to see the PAC-12 Championship game with USC playing Utah. USC is my alma mater and this is the first time we've been eligible to enter the college football playoffs. We must win on Friday for that to happen so I'm going to be there to cheer them on!
The DP Diamonds Recap will be published on Sunday instead of Friday.
I'm looking for requests for Thursday! Send in your symbols and see if they are "Diamonds in the Rough"!
Good Luck & Good Trading!
Erin
Today's "Diamonds in the Rough": ARLP, HMN and VVI.
Runner-ups: NOC, THS, LXU, ARKO and G.
** SCHEDULE CHANGE **
Next week there will be no Diamond Mine on December 2nd and the Recap will go out on Saturday December 3rd.

TODAY'S RECORDING LINK (11/25/2022):
Topic: DecisionPoint Diamond Mine (11/25/2022) LIVE Trading Room
Start Time: Nov 25, 2022 09:00 AM
Passcode: Nov#25th
** NO DIAMOND MINE on December 2nd **
The Diamonds Recap will be published on December 3rd.

Here is the last recording:
Welcome to DecisionPoint Diamonds, wherein I highlight ten "Diamonds in the Rough" per week. These are selected from the results of my DecisionPoint Scans which search for stocks that could benefit from the trend and condition of the market. Remember, these are not recommendations to buy or sell, but are the most interesting of the stocks that surfaced in my scans. My objective is to save you the work of the initial, tedious culling process, but you need to apply your own analysis to see if these stocks pique your interest as well. There are no guaranteed winners here!
"Predefined Scans Triggered" are taken from StockCharts.com using the "Symbol Summary" option instead of a "SharpChart" on the workbench.
Alliance Resource Partners, L.P. (ARLP)
EARNINGS: 01/30/2023 (BMO)
Alliance Resource Partners LP is a natural resource company, which produces and markets coal to United States utilities and industrial users. It operates through the following segments: Illinois Basin, Appalachia, Minerals, and Other & Corporate. The Illinois Basin segment is comprised of Webster County coal's Dotiki mining complex, Gibson mining complex, which includes the Gibson north mine and the Gibson south project, Hopkins County coal's Elk Creek mining complex, White County coal's Pattiki mining complex, Warrior's mining complex, River View's mining complex, the Sebree property and certain properties of Alliance Resource Properties and ARP Sebree LLC. The Appalachian segment is composed of Pontiki and MC Mining complexes. The Minerals segment includes its oil & gas mineral interests, which are located primarily in the Permian, Anadarko, and Williston basins. The Other and Corporate segment includes marketing and administrative expenses, Mt. Vernon dock activities, coal brokerage activity, its equity investment in Mid-America Carbonates LLC and certain activities of Alliance Resource Properties. The company was founded in 1971 and is headquartered in Tulsa, OK.
Predefined Scans Triggered: Elder Bar Turned Green and Entered Ichimoku Cloud.
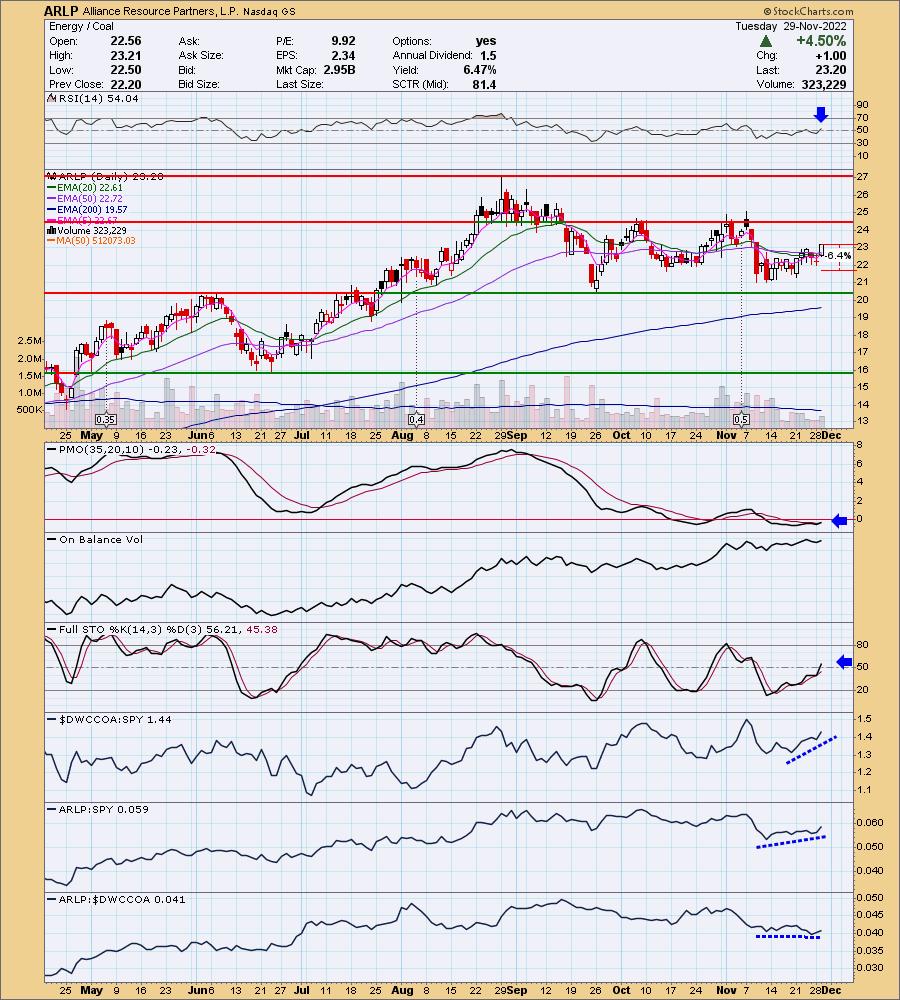
ARLP is down -0.34% in after hours trading. I wouldn't be surprised if ARLP saw a pullback tomorrow after such a powerful move. I generally don't pick trading range stocks, but I like the group and expect ARLP will at least reach overhead resistance at the August top. The chart is shaping up with the RSI now in positive territory above net neutral (50), the PMO just triggered a crossover BUY signal and Stochastics are in positive territory. Relative strength of the group is clearly improving and ARLP, while not a stellar performer in the group, is beginning to outperform the SPY. This one came in on two of my scans so I figured it was worth mentioning. The stop is set at 6.4% around $21.71.
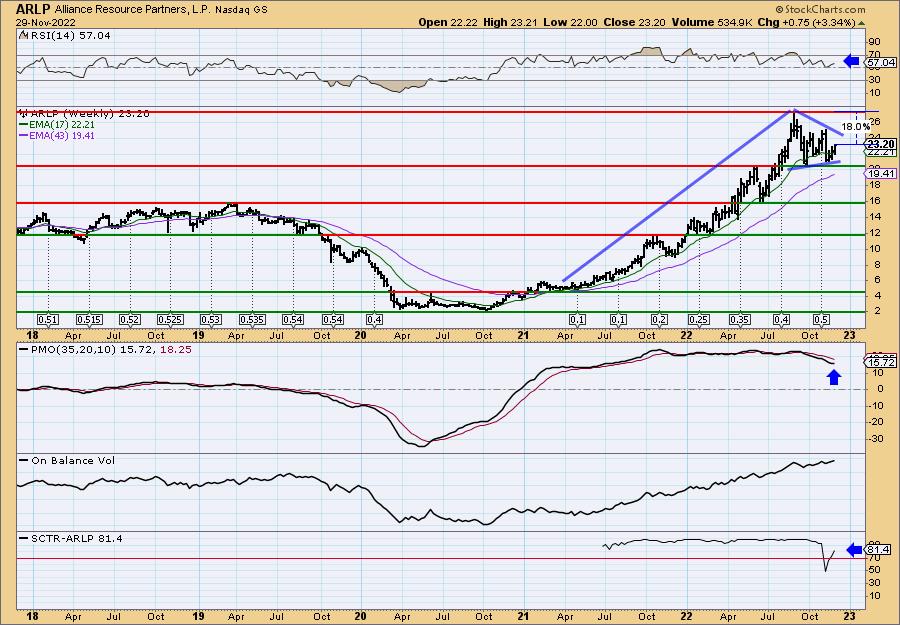
I was intrigued by the weekly chart. The weekly RSI is positive and rising and the weekly PMO is bottoming. The SCTR is a healthy 81.4% suggesting that based on trend and condition, it is in the top 9% of all mid-caps. Upside potential is about 18% should it reach its all-time high.
Horace Mann Educators Corp. (HMN)
EARNINGS: 02/01/2023 (AMC)
Horace Mann Educators Corp. is an insurance holding company, which engages in the provision of insurance and retirement solutions to educators and school employees. It operates through the following business segments: Property and Casualty, Supplemental, Retirement, Life, and Corporate and Other. The Property and Casualty segment focuses on personal lines of automobile and property insurance products. The Supplemental segment focuses on heart, cancer, accident, and limited short-term supplemental disability coverage. The Retirement segment consists of tax-qualified fixed and variable annuities. The Life segment offers life insurance. The Corporate and Other segment includes interest expense on debt, the impact of realized investment gains and losses and certain public company expenses. The company was founded by Carrol Hall and Leslie Nimmo in 1945 and is headquartered in Springfield, IL.
Predefined Scans Triggered: Stocks in a New Downtrend (Aroon) and Parabolic SAR Buy Signals.
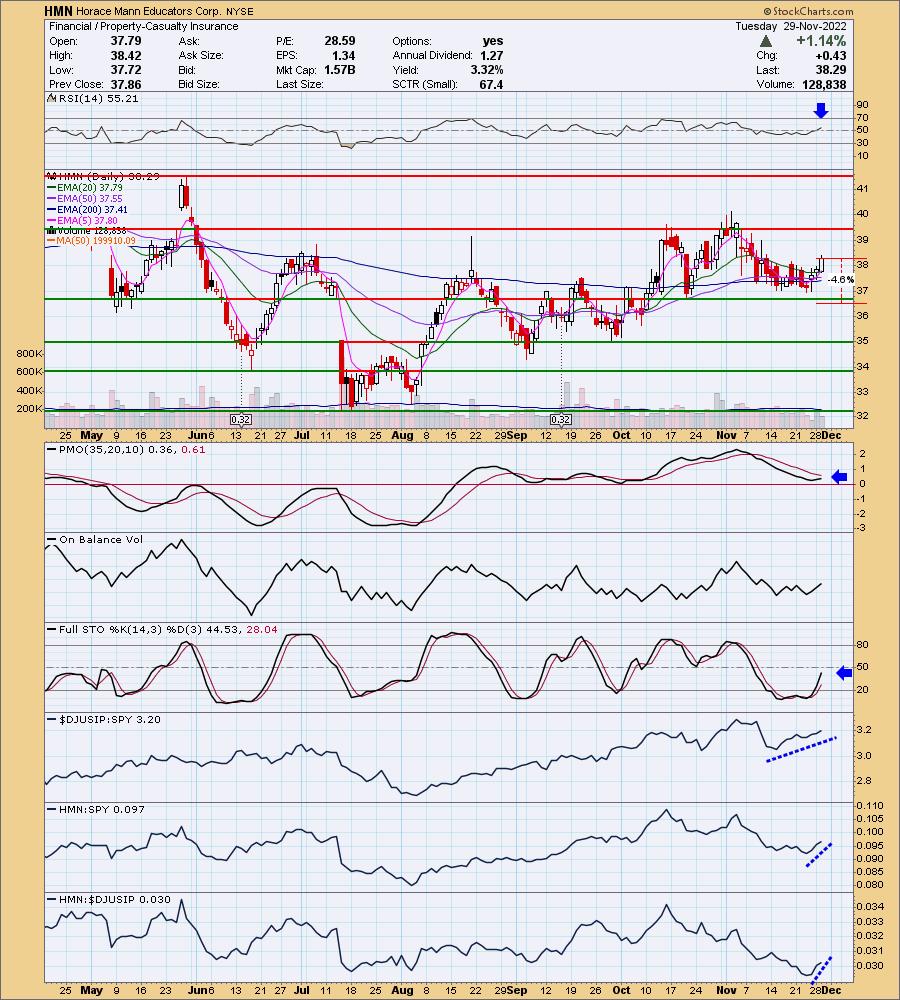
HMN is unchanged in after hours trading. Last week I mentioned XLF on ETF Day. Here is a member of the sector. I like the bottoming formation and break from the declining trend. The RSI just moved into positive territory and the PMO is rising toward a crossover BUY signal. Stochastics are rising nicely but haven't quite reached positive territory above 50. Relative strength is great for the group and HMN is beginning to show leadership within the group and against the SPY. The stop can be thinly at 4.6% around $36.52.
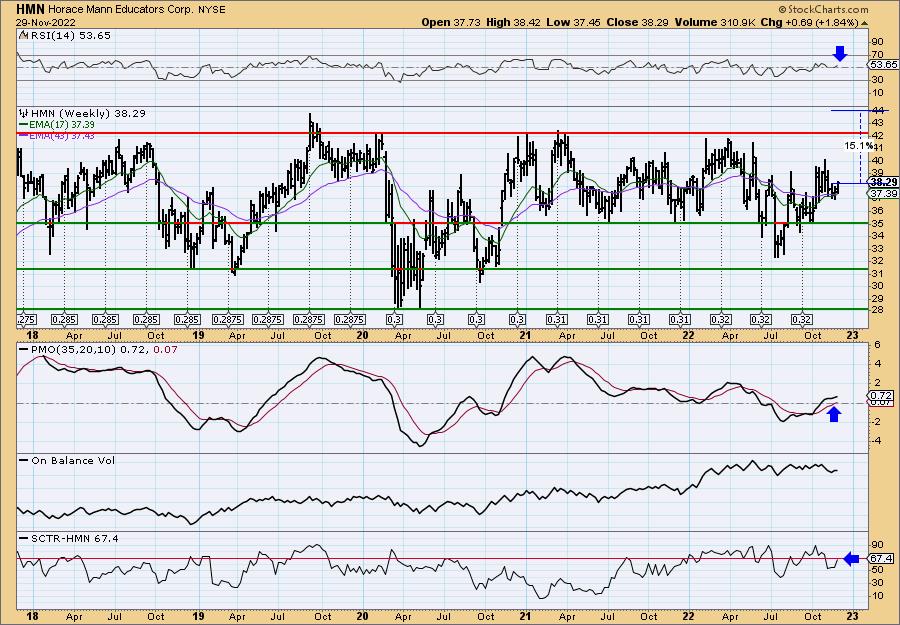
I am not a huge fan of the weekly chart, but it does have merit. The big problem is the giant trading ranges. Should price reach its all-time high, it would be a 15% gain. That's not bad particularly given the stop is so thin. The weekly RSI has turned up in positive territory and the weekly PMO is bottoming above its signal line which is especially bullish. The SCTR isn't above 70% yet, but it is close and it is improving.
Viad Corp. (VVI)
EARNINGS: 02/09/2023 (AMC)
Viad Corp. engages in the provision of marketing services and travel and recreation services. It operates through the following segments: GES U.S., GES International, (collectively, GES) and Pursuit. The GES business group offers live event service to visible and influential events and global brands. The Pursuit business group refers to the collection of iconic natural and cultural destination experiences. The company was founded in 1926 and is headquartered in Phoenix, AZ.
Predefined Scans Triggered: Elder Bar Turned Green, Bullish MACD Crossovers and Parabolic SAR Buy Signals.
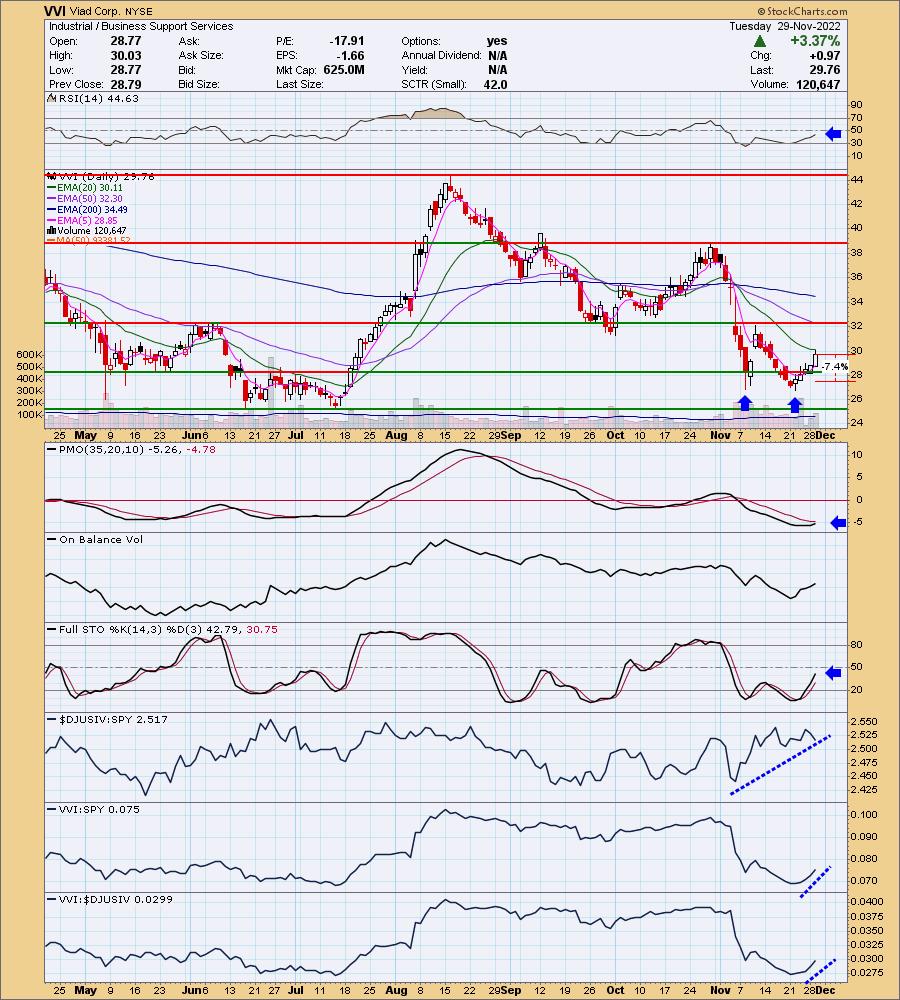
VVI is unchanged in after hours trading. This looks like a short-term "V" bottom complimented by a longer-term bullish double-bottom. If the "V" bottom pattern is correct, price should overcome resistance at $32. The double-bottom pattern will be confirmed with a breakout above $32. That pattern implies a move that would challenge resistance at the October high. The RSI is negative, but rising. The PMO is nearing a crossover BUY signal. Stochastics are also in negative territory, but are rising nicely. The group in the near term isn't really outperforming, but longer term it is in a rising trend. Relative strength for VVI is improving against the SPY and the group. The stop is set at about 7.4% or $27.55.
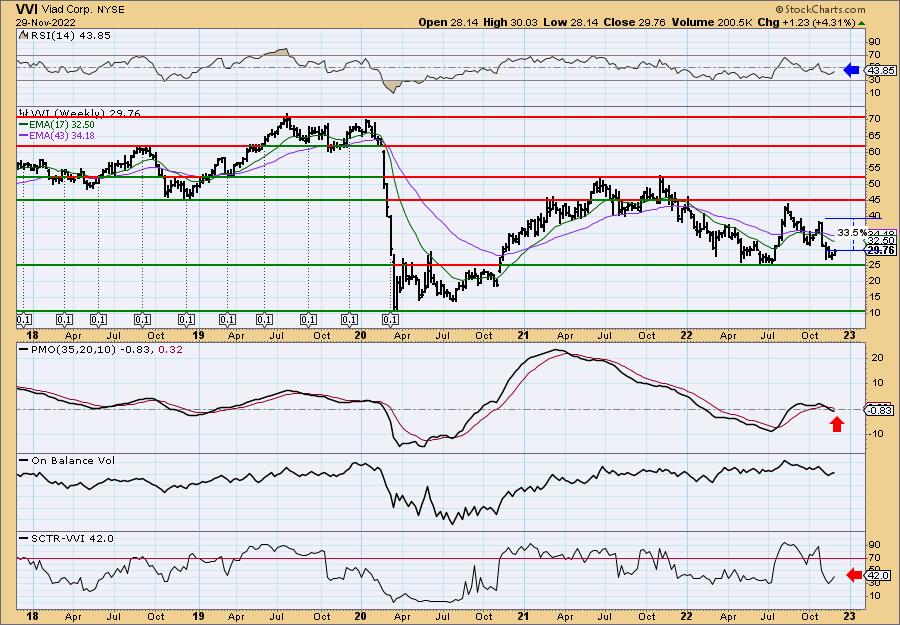
The weekly indicators aren't great, but I like the way price is currently bouncing off long-term support. The weekly RSI is negative, but rising. The weekly PMO is bearish, but might be seeing some deceleration on this week's rally. The SCTR is not good, but it is rising. Upside potential should it reach the next level of overhead resistance is a tidy 33.5%.
Don't forget, on Thursdays I look at reader-requested symbols, click HERE to send me an email. I read every email I receive and try to answer them all!
Current Market Outlook:
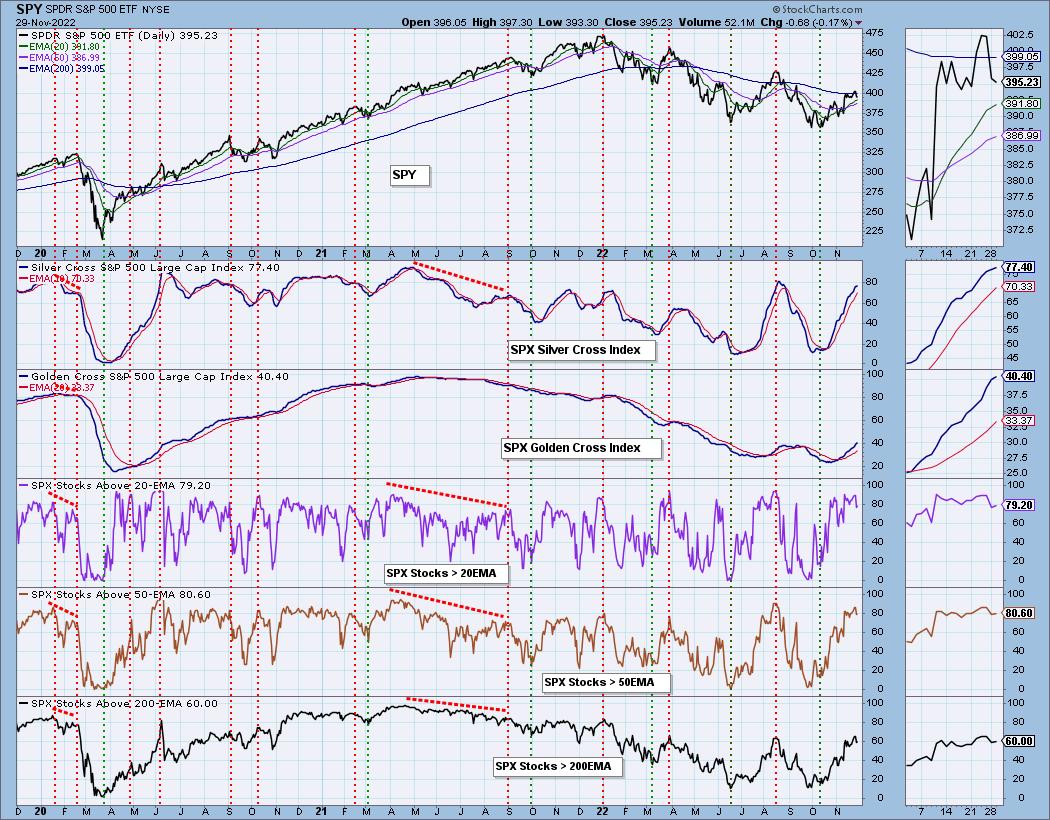
Market Environment: It is important to consider the odds for success by assessing the market tides. The following chart uses different methodologies for objectively showing the depth and trend of participation for intermediate- and long-term time frames.
- The Silver Cross Index (SCI) shows the percentage of SPX stocks on IT Trend Model BUY signals (20-EMA > 50-EMA)
- The Golden Cross Index (GCI) shows the percentage of SPX stocks on LT Trend Model BUY signals (50-EMA > 200-EMA)
Don't forget that as a "Diamonds" member, you have access to our GCI/SCI curated ChartList on DecisionPoint.com. You'll find it under "Members Only" links on the left side on the Blogs and Links Page.
Here is the current chart:
Full Disclosure: I am 10% exposed.
I'm required to disclose if I currently own a stock I mention and/or may buy/short it within the next 72 hours.
"Technical Analysis is a windsock, not a crystal ball." - Carl Swenlin
(c) Copyright 2022 DecisionPoint.com
Watch the latest episode of DecisionPoint with Carl & Erin Swenlin on Mondays 7:00p EST or on the DecisionPoint playlist on the StockCharts TV YouTube channel here!
NOTE: The stocks reported herein are from mechanical trading model scans that are based upon moving average relationships, momentum and volume. DecisionPoint analysis is then applied to get five selections from the scans. The selections given should prompt readers to do a chart review using their own analysis process. This letter is not a call for a specific action to buy, sell or short any of the stocks provided. There are NO sure things or guaranteed returns on the daily selection of "Diamonds in the Rough."
Regarding BUY/SELL Signals: The signal status reported herein is based upon mechanical trading model signals and crossovers. They define the implied bias of the price index/stock based upon moving average relationships and momentum, but they do not necessarily call for a specific action. They are information flags that should prompt chart review. Further, they do not call for continuous buying or selling during the life of the signal. For example, a BUY signal will probably (but not necessarily) return the best results if action is taken soon after the signal is generated. Additional opportunities for buying may be found as price zigzags higher, but the trader must look for optimum entry points. Conversely, exit points to preserve gains (or minimize losses) may be evident before the model mechanically closes the signal.
Helpful DecisionPoint Links:
DecisionPoint Shared ChartList and DecisionPoint Chart Gallery
Price Momentum Oscillator (PMO)
Swenlin Trading Oscillators (STO-B and STO-V)
For more links, go to DecisionPoint.com