
As we traveled through this bear market, you may remember that we've had to dip into inverse ETFs. I'm not a fan because nearly all of them are "juiced" meaning 2x or 3x inverses. (Although I did receive an email from a happy viewer that because we thought Silver was favorable on Monday, they were able to get in and get out with a tidy profit using a leveraged ETF.)
With the market rallying earlier this week, ETFs on the bull side are popping up. I noticed quite a few "dividend" ETFs, those that track stocks with high dividends. Total Market ETFs and Financials were popular as well.
As I sorted through today's scan results, I was impressed by the rebounds. The ones I ended up picking have broken key resistance levels and have newly rising PMOs. Tie breakers were whether the ETF's weekly chart was favorably and relative strength was increasing. Granted the relative strength argument doesn't carry a lot of weight, but it was an okay tiebreaker.
Tomorrow is Reader Request Day! Send me the symbols that are on your radar and I'll give you my thoughts. Sorry about skipping the Friday Diamond Mine trading room, it simply can't be helped. Email address: erin@decisionpoint.com.
Good Luck & Good Trading!
Erin
Today's "Diamonds in the Rough": HDV, LRGF and URA.
Runner-Ups: BCI, DEM, FDL, JEPI, VONE, VTI and XLF.

RECORDING LINK (9/30/2022):
Topic: DecisionPoint Diamond Mine (9/30/2022) LIVE Trading Room
Start Time: Sept 30, 2022 09:00 AM
Passcode: Sept#30th
*** NO DIAMOND MINE ON 10/7 ***
I will be at ChartCon 2022 on Friday and unable to hold the trading room. I'm planning on doing the Recap, but that is tentative. You will receive your ten picks for the week including ETF Day and Reader Request Day.
I'll be running trading rooms with Dave Landry so you might want to sign up to attend ChartCon 2022! I'll also be debating my friend, Tom Bowley point/counterpoint style bear v. bull! The event will not be like it was in the past. It is more of a television production with entertaining segments that will make education fun! Here is the link.

Here is the Monday 10/3 recording:
Welcome to DecisionPoint Diamonds, wherein I highlight ten "Diamonds in the Rough" per week. These are selected from the results of my DecisionPoint Scans, which search for stocks that could benefit from the trend and condition of the market. Remember, these are not recommendations to buy or sell, but are the most interesting of the stocks that surfaced in my scans. My objective is to save you the work of the initial, tedious culling process, but you need to apply your own analysis to see if these stocks pique your interest as well. There are no guaranteed winners here!
"Predefined Scans Triggered" are taken from StockCharts.com using the "Symbol Summary" option instead of a "SharpChart" on the workbench.
iShares Core High Dividend ETF (HDV)
EARNINGS: N/A
HDV tracks a dividend-weighted index of 75 high-yielding US equities, screened for high earnings potential and dividend sustainability. For more information click HERE.
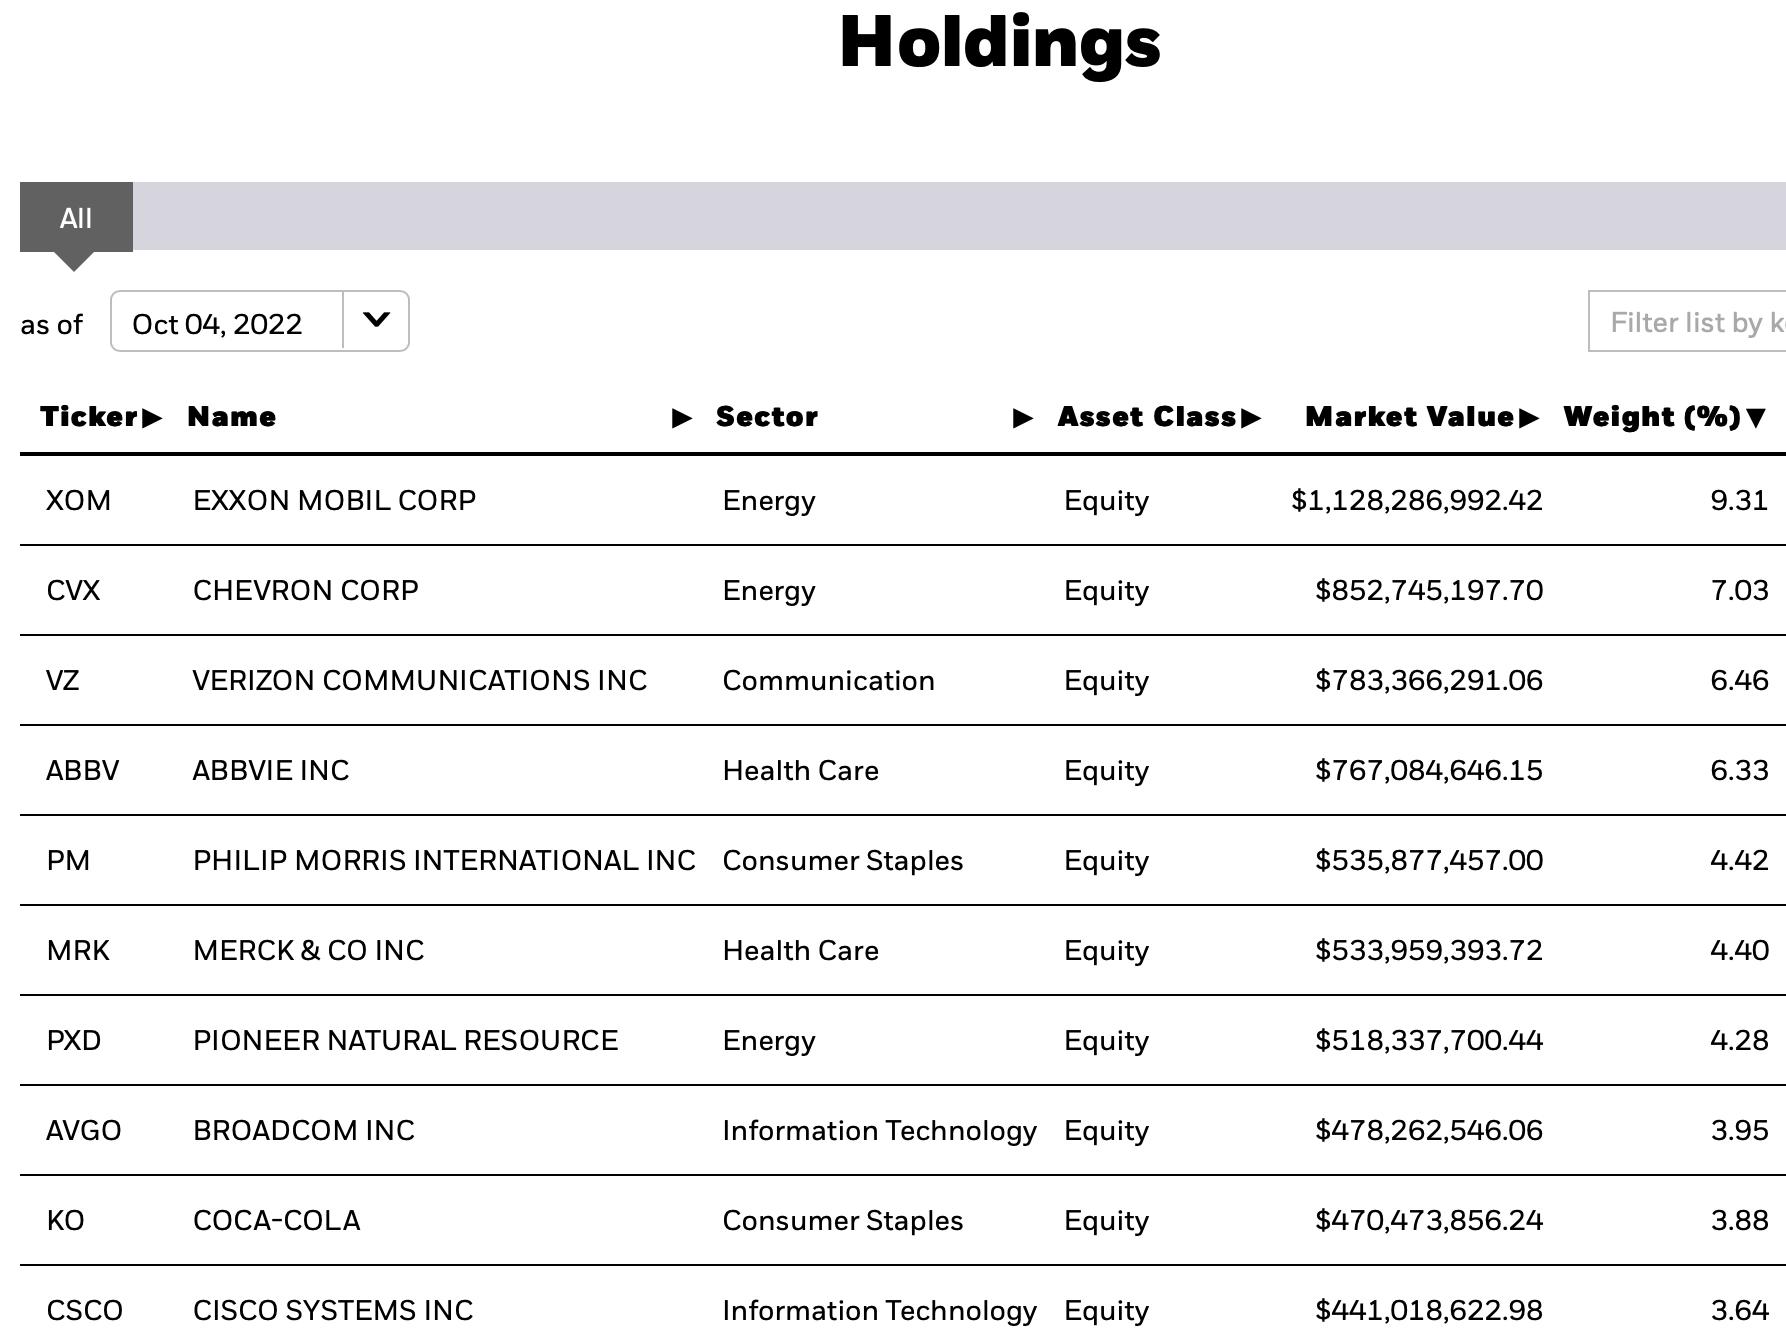
Predefined Scans Triggered: Bullish MACD Crossovers and P&F Low Pole.
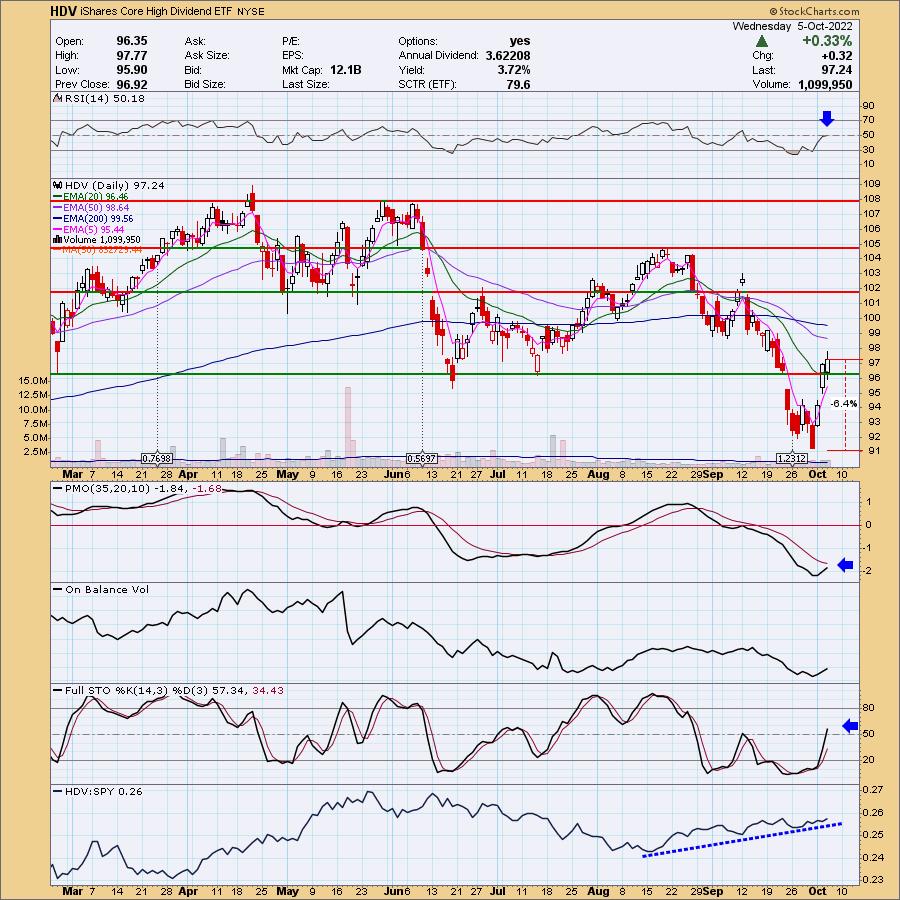
HDV is up +1.35% in after hours trading. Unlike the market, this one didn't need a snapback before moving higher. In fact, it held horizontal support at the June/July lows after covering the late September gap. The RSI is positive and the PMO has bottomed in oversold territory. This looks a bit like a "V" bottom which would suggest a move past $103. Volume could be higher, but Stochastics are rising nicely and relative strength has been there since late August. Of course, here is a great example of "outperformance" in a bear market. HDV went into free fall, yet was outperforming the SPY. The stop can be set thinly at 6.4% or around $91.01.
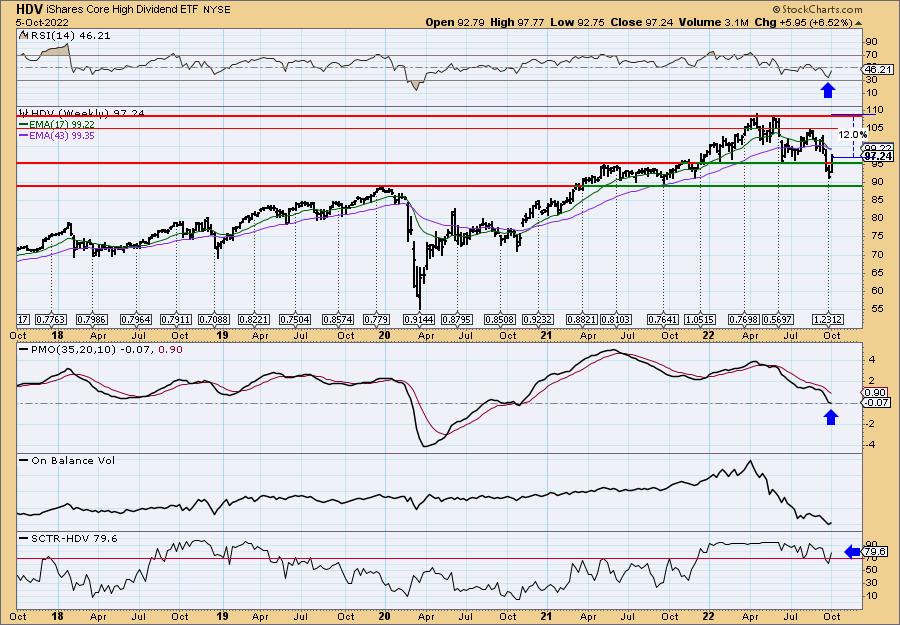
The upside potential for this one before it hits major support is 12%. That's almost double our stop percentage which makes this acceptable. More than likely it will travel above that if a bear market rally gets going here. The weekly RSI is rising, but still in negative territory. The weekly PMO is attempting to bottom on the zero line. The StockCharts Technical Rank (SCTR) is a respectable 79.6% which suggests HDV is in the top 21% of all ETFs based on the calculation.
iShares FactorSelect MSCI USA ETF (LRGF)
EARNINGS: N/A
LRGF tracks an index of US large- and mid-cap equities. Stocks are selected and weighted to maximize exposure to five factors: momentum, quality, value, low volatility, and size. For more information, click HERE.
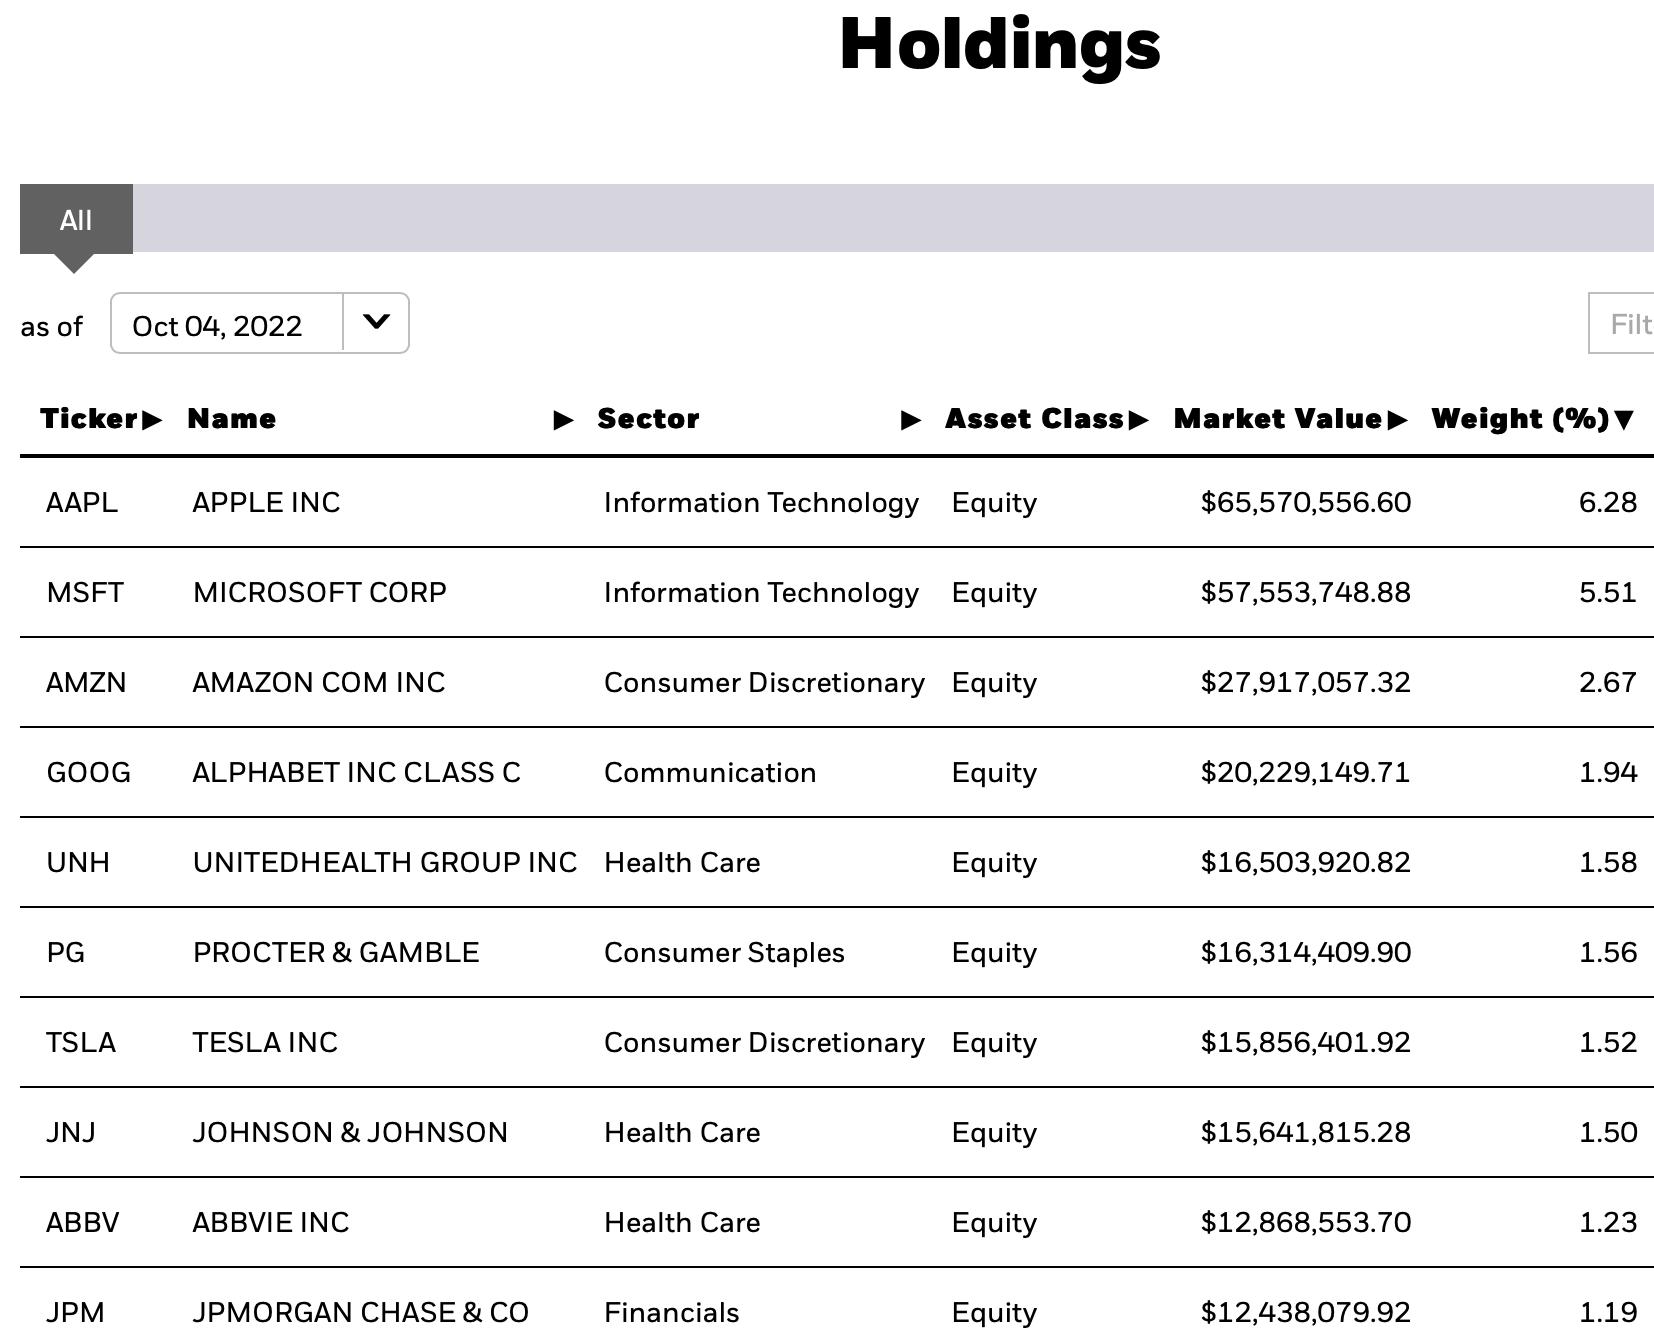
Predefined Scans Triggered: Bullish MACD Crossovers.
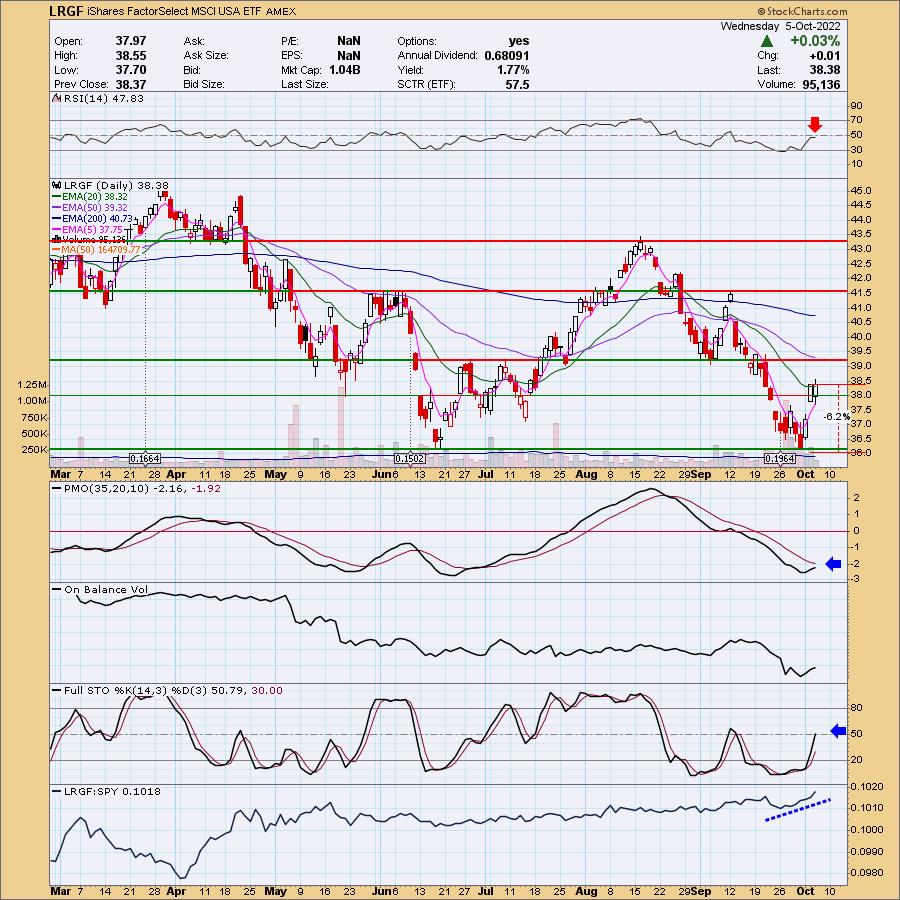
LRGF is down -0.03% in after hours trading. Price broke above the 20-day EMA and today it managed a second close above it. Resistance at the May has been overcome. The next challenge will be horizontal resistance at the early September low and the 50-day EMA. The RSI isn't positive right now, but it is acceptable for now given the PMO and Stochastics are rising convincingly. I'd like to have seen more volume, but it isn't a black mark. Relative strength is good. The stop is set at 6.2% or $36.00.
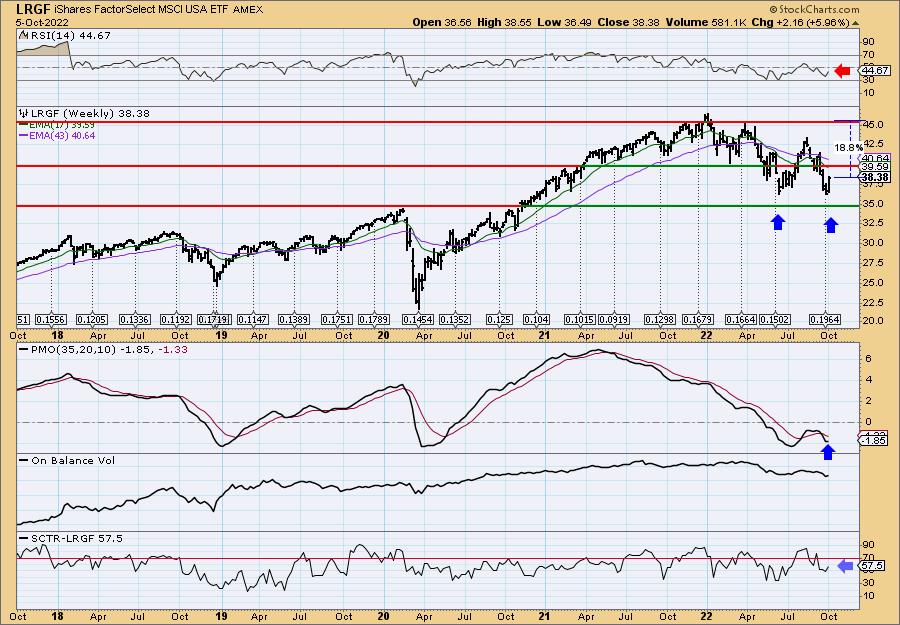
What impressed me most about the weekly chart was the weekly PMO. It has bottomed above its signal line and isn't overbought. A PMO bottom above the signal line is especially bullish. The SCTR is a respectable 76.7%.
Global X Uranium ETF (URA)
EARNINGS: N/A
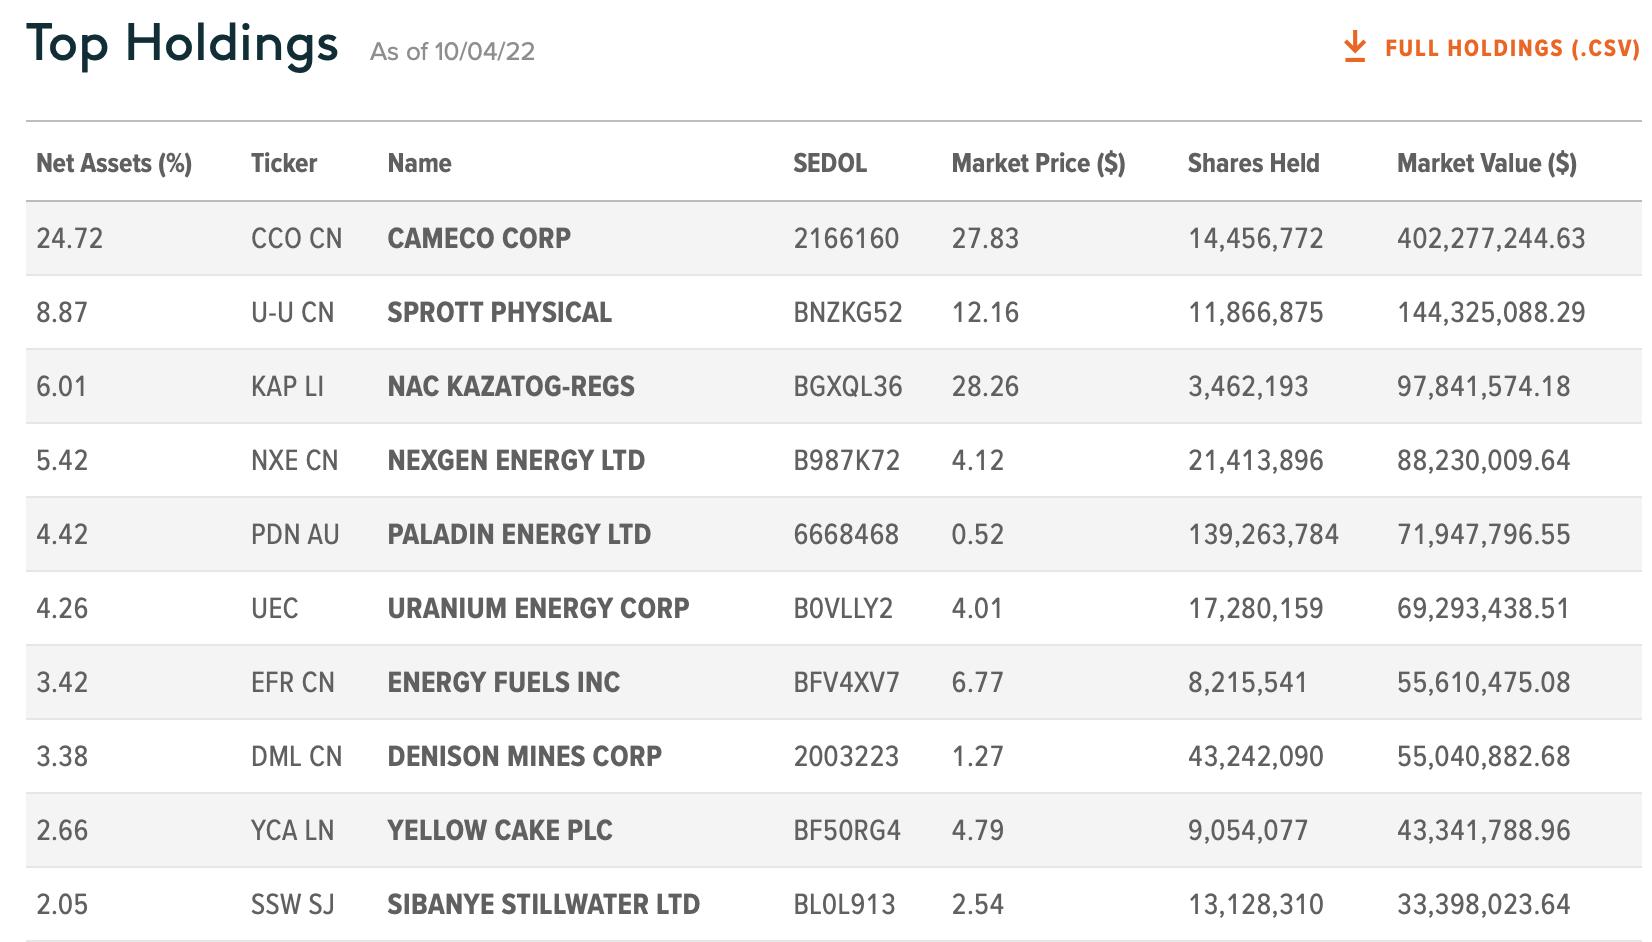
URA tracks a market-cap-weighted index of companies involved in uranium mining and the production of nuclear components. Click HERE for more information.
Predefined Scans Triggered: Bullish MACD Crossovers, Hollow Red Candles and Entered Ichimoku Cloud.
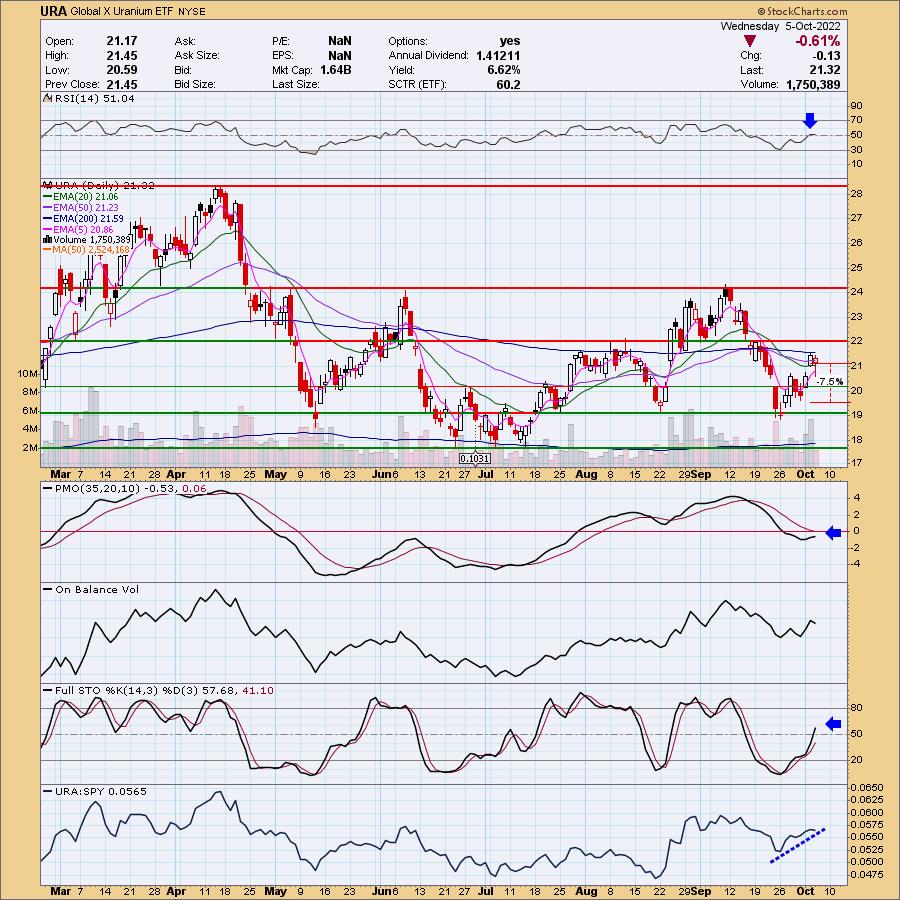
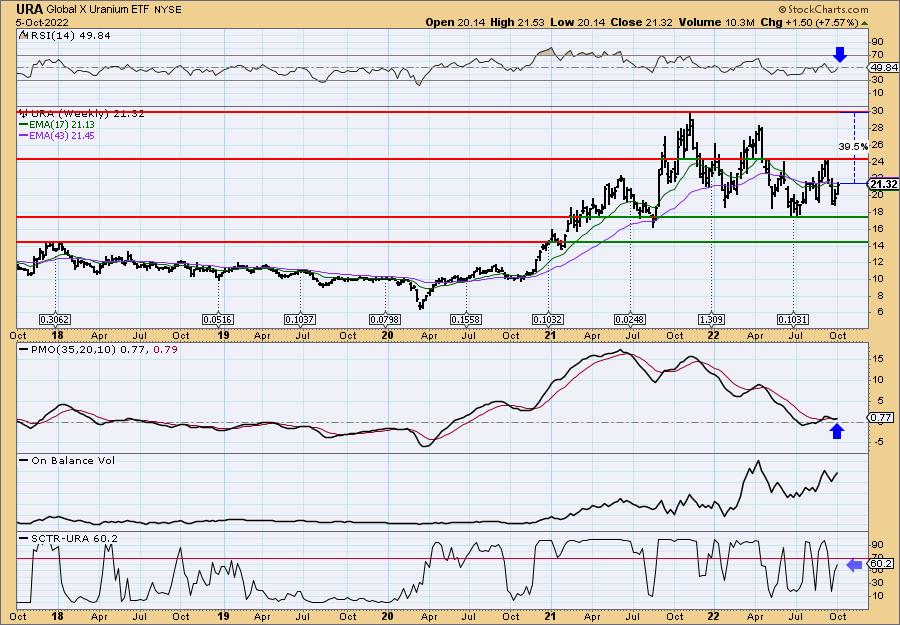
URA is up +1.50% in after hours trading. This one keeps coming up as a trading room request. Many investors are eyeing URA. Price has been rallying, but rather disjointedly given the fits and starts. I do like the chart right now given the RSI is positive and price has maintained above the 20/50-day EMAs. The PMO is rising and volume is coming in. Stochastics look very strong as they rise toward the magic number 80. Relative strength has picked up. The stop could be set below support at the August/September lows, but that would be a deep 11 to 12%. I chose to put it below the late June top and extended it a bit lower at 7.5% or around $19.72.
The weekly chart is enticing given the nearly positive RSI that is rising, the weekly PMO crossover BUY signal that is likely to stick after tomorrow's close and the OBV is confirming. The SCTR is average, but not in the basement. It's showing in the top 40% of all ETFs based on a SCTR of 60.2%. Upside potential is excellent at 39.5%.
Don't forget, on Thursdays I look at reader-requested symbols, click HERE to send me an email. I read every email I receive and try to answer them all!
Current Market Outlook:
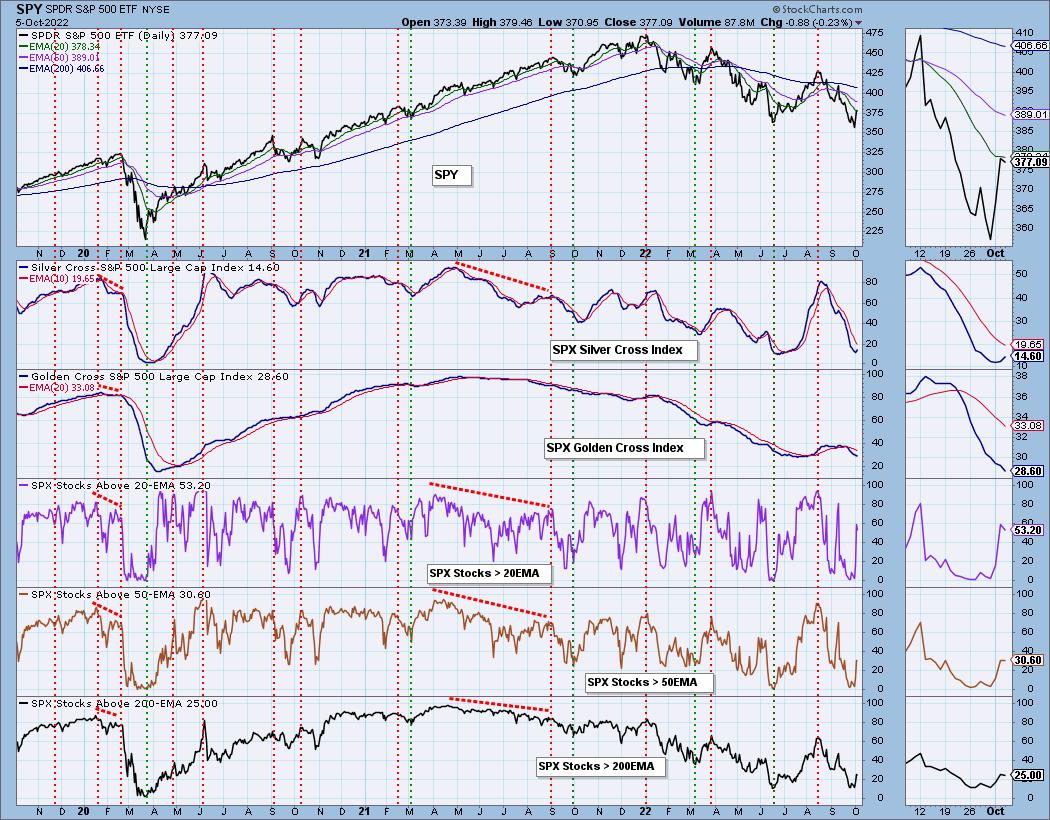
Market Environment: It is important to consider the odds for success by assessing the market tides. The following chart uses different methodologies for objectively showing the depth and trend of participation for intermediate- and long-term time frames.
- The Silver Cross Index (SCI) shows the percentage of SPX stocks on IT Trend Model BUY signals (20-EMA > 50-EMA)
- The Golden Cross Index (GCI) shows the percentage of SPX stocks on LT Trend Model BUY signals (50-EMA > 200-EMA)
Don't forget that as a "Diamonds" member, you have access to our GCI/SCI curated ChartList on DecisionPoint.com. You'll find it under "Members Only" links on the left side on the Blogs and Links Page.
Here is the current chart:
Full Disclosure: I am 15% exposed, but ready to expand further to about 30% if market indicators confirm this week's rally.
I'm required to disclose if I currently own a stock I mention and/or may buy/short it within the next 72 hours.
"Technical Analysis is a windsock, not a crystal ball." - Carl Swenlin
(c) Copyright 2022 DecisionPoint.com
Watch the latest episode of DecisionPoint with Carl & Erin Swenlin on Mondays 7:00p EST or on the DecisionPoint playlist on the StockCharts TV YouTube channel here!
NOTE: The stocks reported herein are from mechanical trading model scans that are based upon moving average relationships, momentum and volume. DecisionPoint analysis is then applied to get five selections from the scans. The selections given should prompt readers to do a chart review using their own analysis process. This letter is not a call for a specific action to buy, sell or short any of the stocks provided. There are NO sure things or guaranteed returns on the daily selection of "Diamonds in the Rough."
Regarding BUY/SELL Signals: The signal status reported herein is based upon mechanical trading model signals and crossovers. They define the implied bias of the price index/stock based upon moving average relationships and momentum, but they do not necessarily call for a specific action. They are information flags that should prompt chart review. Further, they do not call for continuous buying or selling during the life of the signal. For example, a BUY signal will probably (but not necessarily) return the best results if action is taken soon after the signal is generated. Additional opportunities for buying may be found as price zigzags higher, but the trader must look for optimum entry points. Conversely, exit points to preserve gains (or minimize losses) may be evident before the model mechanically closes the signal.
Helpful DecisionPoint Links:
DecisionPoint Shared ChartList and DecisionPoint Chart Gallery
Price Momentum Oscillator (PMO)
Swenlin Trading Oscillators (STO-B and STO-V)
For more links, go to DecisionPoint.com