
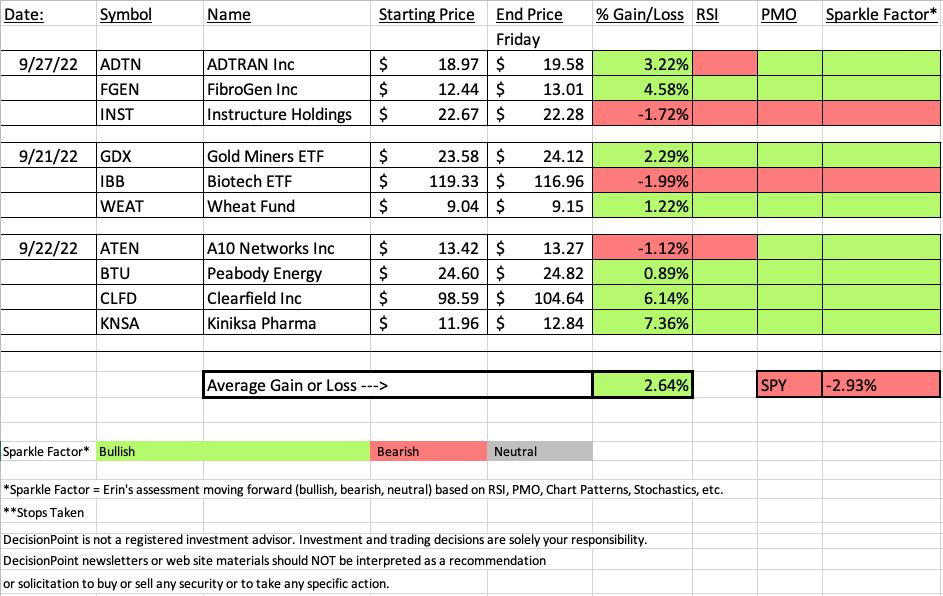
I was pleasantly surprised this morning when I found out all but one "Diamond in the Rough" was negative. However, by the end of the day, the 4% average gain of the morning was pared back to 2.64% gain with two stocks and an ETF finishing lower. The SPY struggled greatly this week finishing down -2.93% so I would say this week was a winner.
Given the first "Diamonds in the Rough" were released after the rally on Tuesday, I feel particularly good about our positive finish. The "Darling" this week turned out to be a Reader Request, Kiniksa Pharma (KNSA) which was up +7.36% for the day. My pick yesterday nearly was the Darling having risen 6.14% today. As far as ETF Day, Gold Miners (GDX) was the clear winner.
Remember there will be no Diamond Mine trading room on Friday as I will be at ChartCon in Seattle. I believe my ChartCon trading room will be on Saturday.
Have a great weekend!
Good Luck & Good Trading,
Erin

TODAY'S RECORDING LINK (9/30/2022):
Topic: DecisionPoint Diamond Mine (9/30/2022) LIVE Trading Room
Start Time: Sept 30, 2022 09:00 AM
Passcode: Sept#30th
NO DIAMOND MINE on October 7th
Save the registration confirmation email with login instructions in case Zoom doesn't notify you in time.
** There will be no Diamond Mine trading room on 10/7 **

Our latest DecisionPoint Trading Room recording:
A few items about the spreadsheet: I've put on the spreadsheet whether the RSI is positive (green) or negative (red). The PMO column tells you if it is rising (green) or falling (red). Finally I've added my own "Sparkle Factor" that gives you my assessment going forward, bullish (green), bearish (red) or neutral (gray). The Sparkle Factor is basically my thoughts on whether I expect it to rise or fall. A neutral means it could really go either way so it could be added to a watch list. If you're in a stock I consider "neutral" going forward, the ball is in your court.
Darling:
Kiniksa Pharmaceuticals, Ltd (KNSA)
EARNINGS: 10/31/2022 (BMO)
Kiniksa Pharmaceuticals Ltd. is a biopharmaceutical company, which engages in discovering, acquiring, developing, and commercializing therapeutic medicines for patients suffering from debilitating diseases with significant unmet medical need. Its products include Rilonacept, Mavrilimumab, Vixarelimab, and KPL-404. The company was founded by Sanj K. Patel, Stephen Frank Mahoney, Krisha S. Mahoney, Thomas W. Beetham, Christopher Heberlig, Carsten Boess, Rasmus Holm-Jorgensen, Gregory Alex Grabowksi, Aaron Isadore Young, Eben P. Tessari, Jennifer Lynne Mason and Mickenzie Elizabeth Gallagher in July 2015 and is headquartered in Lexington, MA.
Predefined Scans Triggered: Hollow Red Candles and Moved Above Ichimoku Cloud.
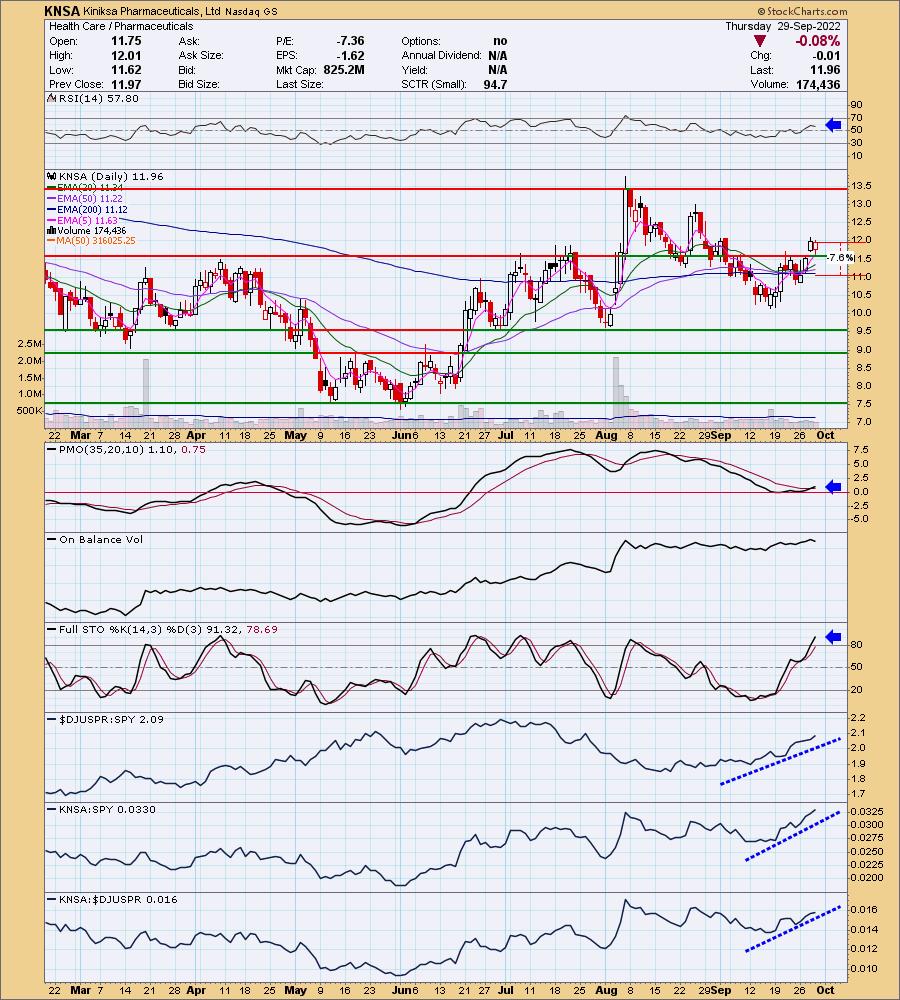
Below are the commentary and chart from yesterday (9/29):
"KNSA is unchanged in after hours trading. I like yesterday's breakout move and today's bullish hollow red candlestick. This rally looks legit. The RSI is positive and the PMO just triggered a crossover BUY signal. Stochastics are above 80 and rising strongly. Relative strength is excellent across the board. I've set a reasonable stop below all three EMAs at 7.6% or around $11.05."
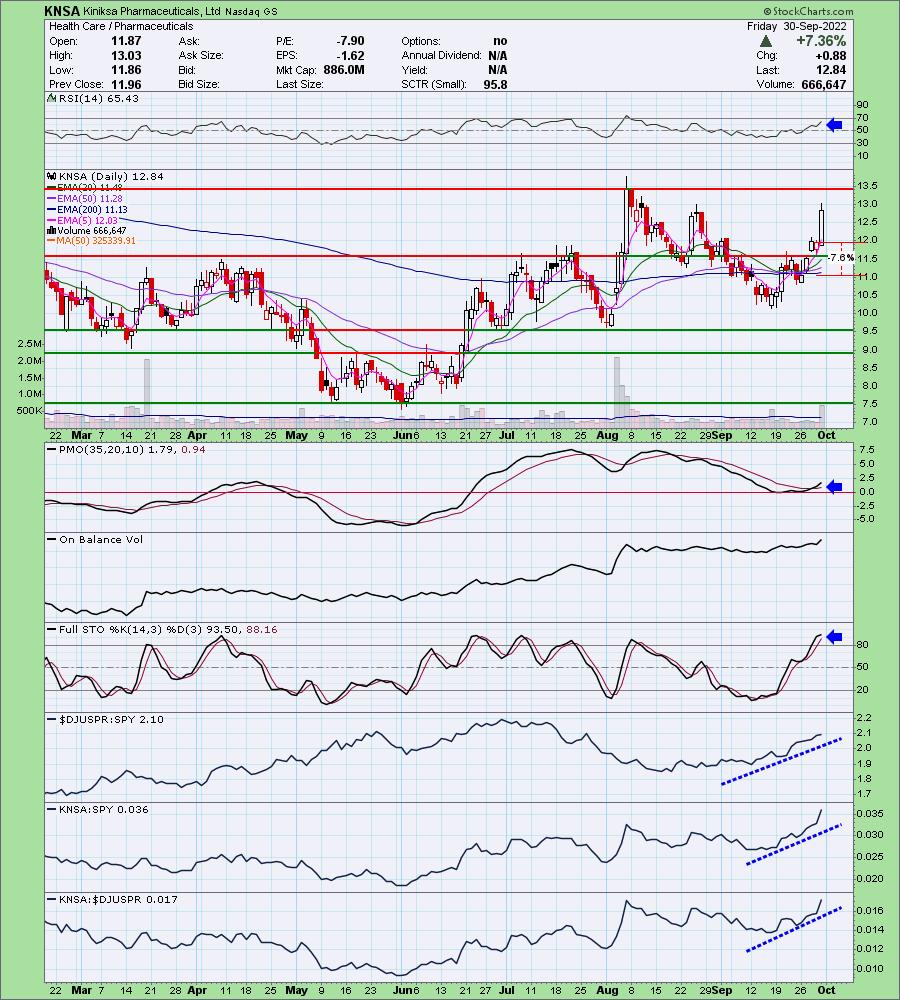
Here is today's chart:
This one became the "Darling" with just one day of trading. Clearly this isn't a normal occurrence, but we'll take it! With this strong move higher, KNSA is already testing overhead resistance. The last top at the end of August didn't get all the way up to resistance. It followed the playbook by declining afterward. Similarly, the September bottom didn't have to test support before reversing. The expectation is a rally and that's what we got. I'd like to at least see overhead resistance hit at that first August top tested, but, given the strong move today and still highly positive indicators, I believe this one will breakout easily.
Don't forget, on Thursdays I look at reader-requested symbols, so shoot me an email at erin@decisionpoint.com. I read every email I receive and try to answer them all!
Dud:
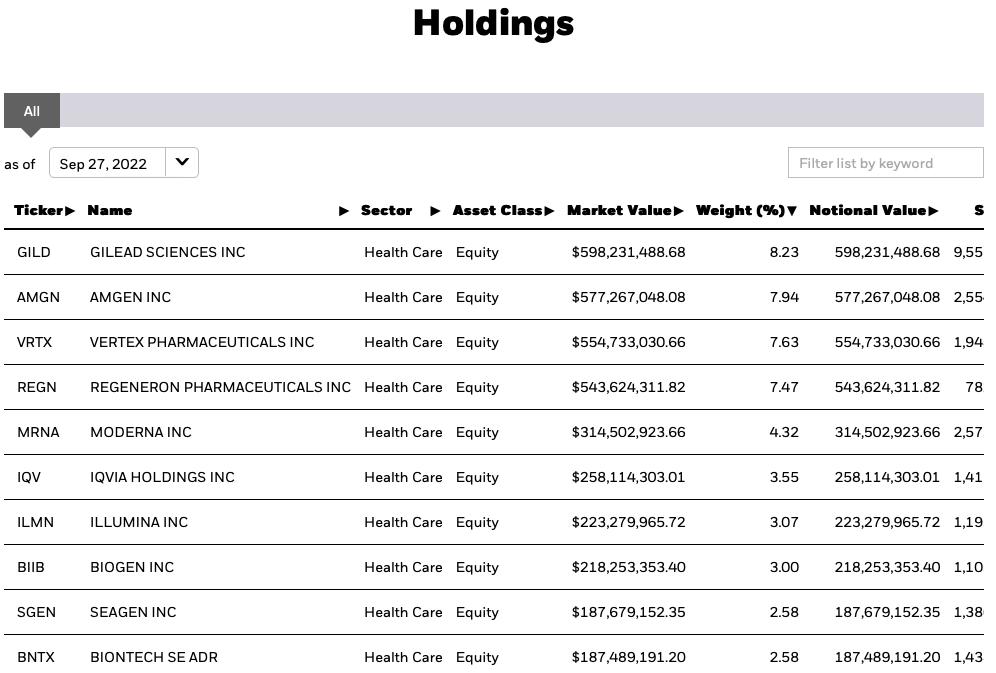
iShares Nasdaq Biotechnology ETF (IBB)
EARNINGS: N/A
IBB tracks the performance of a modified market-cap-weighted index of US biotechnology companies listed on US exchanges. For more information click HERE.
Predefined Scans Triggered: Elder Bar Turned Green.
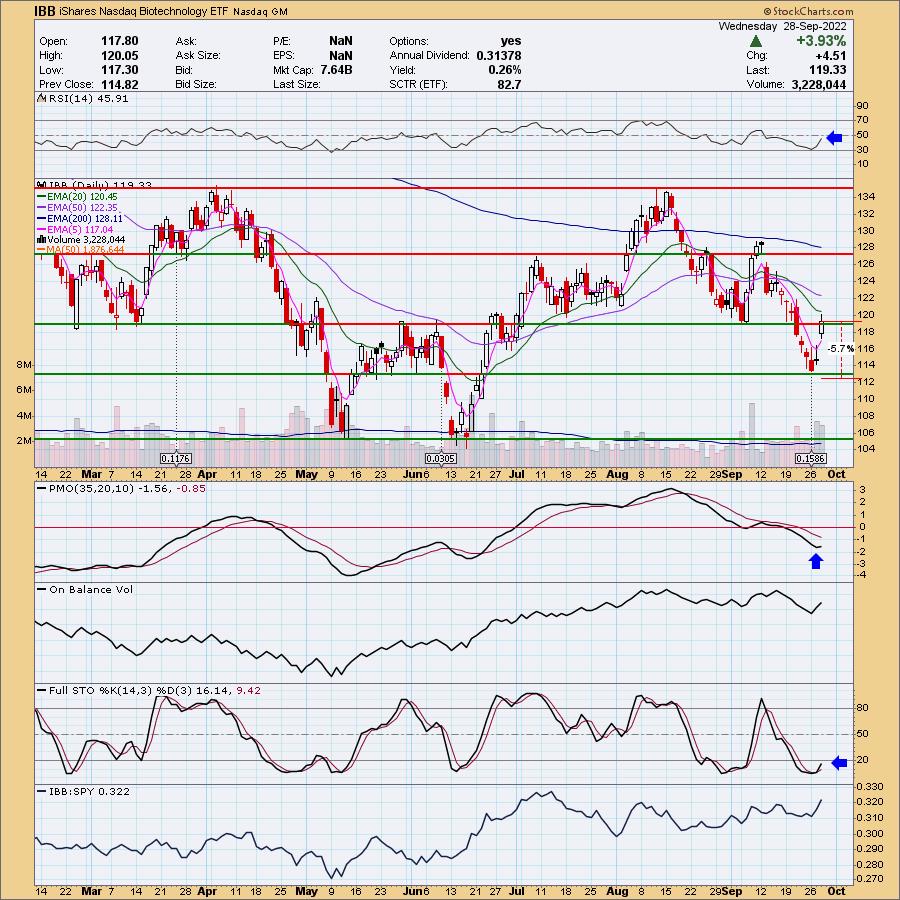
Below are the commentary and chart from Wednesday, 9/28:
"IBB is up +0.06% in after hours trading. It picked a great place to bottom, right at the late May early June lows. More importantly it recaptured support at the March low. The RSI is nearing positive territory and rising. The PMO has turned back up and Stochastics are rising. It is starting to increase its outperformance. The stop can be set thinly at 5.7% around $128.53."
Here is today's chart:
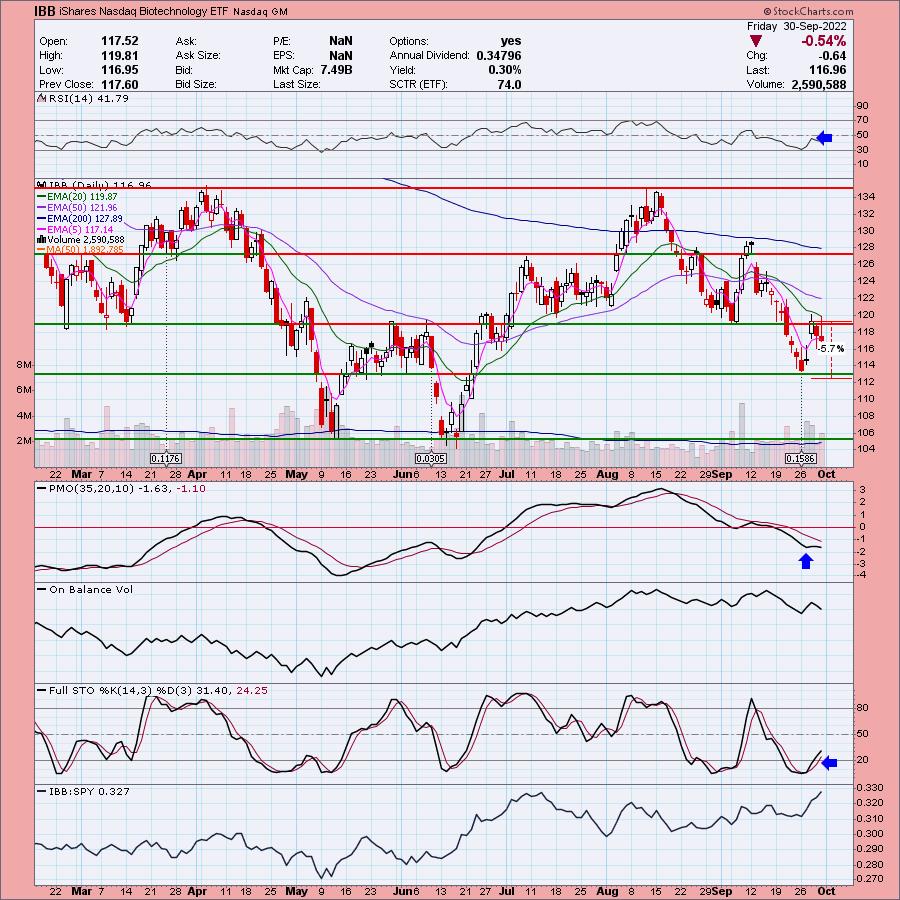
The big problem here is that the breakout saw zero follow-through. The 20-day EMA is also acting as strong resistance. It's only down 1.99% since Wednesday and admittedly I do like the Healthcare sector (XLV), so while this one doesn't look appetizing now, I expect it will after a test and likely reversal at $113. The RSI never hit positive territory and the PMO has now topped beneath its signal line which is very bearish. This one needs a bit of work, but the chart isn't that bad.
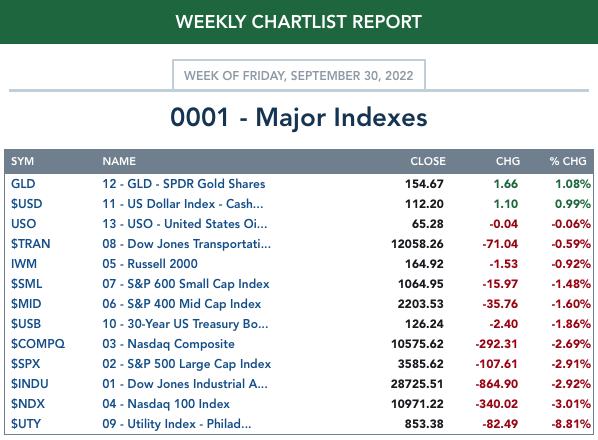
THIS WEEK's Sector Performance:
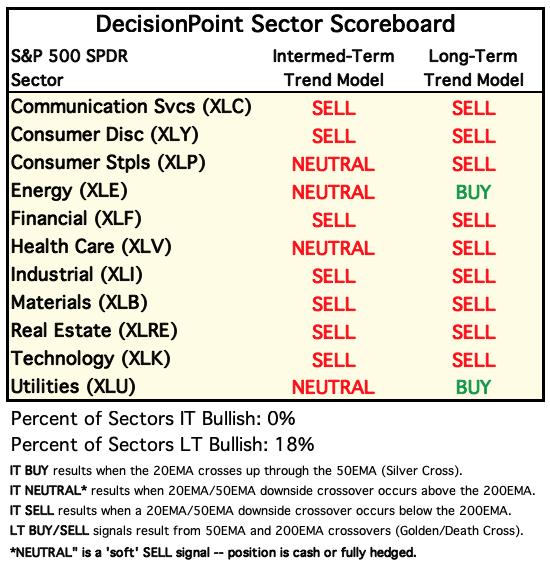
DecisionPoint Sector Scoreboard (Mechanical Trend Model Signals):
Click Here to view Carl's annotated Sector ChartList!
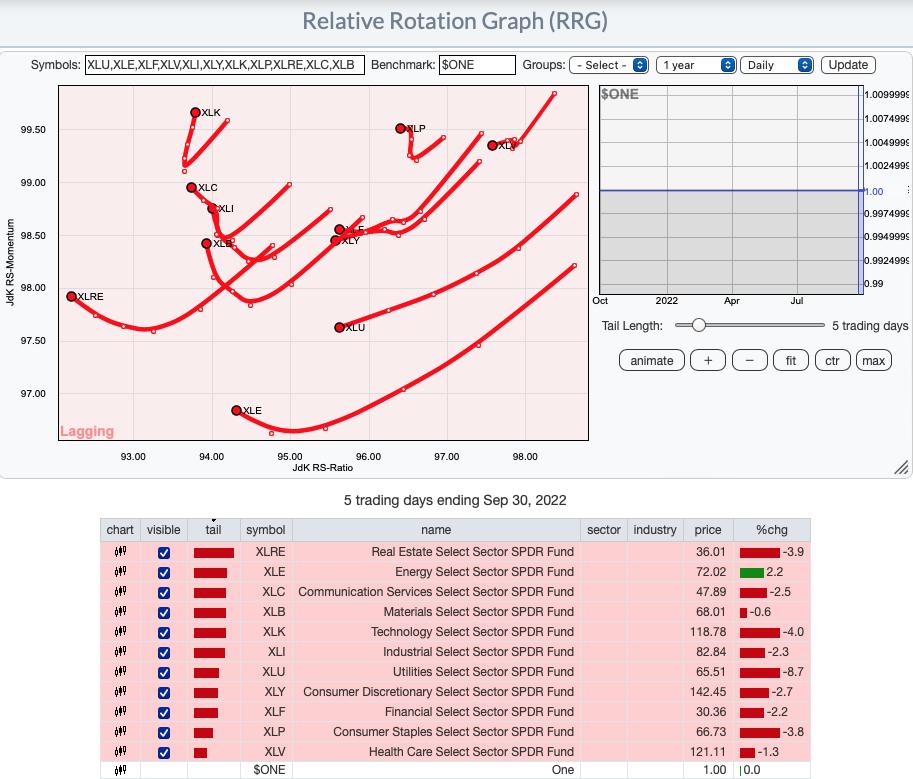
RRG® Daily Chart ($ONE Benchmark):
All sectors are in the very bearish Lagging quadrant. The best way to distinguish strength is to look at the headings. XLK is the only sector with a bullish northeast heading. This sector is not bullish. Remember all of these are in the Lagging quadrant.
The most bearish have a southwest heading, XLP, XLU, XLY and XLV. XLI isn't close behind.
XLC, XLI and XLB would be next given they have westward components to their headings.
XLE, XLRE, XLF are not terribly bearish as they are beginning to hook back around, adding northward components to their headings.
RRG® Weekly Chart ($ONE Benchmark):
The deterioration of this chart began about two weeks ago. Most were in the Improving quadrant and while they were beginning to lose their bullish northeast headings, they were still looking satisfactory.
The only bullish sector is XLE with its strong northeast heading and position in the Leading quadrant.
Most bearish are the sectors traveling southwest; in particular, XLP and XLV have now reached the very bearish Lagging quadrant. XLC, XLB and XLRE are nearest to the Lagging quadrant, but XLI and XLK are far behind.
XLY and XLU are within the Leading quadrant, but are breaking down. XLY is likely to land back in the Improving quadrant, while XLU is likely going to find itself in the Weakening quadrant.
Overall it is a very bearish RRG with the exception of XLE.
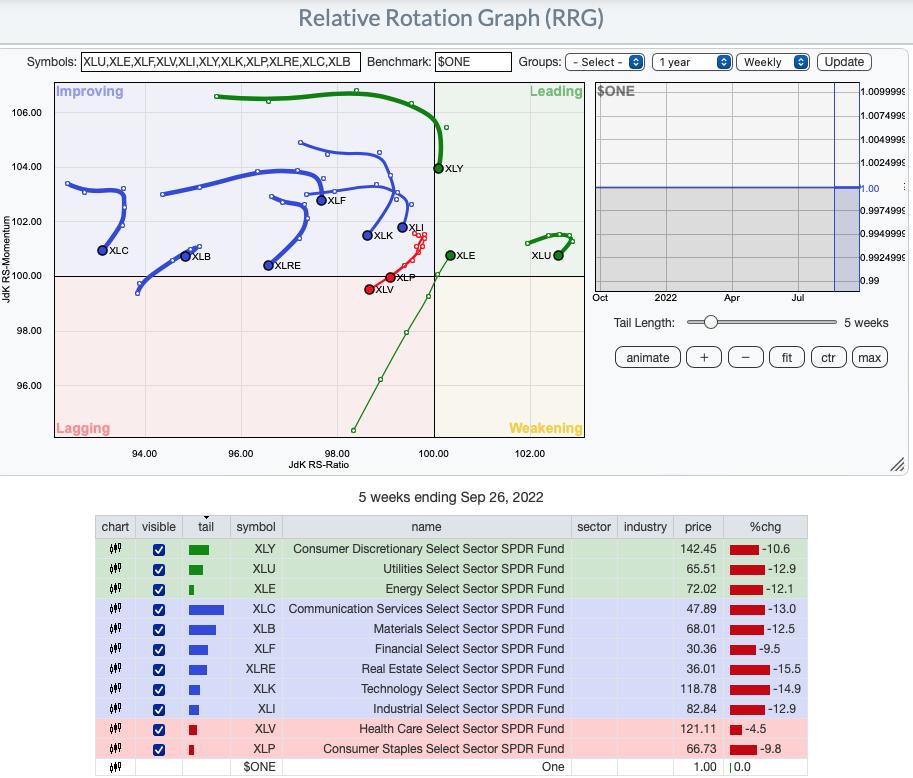
RRG® charts show you the relative strength and momentum for a group of stocks. Stocks with strong relative strength and momentum appear in the green Leading quadrant. As relative momentum fades, they typically move into the yellow Weakening quadrant. If relative strength then fades, they move into the red Lagging quadrant. Finally, when momentum starts to pick up again, they shift into the blue Improving quadrant.
CLICK HERE for an animated version of the RRG charts.
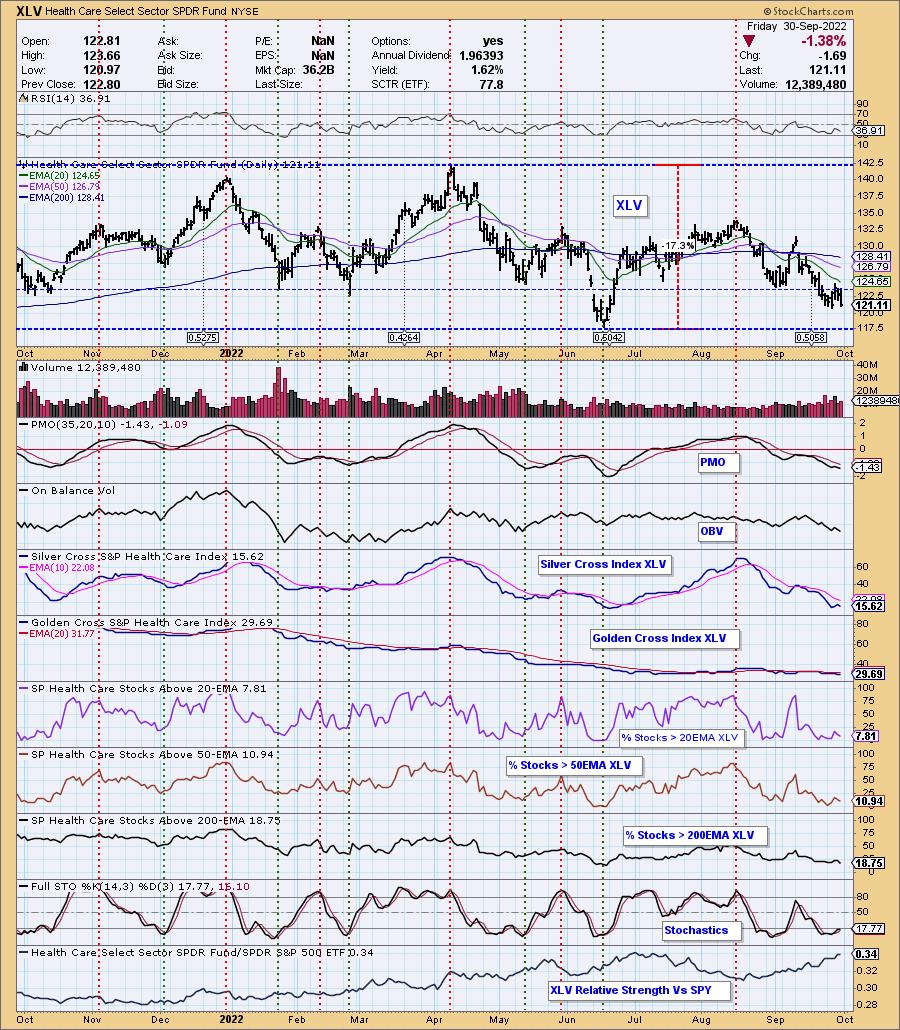
Sector to Watch: Healthcare (XLV)
XLV is considered a "defensive" sector, but with the prevalence of Biotechs, it isn't a completely defensive area of the market. Here's a good lesson. Notice the relative strength line (bottom window) and how it has been rising strongly and steadily. Since topping in August when the relative strength line began rising, XLV has lost about 9.5%. Outperformance doesn't always equal a rally. None of the sectors look that great, but XLV seems the most promising to me with XLE being a close second. In any case, I really can't point to anything particularly bullish on the chart except relative performance and Stochastics. Unlike last week though, I'm not ready to short anything. The market will likely continue lower, but it is very overdue for a rally and I wouldn't want to get caught flat-footed.
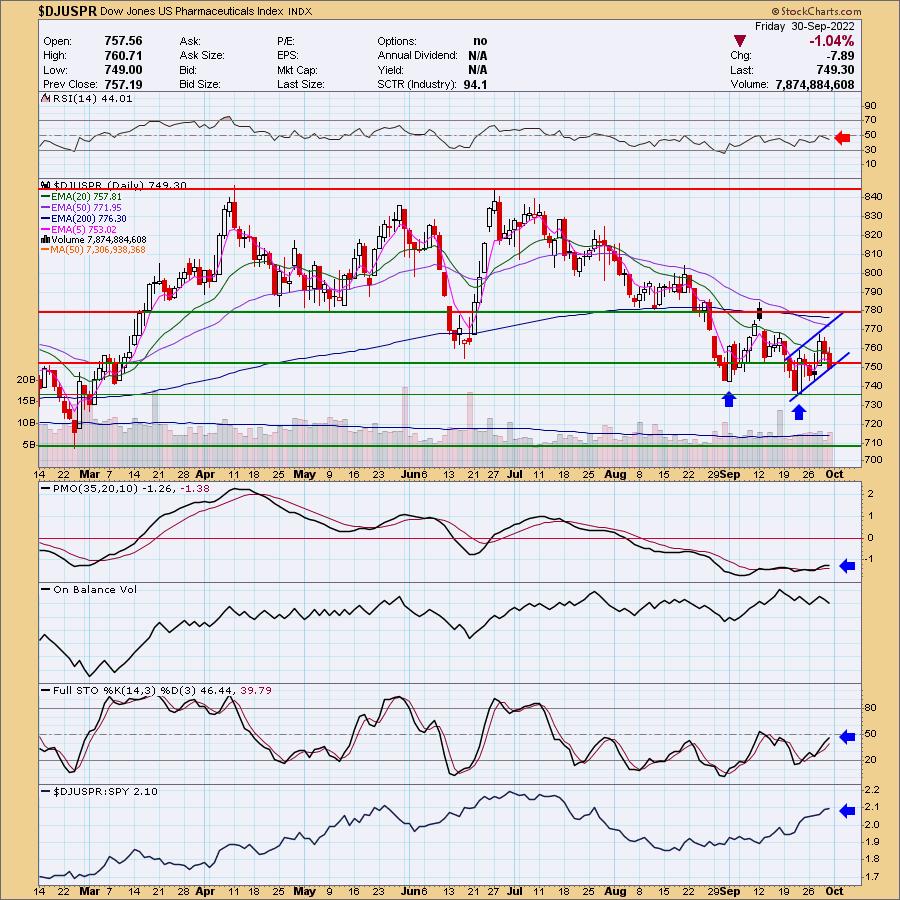
Industry Group to Watch: Pharmaceuticals ($DJUSPR)
I nearly picked Coal as the one to watch (symbols mined today were BTU and METC), but its chart is slightly less bullish than Pharma in my opinion. There is a bullish double-bottom that is still there. As long as the rising trend channel holds up, I believe the pattern is still valid. Pharma still ain't good, but there is promise, particularly when you look at some of the individual stocks in this group. Stocks we picked out this morning were CORT, RDY, CPRX and KNSL.
Go to our Sector ChartList on DecisionPoint.com to get an in-depth view of all the sectors. On StockCharts.com you can find the Industry Summary.
Have a great weekend! Good Luck & Good Trading!
- Erin
erin@decisionpoint.com
Full Disclosure: I'm 15% exposed.
Watch the latest episode of DecisionPoint with Carl & Erin Swenlin on Mondays 7:00p EST or on the DecisionPoint playlist on the StockCharts TV YouTube channel here!
Technical Analysis is a windsock, not a crystal ball. --Carl Swenlin
NOTE: The stocks reported herein are from mechanical trading model scans that are based upon moving average relationships, momentum and volume. DecisionPoint analysis is then applied to get five selections from the scans. The selections given should prompt readers to do a chart review using their own analysis process. This letter is not a call for a specific action to buy, sell or short any of the stocks provided. There are NO sure things or guaranteed returns on the daily selection of "diamonds in the rough."
Helpful DecisionPoint Links:
DecisionPoint Shared ChartList and DecisionPoint Chart Gallery
Price Momentum Oscillator (PMO)
Swenlin Trading Oscillators (STO-B and STO-V)
(c) Copyright 2022 DecisionPoint.com