
I can tell the market is getting more healthy strictly based on the number of Reader Requests today. It has been a few weeks since I didn't have to add a few stocks of mine own. And, I must say that the requests were really good too! Some are certainly better than others, but I would say all of them should be reviewed if you have the time. I try to include at least one from each subscriber who sends in requests.
There were a few with high volatility and in industry groups that I'm not thrilled with. Pay attention to relative strength if you step into the high volatility arena. Remember, half of a stock's price action is due to what the sector and industry group are doing. Quite a few were overbought but many of the requests are breaking out. Again, I would look at all of them.
This looks like a pretty good rally setting up, but I remain cautious. My exposure is the same and I did keep my hedges... for now. In the meantime, I may widen my exposure on the buy-side at the same time. I want to see a bit more follow-through to this rally before I kick my hedges to the curb.
Tomorrow is the Diamond Mine Trading Room. Remember the registration and recording links are below the Diamonds logo. If you can't make it, send me your symbol requests via email and I'll include it at the end when I do them.
Good Luck & Good Trading!
Erin
Today's "Diamonds in the Rough": ACET, IBKR, SONO and UEC.
Other Requests: FUBO, RXRX, DCPH, EVH, GGAL, IMRX, LTHM, LULU and SGML.

RECORDING LINK (9/2/2022):
Topic: DecisionPoint Diamond Mine (9/2/2022) LIVE Trading Room
Start Time: Sept 2, 2022 09:00 AM
Meeting Recording Link
Passcode: Sept#2nd
REGISTRATION For Friday 9/9 Diamond Mine:
When: Sep 9, 2022 09:00 AM Pacific Time (US and Canada)
Topic: DecisionPoint Diamond Mine (9/9/2022) LIVE Trading Room
Register in advance for this webinar HERE
Save the registration confirmation email with login instructions in case Zoom doesn't notify you in time.

There was no trading room as Monday was a holiday so here is the last recording.
Welcome to DecisionPoint Diamonds, wherein I highlight ten "Diamonds in the Rough" per week. These are selected from the results of my DecisionPoint Scans, which search for stocks that could benefit from the trend and condition of the market. Remember, these are not recommendations to buy or sell, but are the most interesting of the stocks that surfaced in my scans. My objective is to save you the work of the initial, tedious culling process, but you need to apply your own analysis to see if these stocks pique your interest as well. There are no guaranteed winners here!
"Predefined Scans Triggered" are taken from StockCharts.com using the "Symbol Summary" option instead of a "SharpChart" on the workbench.
Adicet Bio, Inc. (ACET)
EARNINGS: 11/9/2022 (BMO)
Adicet Bio, Inc. is a biotechnology company, which engages in the design and development of off-the-shelf allogeneic gamma delta T cell therapies for cancer and other diseases. The company was founded by Aya Jakobovits in November 2014 and is headquartered in Boston, MA.
Predefined Scans Triggered: New CCI Buy Signals, Moved Above Upper Bollinger Band and P&F Double Top Breakout.
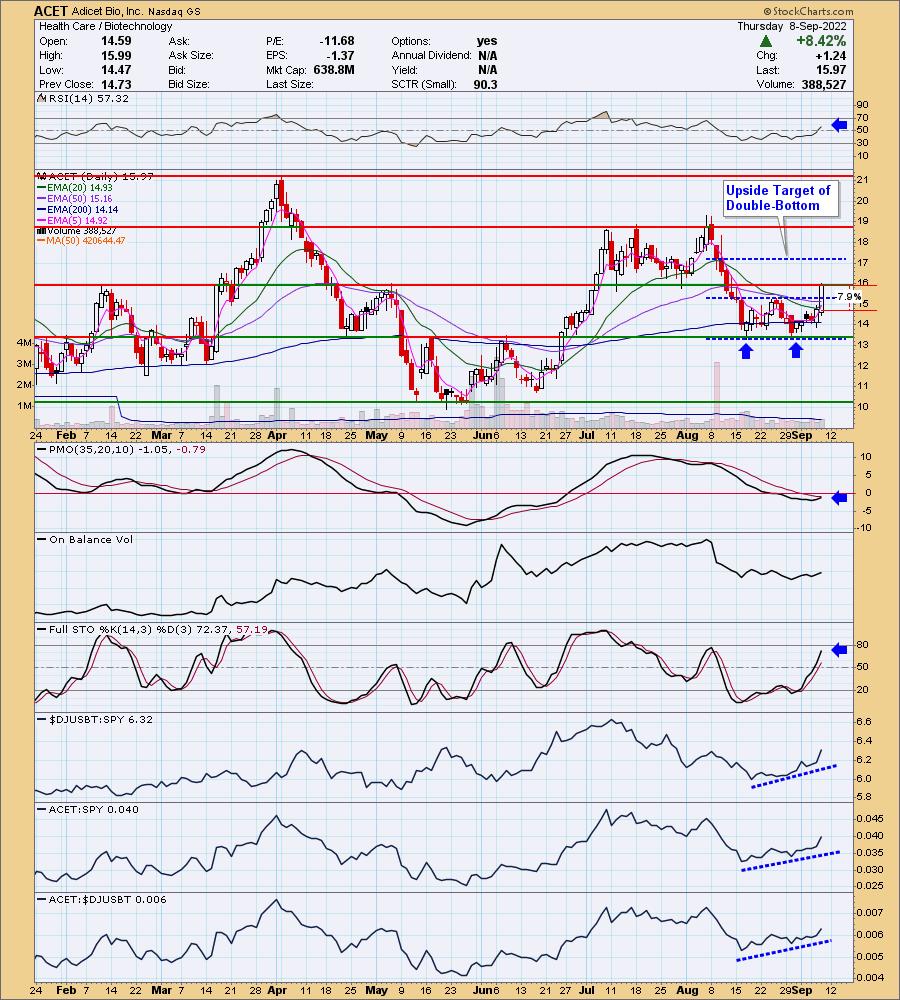
ACET is up +1.50% in after hours trading. I'm not surprised based on the chart. I covered ACET on March 17th 2022. A brief review and I see that though the position is closed, it was up over 27% at the high. We have a double-bottom pattern that has been confirmed with a decisive move (3%+) above the confirmation line. The minimum upside target is just above $17, but I would look for it to at least test resistance at the August top. Carl would probably like this chart as we are seeing a brand new PMO crossover BUY signal in oversold territory about to trigger. Carl thinks I wait too long for confirmations lol. The RSI is positive and Stochastics are rising and should get above 80 soon. Relative strength is very good. I was thinking we'd see a pullback toward the breakout point, but based on after hours trading, maybe not. If I had one wish, it would be to see volume confirming this move. While it was high, it was below the 50-day SMA. I've set the stop below the 20-day EMA at 7.9% around $14.71.
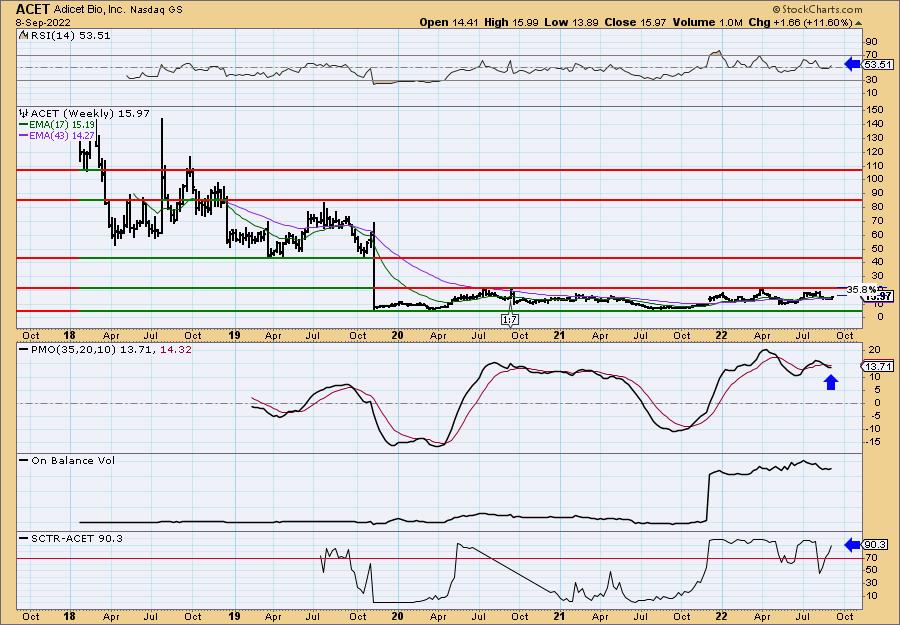
This one has been in a trading range or basing pattern for almost three years. If it can reach the top of that range, it would be an over 35% gain. I think that is entirely possible given the positive weekly RSI and strong SCTR. The weekly PMO isn't confirming this yet, but it has decelerated.
Interactive Brokers Group, Inc. (IBKR)
EARNINGS: 10/18/2022 (AMC)
Interactive Brokers Group, Inc. operates as an investment holding company, which engages in broker or dealer and proprietary trading businesses. It operates through the following segments: Electronic Brokerage and Corporate. The Electronic Brokerage segment is a direct market access broker, which serves the customers of both traditional brokers and prime brokers. The company was founded by Thomas Pechy Peterffy in 1977 and is headquartered in Greenwich, CT.
Predefined Scans Triggered: Moved Above Upper Bollinger Band and P&F Double Top Breakout.
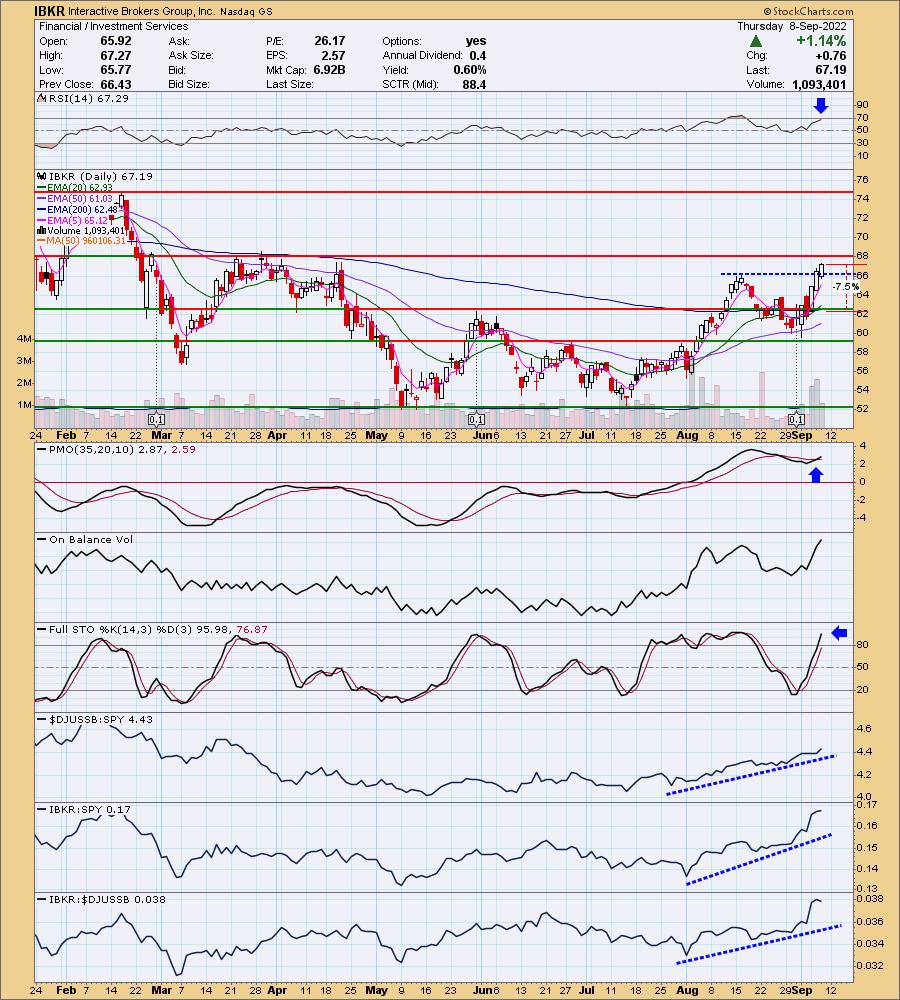
IBKR is up +0.16% in after hours trading. I love today's breakout and follow-through on this rally. We are getting close to overhead resistance, so I might wait until it is safely above $68. It should get there. The RSI is positive and not yet overbought. The PMO just gave us a positive crossover BUY signal. Volume IS coming in on this one. The OBV reached above past highs just like price which is an excellent confirmation. Stochastics are above 80. Relative strength is excellent with IBKR actually accelerating it even more this week against the group and SPY. I've set the stop at 7.5% or around $62.15.
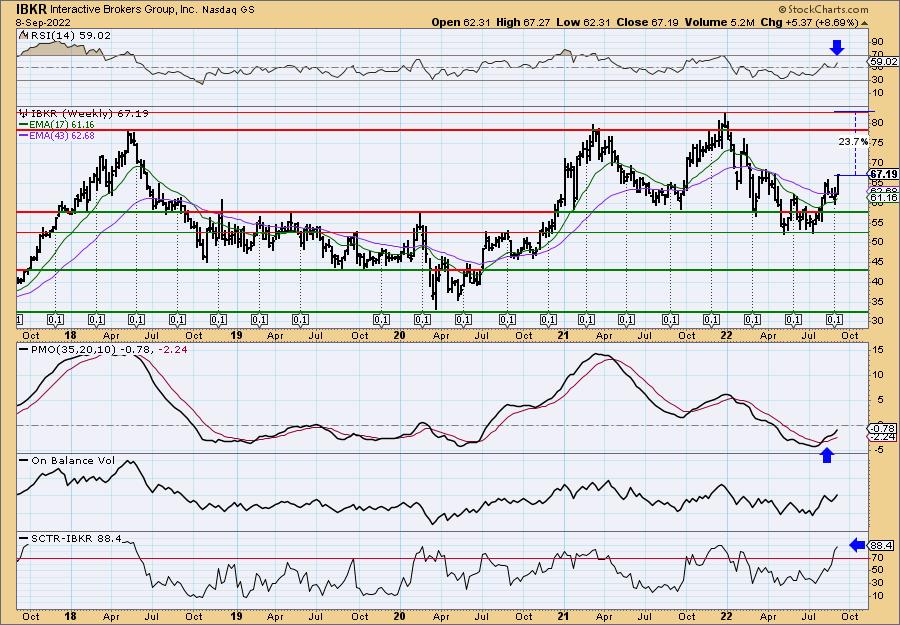
The weekly chart looks great too. The weekly RSI is positive and the weekly PMO is on an oversold BUY signal. It's also getting close to moving above the zero line. The SCTR is very good suggesting it is in the top 12% of mid-caps. If it can reach overhead resistance at the 2021 high, it would be an over 23% gain.
Sonos Inc. (SONO)
EARNINGS: 11/16/2022 (AMC)
Sonos, Inc. engages in the provision of multi-room wireless smart home sound systems. It supports streaming services around the world, providing customers with access to music, Internet radio, podcasts and audiobooks, with control from Android smartphones, iPhone or iPad. The company was founded by Mai Trung, John MacFarlane, Craig A. Shelburne and Thomas S. Cullen in August 2002 and is headquartered in Santa Barbara, CA.
Predefined Scans Triggered: Elder Bar Turned Green, Bullish MACD Crossovers, Parabolic SAR Buy Signals and P&F Double Bottom Breakout.
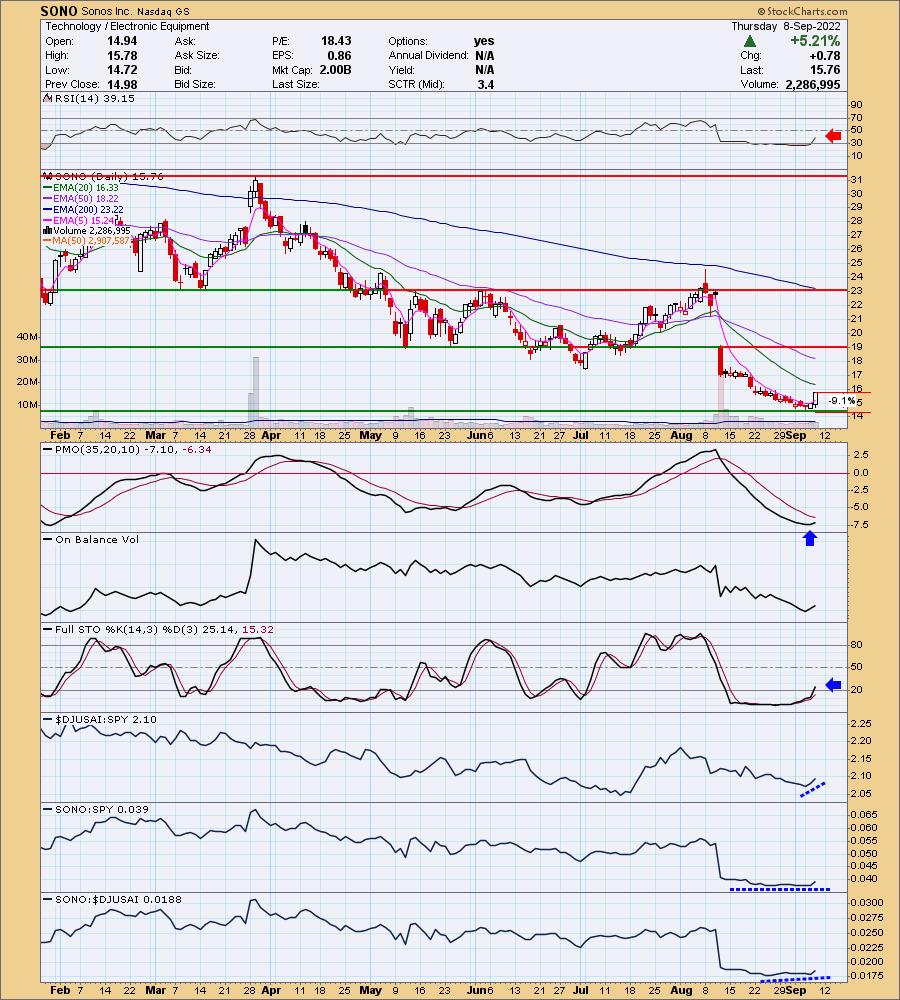
SONO is down -0.95% in after hours trading which does give me pause. It is also in Technology and very beat down. The chart is shaping up, but this one is definitely on the risky side for a "Diamond in the Rough". This is not to say the chart is bad. On the contrary it is shaping up nicely; it is just going to have to fight downside pressure from simply being a Technology stock.
I own a Sonos system and absolutely love it! The only problem is that their products last forever. The need to buy updated speakers isn't really necessary as all of the inner components are solid and they update the software continuously to help you get the best sound quality. They have moved into the streaming space with their own music service, but that service is not nearly as robust as Spotify, LivexLive and Amazon Music (we use all three as we LOVE music on our outdoor patio and we like the ability to make our own playlists. Sonos music service doesn't offer that feature). The other drawback is that you can't easily play what is on your phone. At least with iPhone you can only do this through Apple Music (which I detest) or using an AppleTV. This is anecdotal, but just something I thought I would share.
The RSI is rising strongly, as it should given the force behind yesterday and today's big moves. It is still in negative territory though. The PMO has begun to rise in oversold territory. The OBV is still confirming the downtrend and I would've liked to have seen more volume. Stochastics are rising again, but remain in negative territory. You can see that the industry group hasn't picked up yet, though it is trying. Sonos is one to travel with the market based on its flat relative strength. If the bear market resumes, you won't want this one. The stop is set deeply so it can line up with support at 52-week lows. It also lets you know the risk involved. 9.1% stop is around $14.33.
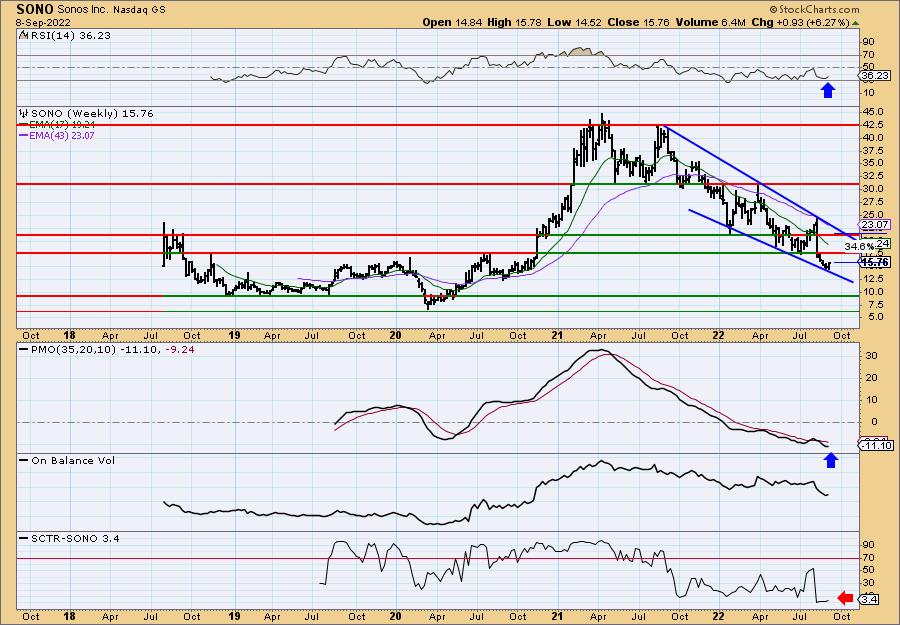
If this one does get going, it could go a very long way given the large bullish falling wedge. However, if the bear market resumes, it won't get close. I have listed a possible upside target at the IPO price of 34.6%. The weekly RSI is still negative, but rising. The weekly PMO is on a SELL signal, but is decelerating for a possible bottom. The SCTR is about as bad as you can get mainly because it is so beat down.
Uranium Energy Corp. (UEC)
EARNINGS: 10/26/2022 (AMC)
Uranium Energy Corp. engages in the provision of uranium mining and related activities. It includes the exploration, pre-extraction, extraction, and processing of uranium concentrates. It operates through the following geographical segments: United States, Canada, and Paraguay. The company was founded by Alan P. Lindsay and Amir Adnani on May 16, 2003 and is headquartered in Vancouver, Canada.
Predefined Scans Triggered: Elder Bar Turned Green and P&F Double Top Breakout.
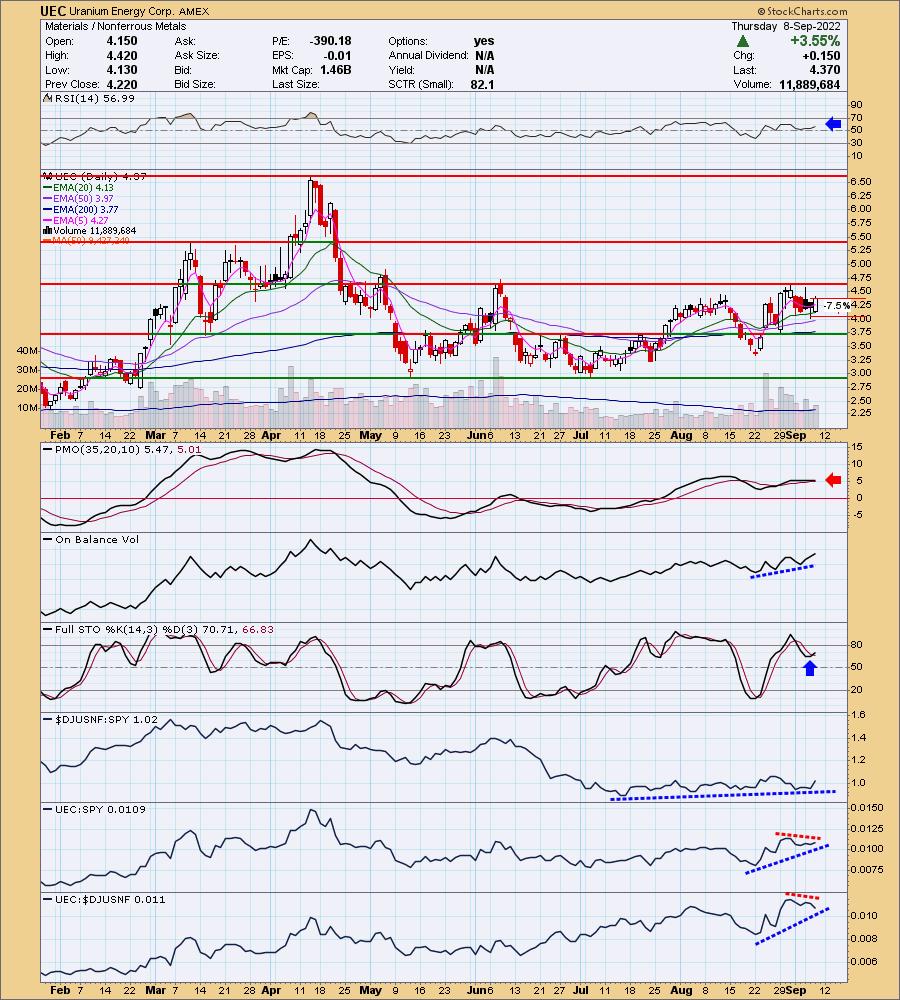
UEC is up +0.23% in after hours trading. I covered it on June 9th 2022 which was terrible timing, but we know how bad June was. This isn't my typical chart, but I am very bullish on Uranium (URA) which I presented yesterday. It will likely be added to my portfolio tomorrow and this is another way to play it so I'm forgiving the declining PMO. The RSI is positive and the OBV is confirming an uptrend. Stochastics have turned around in positive territory. The group hasn't faired well, but it includes a lot of other metals that aren't as bullish. UEC tends to outperform. I will say that the past week or so it hasn't shown great performance. The stop is set near the 50-day EMA and could be set a bit more deep toward the 50-day EMA. 7.5% is around $4.04.
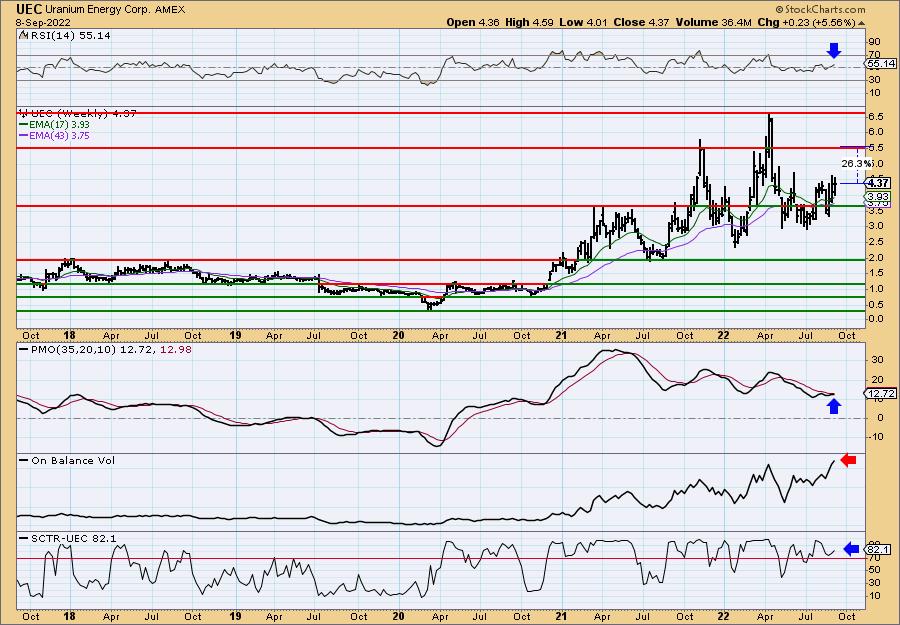
The weekly chart is more bullish. The weekly RSI is positive and the weekly PMO is nearing a crossover BUY signal. There is a problem with the OBV as it is showing a reverse divergence. That means there has been a lot of volume which has caused the OBV to make new highs. However, price is not making new highs itself. Price should follow volume and it isn't. The SCTR is strong at 82.1%. If it can reach the 2021 closing high it would be an over 26% gain.
Don't forget, on Thursdays I look at reader-requested symbols, click HERE to send me an email. I read every email I receive and try to answer them all!
Current Market Outlook:
Market Environment: It is important to consider the odds for success by assessing the market tides. The following chart uses different methodologies for objectively showing the depth and trend of participation for intermediate- and long-term time frames.
- The Silver Cross Index (SCI) shows the percentage of SPX stocks on IT Trend Model BUY signals (20-EMA > 50-EMA)
- The Golden Cross Index (GCI) shows the percentage of SPX stocks on LT Trend Model BUY signals (50-EMA > 200-EMA)
Don't forget that as a "Diamonds" member, you have access to our GCI/SCI curated ChartList on DecisionPoint.com. You'll find it under "Members Only" links on the left side on the Blogs and Links Page.
Here is the current chart:
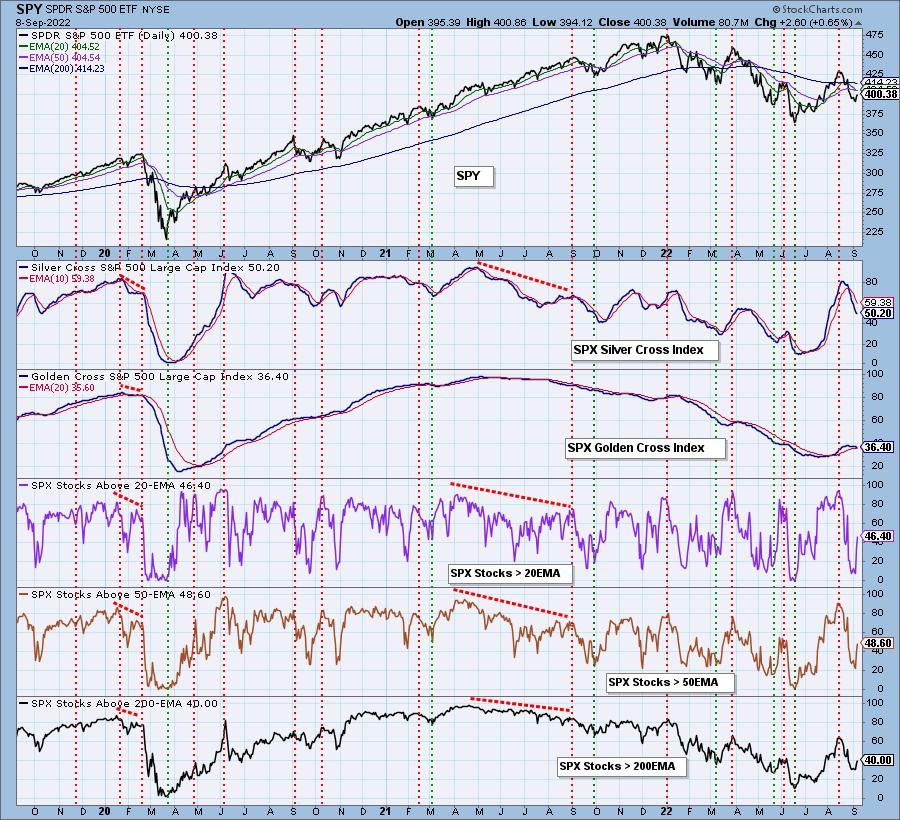
Full Disclosure: I am 15% exposed, half of which is hedge. I may switch that up before the Diamond Mine by adding URA.
I'm required to disclose if I currently own a stock I mention and/or may buy/short it within the next 72 hours.
"Technical Analysis is a windsock, not a crystal ball." - Carl Swenlin
(c) Copyright 2022 DecisionPoint.com
Watch the latest episode of DecisionPoint with Carl & Erin Swenlin on Mondays 7:00p EST or on the DecisionPoint playlist on the StockCharts TV YouTube channel here!
NOTE: The stocks reported herein are from mechanical trading model scans that are based upon moving average relationships, momentum and volume. DecisionPoint analysis is then applied to get five selections from the scans. The selections given should prompt readers to do a chart review using their own analysis process. This letter is not a call for a specific action to buy, sell or short any of the stocks provided. There are NO sure things or guaranteed returns on the daily selection of "Diamonds in the Rough."
Regarding BUY/SELL Signals: The signal status reported herein is based upon mechanical trading model signals and crossovers. They define the implied bias of the price index/stock based upon moving average relationships and momentum, but they do not necessarily call for a specific action. They are information flags that should prompt chart review. Further, they do not call for continuous buying or selling during the life of the signal. For example, a BUY signal will probably (but not necessarily) return the best results if action is taken soon after the signal is generated. Additional opportunities for buying may be found as price zigzags higher, but the trader must look for optimum entry points. Conversely, exit points to preserve gains (or minimize losses) may be evident before the model mechanically closes the signal.
Helpful DecisionPoint Links:
DecisionPoint Shared ChartList and DecisionPoint Chart Gallery
Price Momentum Oscillator (PMO)
Swenlin Trading Oscillators (STO-B and STO-V)
For more links, go to DecisionPoint.com