
I don't believe the chop and churn is over so for the market, so while I have some interesting picks in here, I would exercise extreme caution if you are going to expand your portfolio.
I'm now eyeing Silver of all things. While reviewing for ETFs, Silver ETFs caught my eye. I'm presenting SLV. The other ETF shouldn't surprise you if you watched today's presentation at Traders Corner. If you recall, a few weeks ago only two industry groups had positive momentum, Oil Equipment & Services and Gold Miners. Well XES, the ETF for Oil Equipment & Services looks healthy.
Reader requests were all over the place. I decided to present two "iffy" reader requests in order to give you an idea on how I make my selections. They wouldn't have made the cut, but I like to include requests from everyone if I can. Fred, your list was outstanding as usual. Do not feel like you have to send in a beautiful symbol. Send me whatever you have a question on. I don't want to get too wrapped up in making Friday's spreadsheet pretty so I plan to review all different requests.
I think we are going to get hammered tomorrow in the market. Everything is down in after hours trading, including today's selection. Either this means we get a better price to get in or it will break down the charts too heavily. I'm preparing for a very 'red' spreadsheet tomorrow.
I think that covers it. Thanks for being a subscriber and your patience as I had to postpone ETF Day yesterday. I consider the "Diamonds" community as my friends so I hate letting you down.
Good Luck & Good Trading!
Erin
Today's "Diamonds in the Rough": BMEA, CHPT, NFLX, RLMD, SLV and XES.
Other Requests & ETFs: ACET, FRO, INVZ, NOG, NRP, PAGP, TALO, WTI, TSLA, COST, BXSL, DRV and EDZ.

RECORDING LINK (9/16/2022):
Topic: DecisionPoint Diamond Mine (9/16/2022) LIVE Trading Room
Start Time: Sept 16, 2022 09:00 AM
Recording LINK.
Passcode: Sept*16th
REGISTRATION For Friday 9/23 Diamond Mine:
When: Sep 23, 2022 09:00 AM Pacific Time (US and Canada)
Topic: DecisionPoint Diamond Mine (9/23/2022) LIVE Trading Room
Register in advance for this webinar HERE.
Save the registration confirmation email with login instructions in case Zoom doesn't notify you in time.
NO DIAMOND MINE on 10/7!

Here is Monday, 9/12 recording of the DecisionPoint Trading Room:
Welcome to DecisionPoint Diamonds, wherein I highlight ten "Diamonds in the Rough" per week. These are selected from the results of my DecisionPoint Scans, which search for stocks that could benefit from the trend and condition of the market. Remember, these are not recommendations to buy or sell, but are the most interesting of the stocks that surfaced in my scans. My objective is to save you the work of the initial, tedious culling process, but you need to apply your own analysis to see if these stocks pique your interest as well. There are no guaranteed winners here!
"Predefined Scans Triggered" are taken from StockCharts.com using the "Symbol Summary" option instead of a "SharpChart" on the workbench.
Biomea Fusion Inc. (BMEA)
EARNINGS: 11/2/2022
Biomea Fusion, Inc. is a biopharmaceutical company, which engages in the discovery, development, and commercialization of irreversible small molecules to treat patients with genetically defined cancers. The company was founded by Thomas Butler and Ramses Erdtmann in August 2017 and is headquartered in Redwood City, CA.
Predefined Scans Triggered: Elder Bar Turned Red and P&F Double Top Breakout.
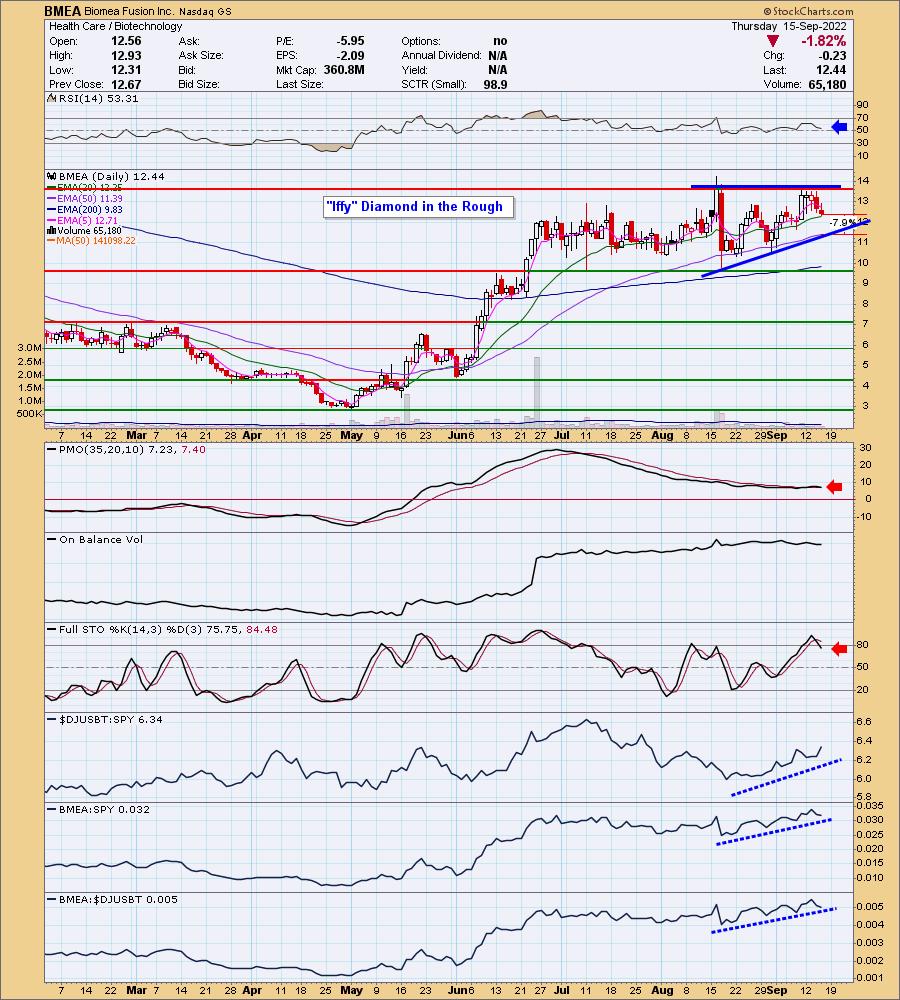
BMEA is unchanged in after hours trading. As noted in the opening two of today's "Diamonds in the Rough" are "iffy". They aren't really my cup of tea, but in both cases there are some positives. When I saw this one on the thumbnail CandleGlance, I liked the setup. We have a bullish ascending triangle and a positive RSI. My problem is the new PMO SELL signal today. I'll forgive it mainly because the PMO has been flat, so it isn't a strong SELL. What is critical is that the short-term rising trend needs to hold the pattern together. A breakdown from that means a bearish resolution to a bullish patter which is especially bearish...but we're not there yet. Relative strength studies are bullish. The stop is set below the 50-day EMA in a way that would stop you out if the rising trendline is penetrated. It's 7.9% around $11.46.
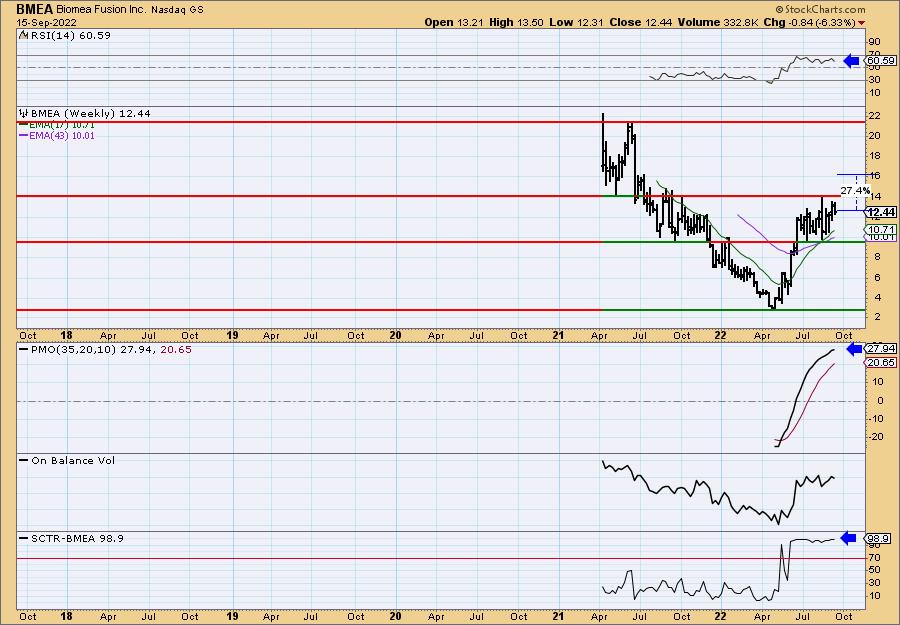
The weekly chart is encouraging. The weekly RSI is positive and the weekly PMO is rising. I particularly like that the SCTR is 98.9% suggesting real leadership. I've set the upside potential to just above $16. It will likely climb higher than that, but resistance needs to be broken in a meaningful way; I look for 3% decisive upside breakouts.
ChargePoint Holdings, Inc. (CHPT)
EARNINGS: 12/7/2022 (AMC)
ChargePoint Holdings, Inc. operates as an electric vehicle charging network provider. It designs, develops and markets networked electric vehicle charging system infrastructure and its Cloud Services enable consumers the ability to locate, reserve, authenticate and transact electric vehicle charging sessions. The firm provides an open platform providing real-time information about charging sessions and control, support and management of the networked charging systems. This network provides multiple web-based portals for charging system owners, fleet managers, drivers and utilities. The company was founded in 2007 and is headquartered in Campbell, CA.
Predefined Scans Triggered: Stocks in a New Uptrend (ADX), Moved Above Upper Bollinger Band, Stocks in a New Uptrend (Aroon), Moved Above Upper Price Channel, P&F Ascending Triple Top Breakout and P&F Double Top Breakout.
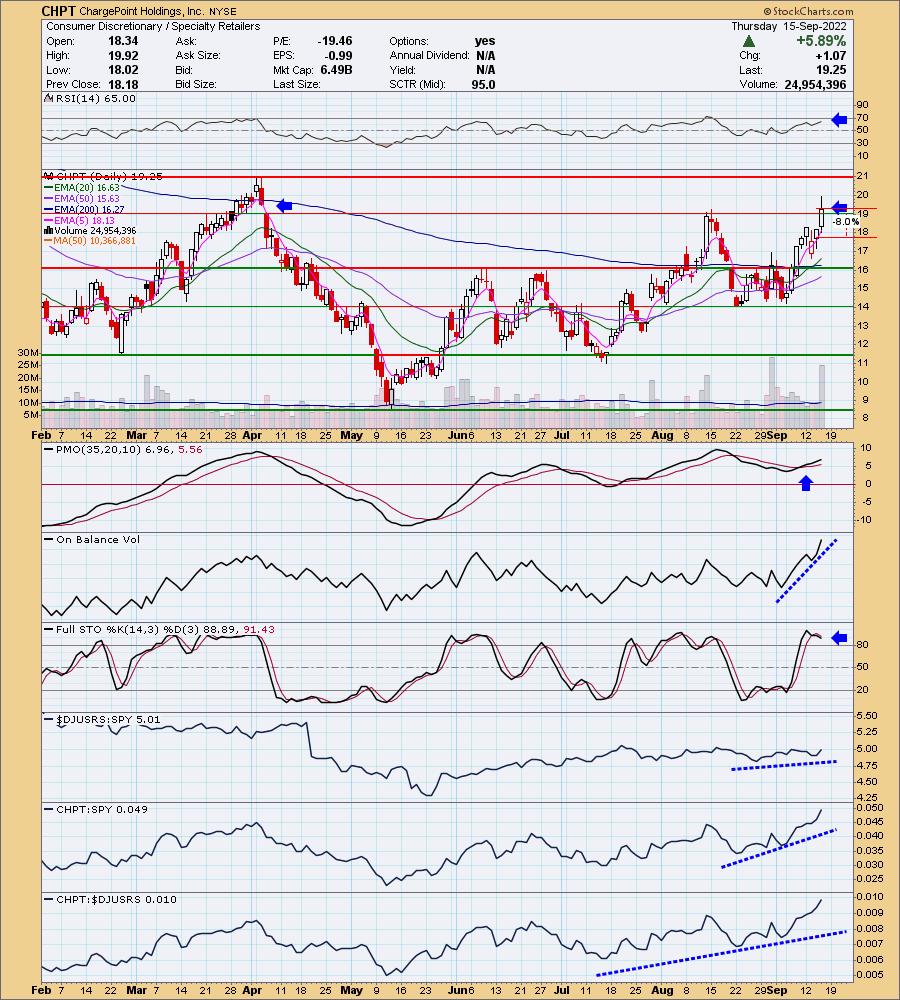
CHPT is down -1.04% in after hours trading. I like this breakout, but I don't like that it is so far down in after hours trading. I covered it last on August 11th 2022. This breakout was good, but we really need the breakout above the April high. Given the indicators, I believe we will. The RSI is positive and not overbought. The PMO is on a crossover SELL signal. Volume is coming in like crazy! The group isn't performing, but CHPT is doing fairly well. They build charging stations so this one will be a good long-term hold when we recover from this bear market. I set the stop around 8% or $17.71.
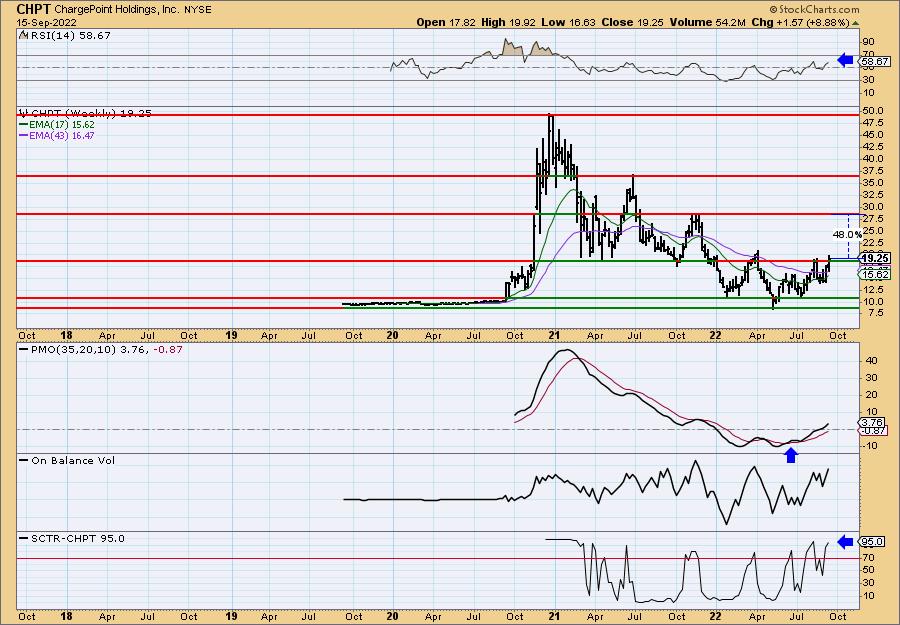
The weekly chart is VERY strong. If we weren't in a bear market, I would look at this as an intermediate-term hold. The weekly RSI is positive and not overbought. The weekly PMO is on an oversold crossover BUY signal and has vaulted the zero line. The SCTR is at a very high 95%. The upside potential is about 48%.
Netflix, Inc. (NFLX)
EARNINGS: 10/18/2022 (AMC)
Netflix, Inc. operates as a streaming entertainment service company. The firm provides subscription service streaming movies and television episodes over the Internet and sending DVDs by mail. It operates through the following business segments: Domestic Streaming, International Streaming and Domestic DVD. The Domestic Streaming segment derives revenues from monthly membership fees for services consisting of streaming content to its members in the United States. The International Streaming segment includes fees from members outside the United States. The Domestic DVD segment covers revenues from services consisting of DVD-by-mail. The company was founded by Marc Randolph and Wilmot Reed Hastings Jr. on August 29, 1997, and is headquartered in Los Gatos, CA.
Predefined Scans Triggered: Elder Bar Turned Green, Parabolic SAR Buy Signals and P&F Double Top Breakout.
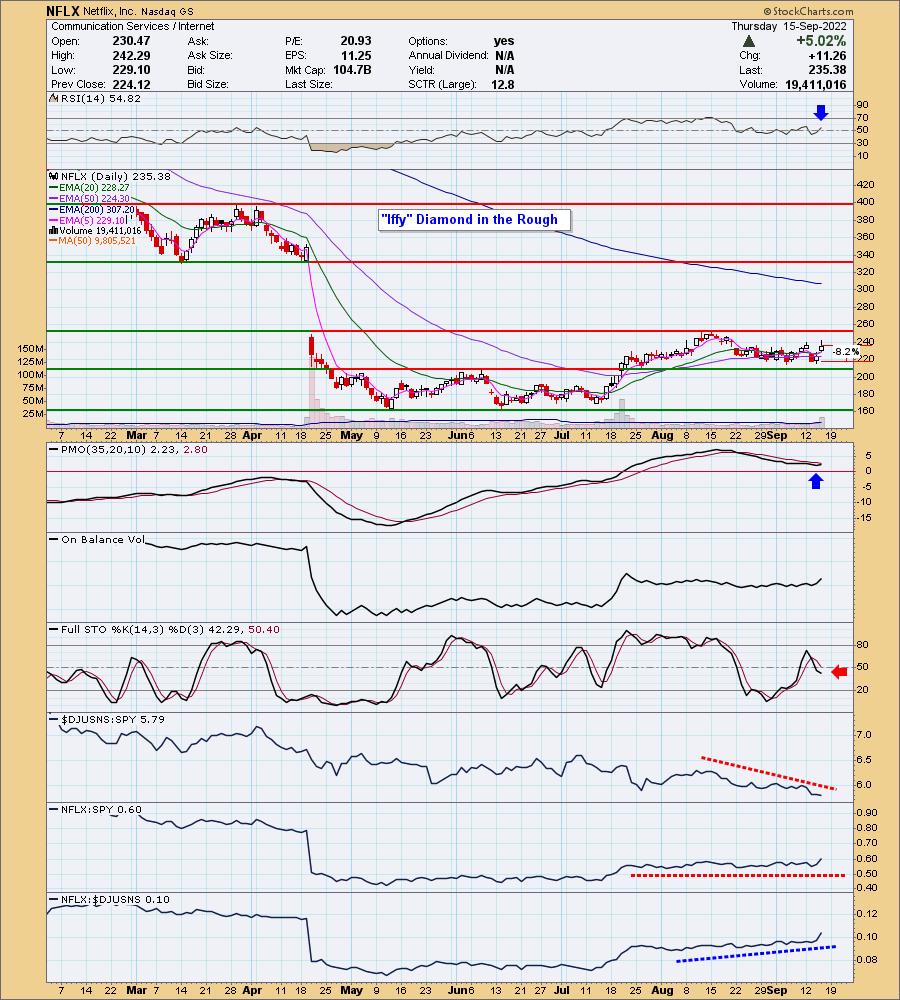
NFLX is down -1.20% in after hours trading. The last time I covered NFLX was on November 17th 2021. Here's another "iffy" one. The move today was huge so it isn't surprising to see it down in after hours trading. I'm not a fan of this sector and definitely not a fan of the industry group based on relative performance. NFLX has been in a trading channel for the past few months. The PMO has bottomed which is good and could be headed toward a crossover BUY signal. The RSI is positive and rising. Stochastics are not good, but at least they are decelerating. The stop would be very deep if we lined it up on support so I set it below the lowest closing price this week around 8.2% or $216.08.
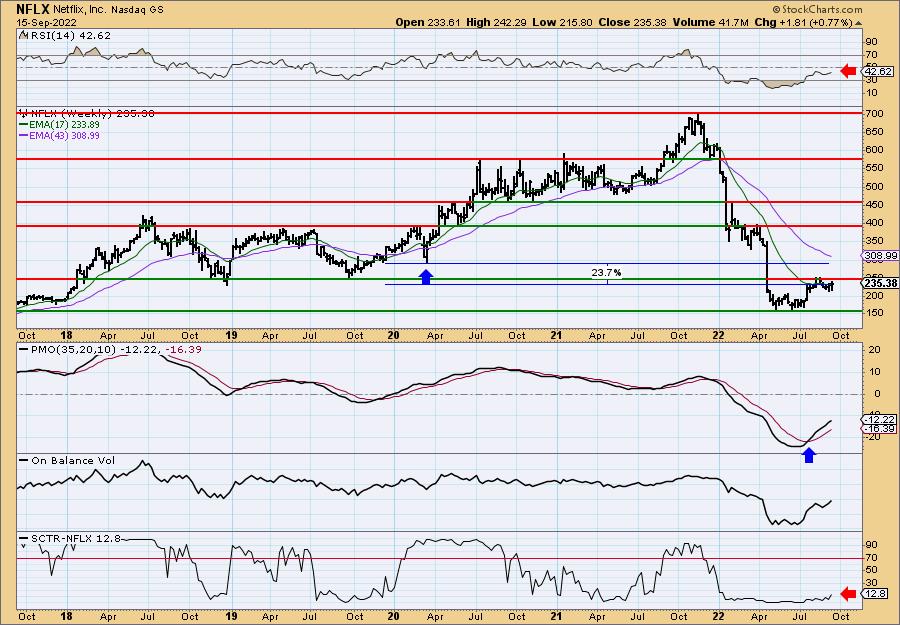
I was surprised the weekly chart was so bullish, but the SCTR of 12.8% reminded me of how beatdown this stock is. However, the RSI is rising a bit, but is still negative. The PMO is very encouraging rising strongly on an oversold BUY signal. Overhead resistance is stiff here, but if it can overcome, I think you could see a 23%+ gain. The big problem is the bear market and this one will be at its mercy.
Relmada Therapeutics, Inc. (RLMD)
EARNINGS: 11/10/2022 (AMC)
Relmada Therapeutics, Inc. is a clinical-stage biotechnology company, which focuses on addressing diseases of the central nervous system. It develops esmethadone, an N-methyl-D-aspartate receptor antagonist for the treatment of CNS diseases, and oral agent for depression and other potential indications. The company was founded by Paolo Manfredi on May 31, 2012 and is headquartered in Coral Gables, FL.
Predefined Scans Triggered: Moved Above Upper Keltner Channel, New 52-week Highs, Moved Above Upper Bollinger Band, Stocks in a New Uptrend (Aroon), Moved Above Upper Price Channel and P&F Double Top Breakout.
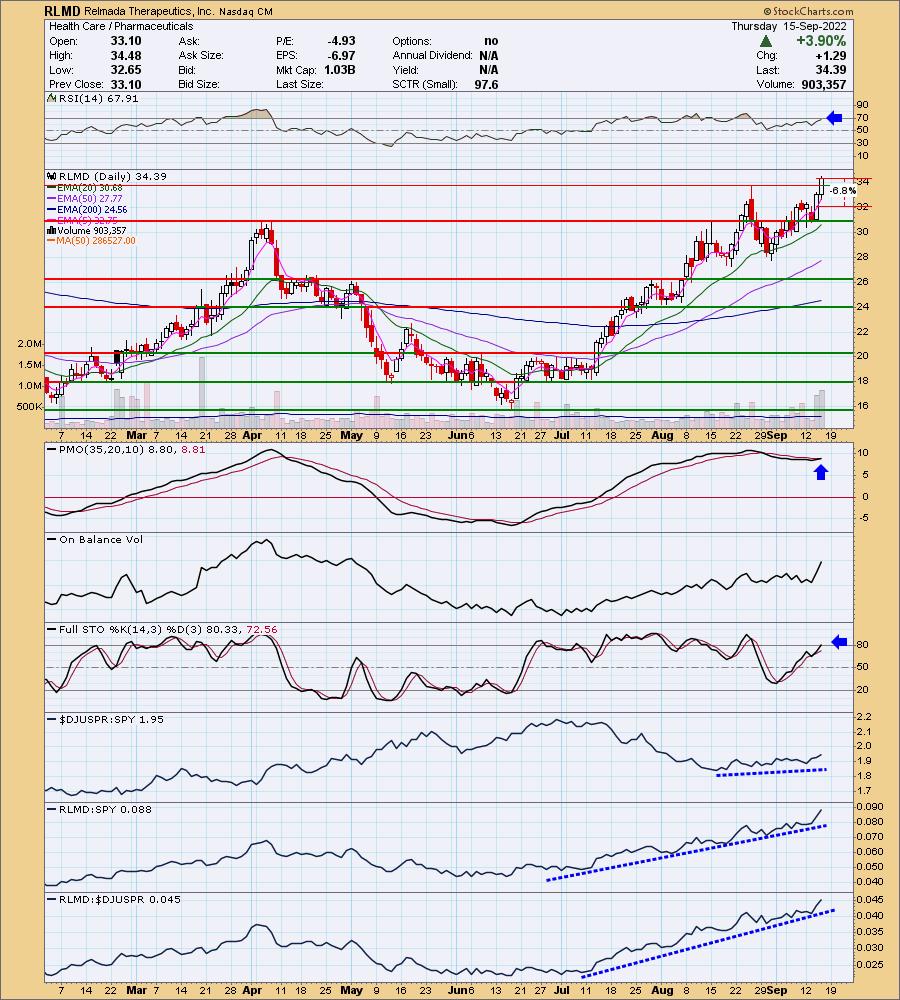
RLMD is down -1.86% in after hours trading. Today's breakout to new 52-week highs was excellent. The RSI is positive and not overbought and Stochastics just moved above 80. The PMO nearly triggered a crossover BUY signal today. Relative strength studies are excellent with the exception of the group not outperforming the SPY much. The stop is set at 6.8% around $32.06.
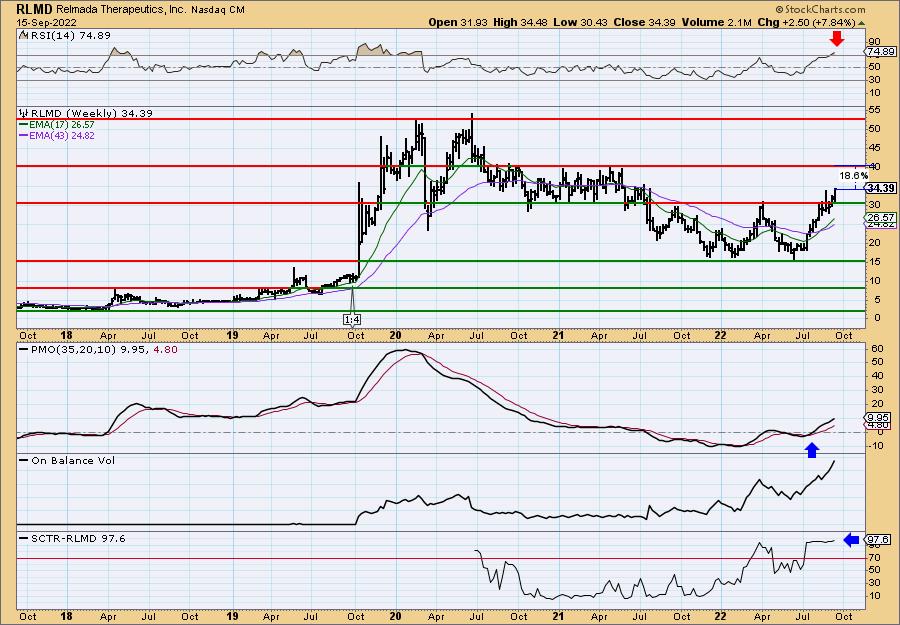
The breakout on the weekly chart is great and if it can reach the next level of overhead resistance that would be an over 18% gain. The weekly PMO is on a BUY signal and rising. The volume is clearly coming in right now. The problem would be the weekly RSI that is overbought, but looking at the end of 2019 and beginning of 2020, it can hold those conditions for some time. The SCTR is a healthy 97.6%.
iShares Silver Trust (SLV)
EARNINGS: N/A
SLV tracks the silver spot price, less expenses and liabilities, using silver bullion held in London. Click HERE for more information.
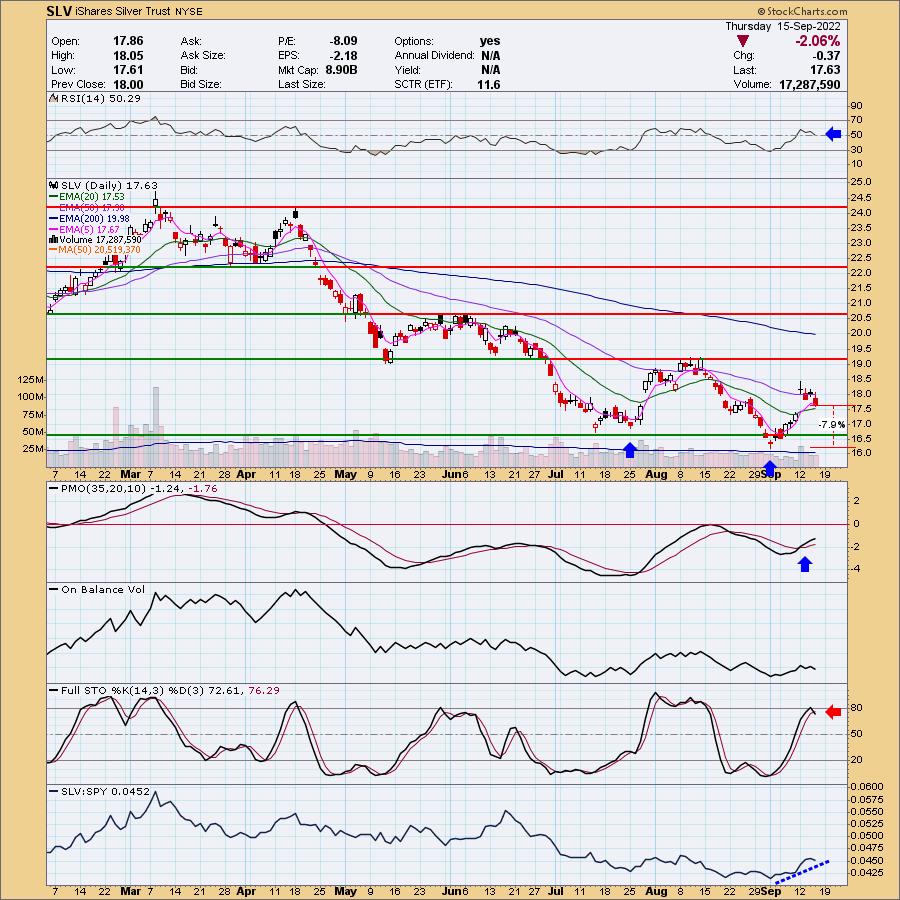
Predefined Scans Triggered: Moved Below Ichimoku Cloud and Elder Bar Turned Blue.
SLV is down -0.91% in after hours trading. I've covered this one numerous times. The last time was on April 12th 2022. What grabbed me on these silver charts were the PMOs. They are one of only a handful of ETFs that have rising momentum. In the CandleGlance, the double-bottom had my eyes locking in on SLV. One issue is the possible short-term island reversal pattern. Unfortunately with those patterns you don't know if it is one until it executes. In the case of a reverse island, you will get, in this case, a gap down once the island has formed as it has now. The RSI is positive, but Stochastics have topped. I've set the stop beneath the double-bottom around 7.9% or $16.24.
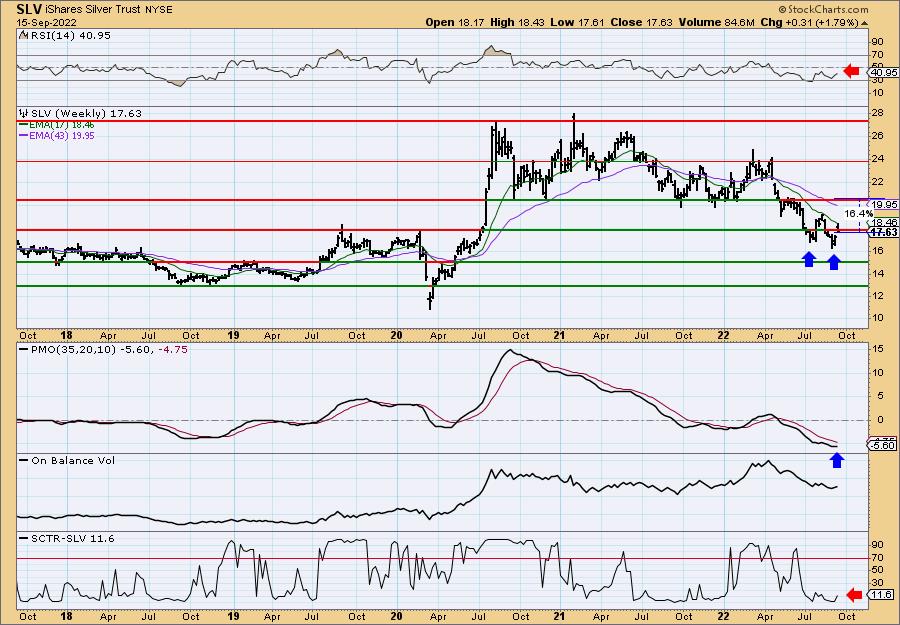
The double-bottom looks particularly enticing on the weekly chart. The pattern won't be confirmed until a breakout above the August high. The weekly RSI is negative but the weekly PMO is trying to turn back up. The SCTR is abysmal at 11.6% and volume is melting away. As I mentioned, I'm putting this one on a watch list and if it rallies above its 50-day EMA on the daily chart, I'll probably jump in.
SPDR S&P Oil & Gas Equipment & Services ETF(XES)
EARNINGS: N/A
XES tracks an equal-weighted index of companies in the oil & gas equipment and services sub-industry of the S&P Total Market Index. Click HERE for more information.
Predefined Scans Triggered: Elder Bar Turned Green and P&F Double Top Breakout.
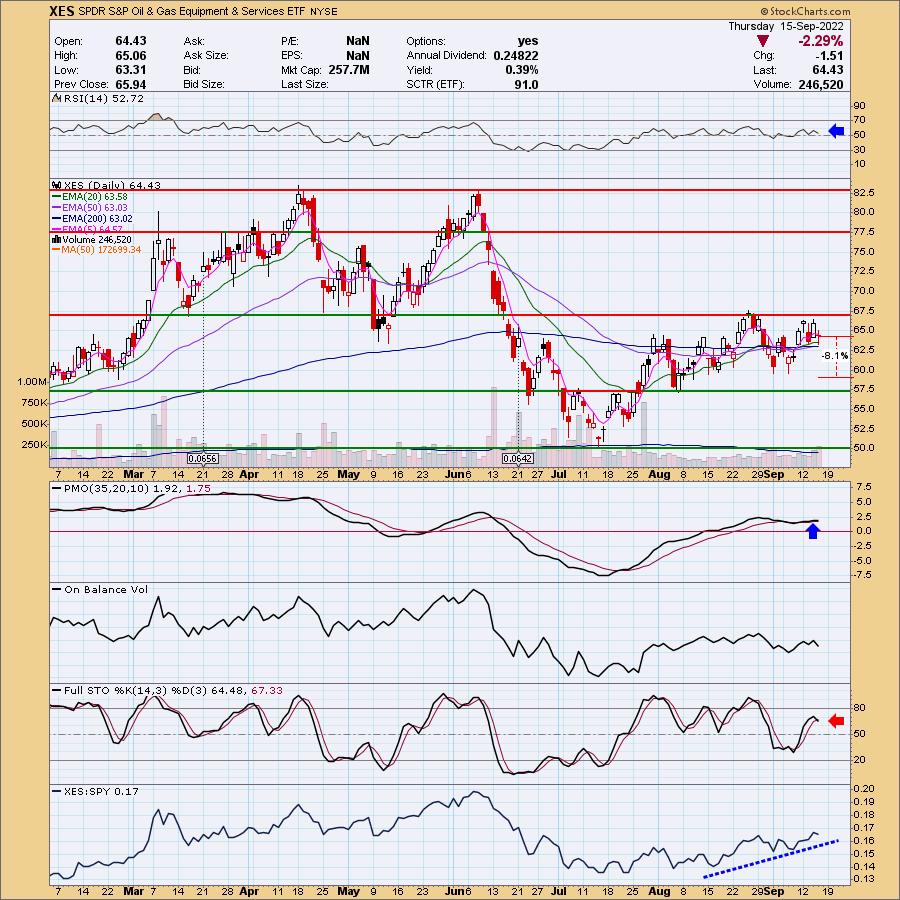
XES is down -1.66% in after hours trading. I probably should list this one as "iffy" too, but I do like this industry group. It's really showing some great performance against the SPY. Which is an example of why we need solid outperformance in a bear market. Even with this outperformance, the ETF has been mostly in a trading range. The RSI is still positive and the PMO while flat, is on a crossover BUY signal. Stochastics have topped but are in positive territory. Right now this isn't my cup of tea, but a breakout would cause it to make my portfolio. The stop is set at around 8.1% or $59.21.
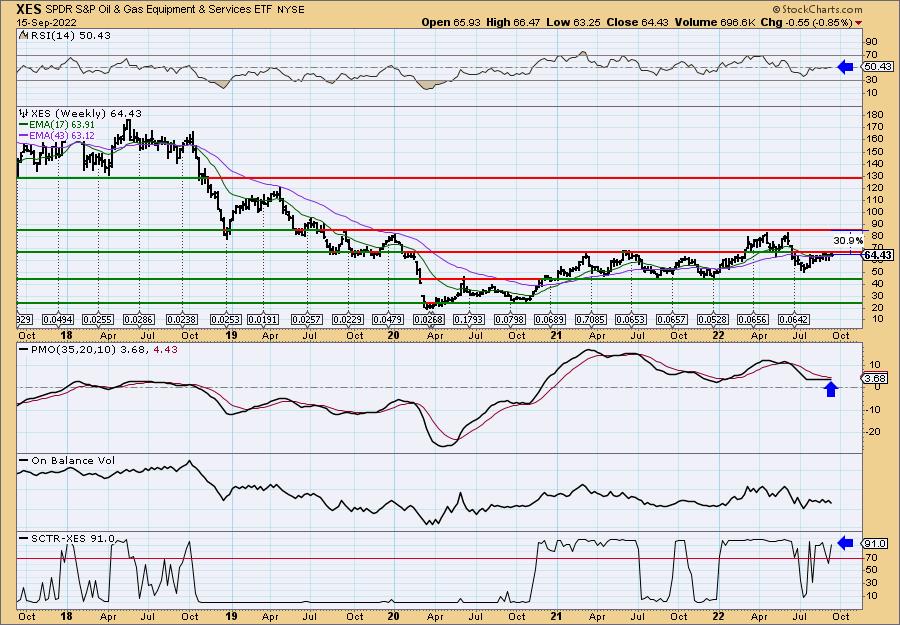
The weekly chart shows us that this level of resistance is very strong. Strong because of all the "touches" of the resistance line. The weekly RSI is positive and the weekly PMO is flat. I like the solid SCTR reading of 91.0%. If it can overcome this resistance level, I would look for it to reach the 2022 tops for a 30%+ gain.
Don't forget, on Thursdays I look at reader-requested symbols, click HERE to send me an email. I read every email I receive and try to answer them all!
Current Market Outlook:
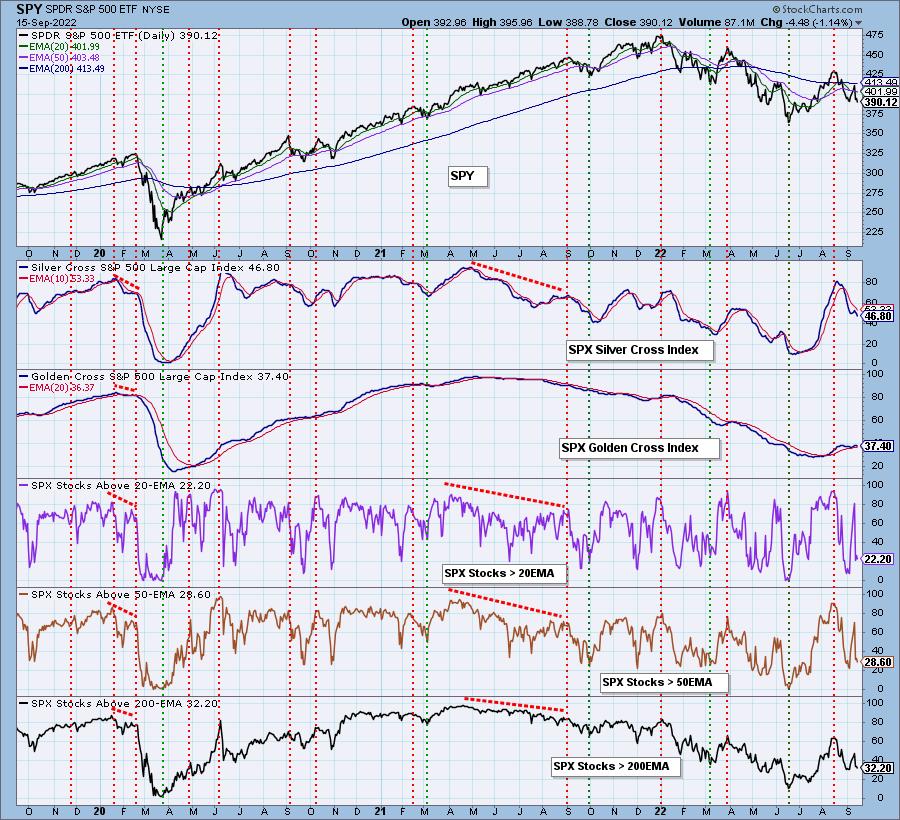
Market Environment: It is important to consider the odds for success by assessing the market tides. The following chart uses different methodologies for objectively showing the depth and trend of participation for intermediate- and long-term time frames.
- The Silver Cross Index (SCI) shows the percentage of SPX stocks on IT Trend Model BUY signals (20-EMA > 50-EMA)
- The Golden Cross Index (GCI) shows the percentage of SPX stocks on LT Trend Model BUY signals (50-EMA > 200-EMA)
Don't forget that as a "Diamonds" member, you have access to our GCI/SCI curated ChartList on DecisionPoint.com. You'll find it under "Members Only" links on the left side on the Blogs and Links Page.
Here is the current chart:
Full Disclosure: I am 30% exposed. Considering CHPT, SLV and XES. Should I purchase, I will be selling others to keep my exposure at 30%.
I'm required to disclose if I currently own a stock I mention and/or may buy/short it within the next 72 hours.
"Technical Analysis is a windsock, not a crystal ball." - Carl Swenlin
(c) Copyright 2022 DecisionPoint.com
Watch the latest episode of DecisionPoint with Carl & Erin Swenlin on Mondays 7:00p EST or on the DecisionPoint playlist on the StockCharts TV YouTube channel here!
NOTE: The stocks reported herein are from mechanical trading model scans that are based upon moving average relationships, momentum and volume. DecisionPoint analysis is then applied to get five selections from the scans. The selections given should prompt readers to do a chart review using their own analysis process. This letter is not a call for a specific action to buy, sell or short any of the stocks provided. There are NO sure things or guaranteed returns on the daily selection of "Diamonds in the Rough."
Regarding BUY/SELL Signals: The signal status reported herein is based upon mechanical trading model signals and crossovers. They define the implied bias of the price index/stock based upon moving average relationships and momentum, but they do not necessarily call for a specific action. They are information flags that should prompt chart review. Further, they do not call for continuous buying or selling during the life of the signal. For example, a BUY signal will probably (but not necessarily) return the best results if action is taken soon after the signal is generated. Additional opportunities for buying may be found as price zigzags higher, but the trader must look for optimum entry points. Conversely, exit points to preserve gains (or minimize losses) may be evident before the model mechanically closes the signal.
Helpful DecisionPoint Links:
DecisionPoint Shared ChartList and DecisionPoint Chart Gallery
Price Momentum Oscillator (PMO)
Swenlin Trading Oscillators (STO-B and STO-V)
For more links, go to DecisionPoint.com