
Some days it is easier to find candidates and some days it's impossible. Today it was easy because the industry group "theme" today has some great looking charts.
The industry group that is full of healthy charts is Banks. Keep in mind that higher interest rates seem to favor banks. It is a giant industry group with well over a 400 names so we have to keep that in perspective given my various scans returned about 25. I narrowed it down to 10 with seven "runners-up" and three "Diamonds in the Rough". If you have favorites in this industry you like, compare the charts to those in today's report and see if they have similar characteristics. I sifted through some well-known bank names like Citi (C), US Bank (USB) and Fifth Third (FITB) and they look pretty terrible. Today's three "Diamonds in the Rough" are already starting to sparkle.
My exposure level is now at 20%. I will probably slim that by cutting some of my position sizes.
Tomorrow will be a wild card given the Fed minutes will reveal the interest rate hike, either 75 points or 100 points. I like to think everything is "baked in" on a chart, but the Fed is changing those rules by being cagy about when hikes will end and how much each hike will be. Uncertainty is never good for the market or our portfolios.
Bottom line: Exposure levels should be adjusted downward in most cases. Keep your investment timeframes short if you want to be in.
Good Luck & Good Trading!
Erin
Today's "Diamonds in the Rough": NBTB, NWBI and UCBI.
"Runners-up": BANR, CVBF, BANR, FNB, PFS, TRMK and UBSI.

RECORDING LINK (9/16/2022):
Topic: DecisionPoint Diamond Mine (9/16/2022) LIVE Trading Room
Start Time: Sept 16, 2022 09:00 AM
Recording LINK.
Passcode: Sept*16th
REGISTRATION For Friday 9/23 Diamond Mine:
When: Sep 23, 2022 09:00 AM Pacific Time (US and Canada)
Topic: DecisionPoint Diamond Mine (9/23/2022) LIVE Trading Room
Register in advance for this webinar HERE.
NO DIAMOND MINE ON 10/7***
Save the registration confirmation email with login instructions in case Zoom doesn't notify you in time.

Here is the Monday 9/12 recording:
Welcome to DecisionPoint Diamonds, wherein I highlight ten "Diamonds in the Rough" per week. These are selected from the results of my DecisionPoint Scans, which search for stocks that could benefit from the trend and condition of the market. Remember, these are not recommendations to buy or sell, but are the most interesting of the stocks that surfaced in my scans. My objective is to save you the work of the initial, tedious culling process, but you need to apply your own analysis to see if these stocks pique your interest as well. There are no guaranteed winners here!
"Predefined Scans Triggered" are taken from StockCharts.com using the "Symbol Summary" option instead of a "SharpChart" on the workbench.
NBT Bancorp, Inc. (NBTB)
EARNINGS: 10/25/2022 (AMC)
NBT Bancorp, Inc. is a holding company, which engages in the provision of financial solutions. It offers commercial banking, retail banking, and wealth management, as well as trust and investment services. The company was founded in 1986 and is headquartered in Norwich, NY.
Predefined Scans Triggered: New CCI Buy Signals.
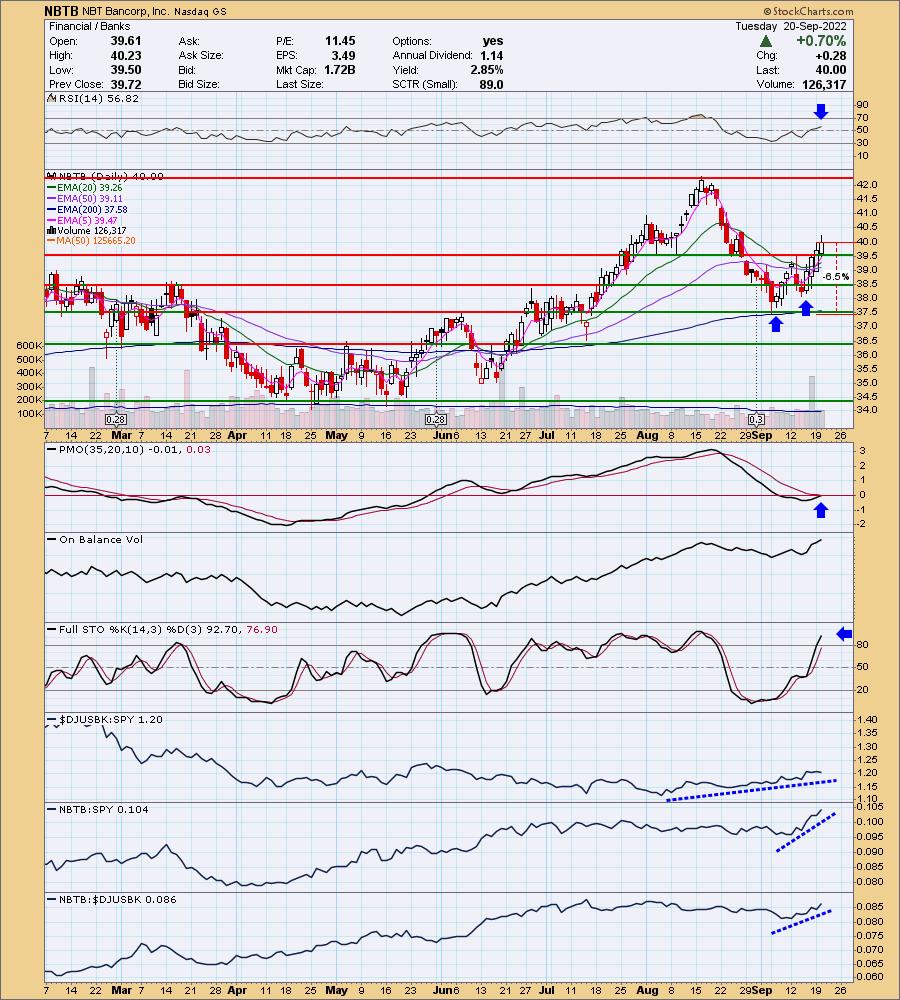
NBTB is unchanged in after hours trading. We have a double-bottom pattern which was confirmed on yesterday's breakout. The minimum upside target of the pattern would bring price to $41.50+. The RSI is positive, rising and not overbought. The PMO is nearing a crossover BUY signal. Volume is definitely coming in. Stochastics are rising strongly above 80. This one is a strong relative performer against the SPY and its industry group. The stop is set below the pattern and the 200-day EMA at 6.5% around $37.40.
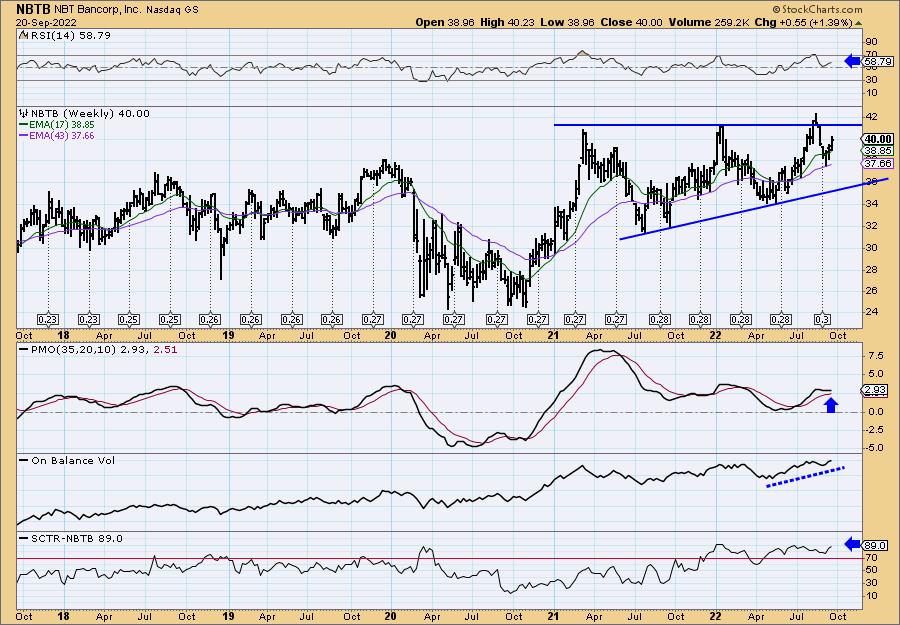
The weekly chart is very positive. I annotated an ascending triangle pattern that implies an upside breakout. The weekly RSI is positive and rising. The weekly PMO has bottomed above the signal line (you might want to click on the chart and add a "thumbnail" so you can see it better. I prefer not to add them because the chart becomes blurry or I have to shorten the timeframe). Volume is confirming the rally and the SCTR is respectable at 89%. It's trading near all-time highs so consider upside potential at 15% or $46.00.
Northwest Bancshares, Inc. (NWBI)
EARNINGS: 10/24/2022 (BMO)
Northwest Bancshares, Inc. is a holding company. It offers personal & business banking products including employee benefits, investment management services, insurance and trust. It engages in collecting deposits and making loans secured by various types of collateral, including real estate and other assets. The company was founded on June 29, 2001 and is headquartered in Warren, PA.
Predefined Scans Triggered: New CCI Buy Signals, P&F Double Top Breakout and P&F Triple Top Breakout.
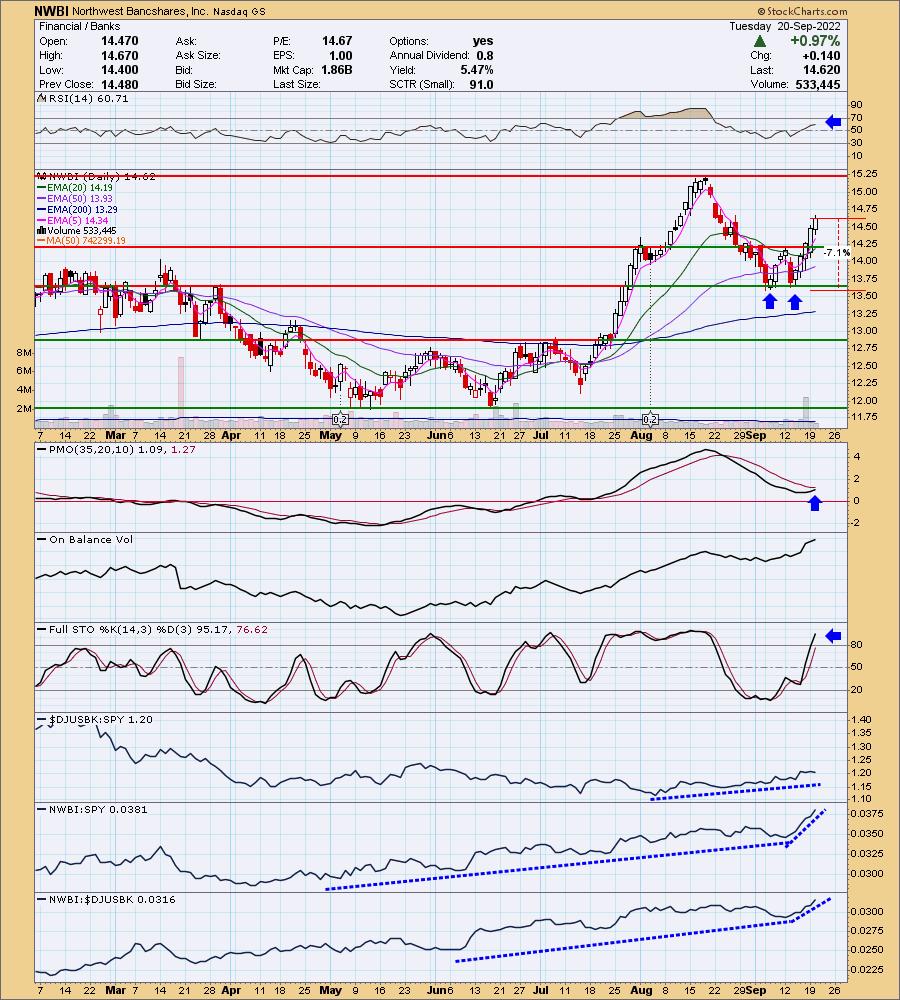
NWBI is down -0.14% in after hours trading. We have another bullish double-bottom pattern only this one has nearly fulfilled the minimum upside target at around $14.75, but remember that is a minimum upside target. The chart is shaping up, as it should given the strong five days of rally. The RSI is positive, but flat. The PMO is rising toward a new crossover BUY signal. Volume is coming in strong. Stochastics are above 80 and rising sharply. This one has been outperforming for some time. It's now increasing that outperformance (likely due to a falling market). The stop is set at a reasonable 7.1% around $13.58.
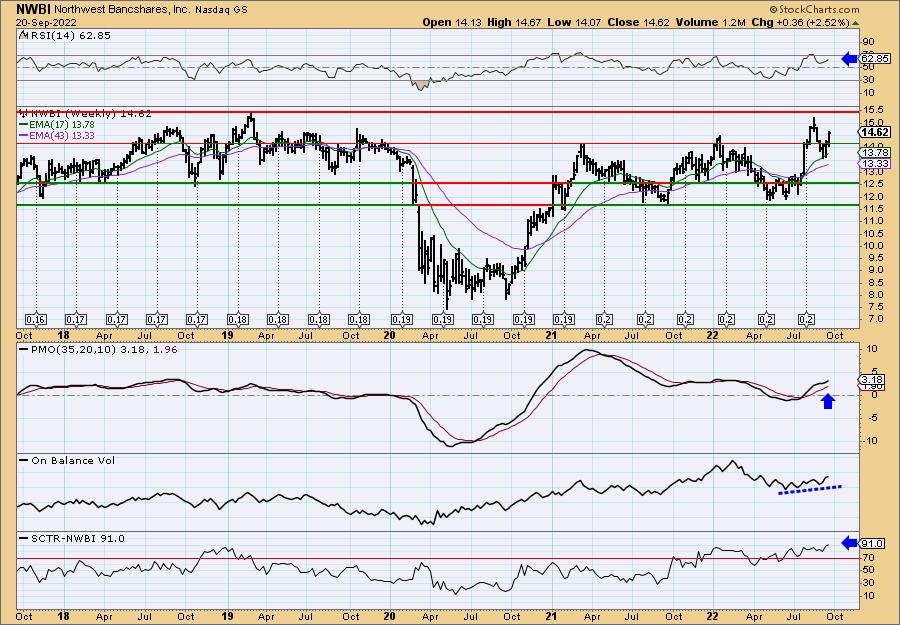
I like the weekly chart, but it does bother me that it is now near multi-year highs and an all-time high if it exceeds the top in 2019. However, the indicators looks really good. The weekly RSI is rising, positive and not overbought. The weekly PMO is rising more sharply than the others after a bottom above the signal line. Volume is steadily rising and we have a very strong SCTR of 91%. Upside potential could be considered at 15% or around $16.81.
United Community Banks, Inc. (UCBI)
EARNINGS: 10/18/2022 (AMC)
United Community Banks, Inc. is a bank holding company, which engages in the provision of consumer and business banking services. The firm caters to individuals and small and medium-sized businesses. It offers checking, savings, mortgages, borrowing, digital baking, credit cards, and investing services. The company was founded in 1950 and is headquartered in Blairsville, GA.
Predefined Scans Triggered: Bullish 50/200-day MA Crossovers.
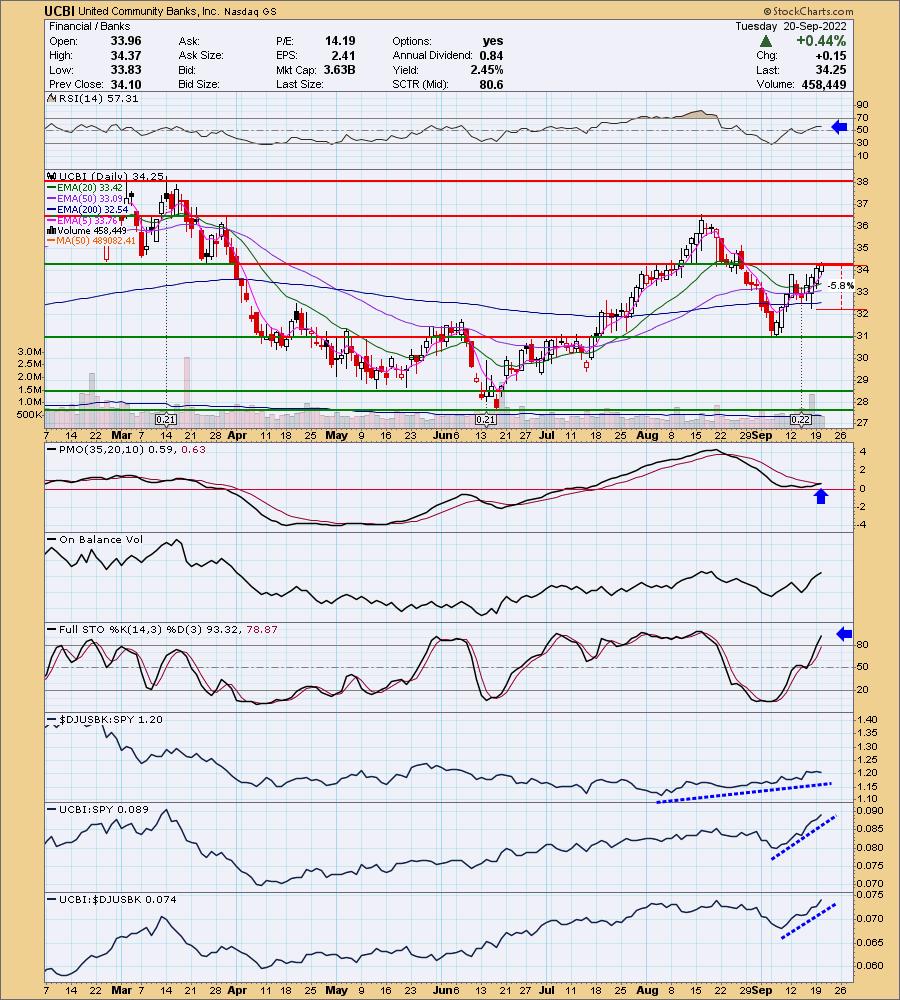
UCBI is unchanged in after hours trading. We don't have a double-bottom, it is more like a "V" bottom which is also a bullish pattern. Price is right up against resistance at the March lows. Indicators are looking good with a positive RSI and a PMO BUY signal on the way. Stochastics are above 80 and still rising. Relative strength shows it is a strong performer. I like that you can set a thin stop below the 200-day EMA at 5.8% or $32.26.
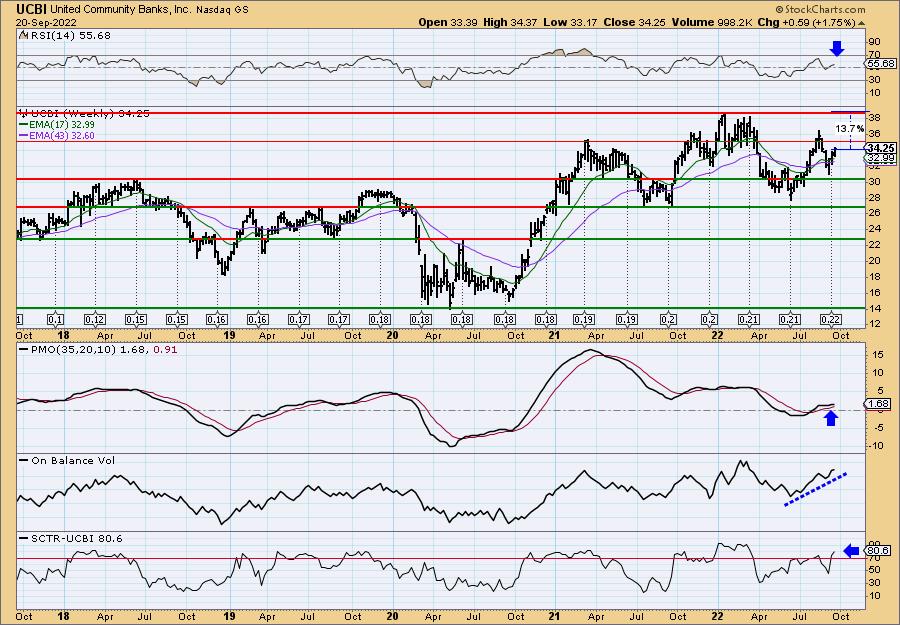
Given the thinner stop, I believe we can set our upside target this year's high. Note that the dividend is increasing and is now $0.22, not bad. The weekly RSI is rising in positive territory and isn't overbought. The weekly PMO has bottomed above its signal line. Volume is coming in and it has a respectable SCTR of 80.6%.
Don't forget, on Thursdays I look at reader-requested symbols, click HERE to send me an email. I read every email I receive and try to answer them all!
Current Market Outlook:
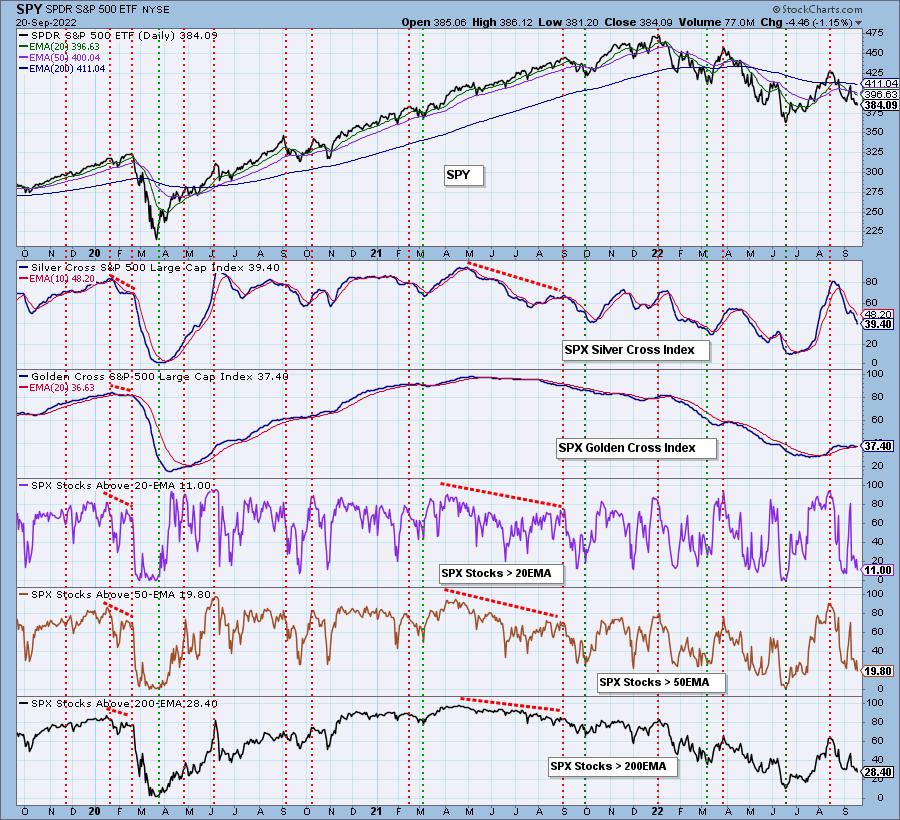
Market Environment: It is important to consider the odds for success by assessing the market tides. The following chart uses different methodologies for objectively showing the depth and trend of participation for intermediate- and long-term time frames.
- The Silver Cross Index (SCI) shows the percentage of SPX stocks on IT Trend Model BUY signals (20-EMA > 50-EMA)
- The Golden Cross Index (GCI) shows the percentage of SPX stocks on LT Trend Model BUY signals (50-EMA > 200-EMA)
Don't forget that as a "Diamonds" member, you have access to our GCI/SCI curated ChartList on DecisionPoint.com. You'll find it under "Members Only" links on the left side on the Blogs and Links Page.
Here is the current chart:
Full Disclosure: I am 20% exposed.
I'm required to disclose if I currently own a stock I mention and/or may buy/short it within the next 72 hours.
"Technical Analysis is a windsock, not a crystal ball." - Carl Swenlin
(c) Copyright 2022 DecisionPoint.com
Watch the latest episode of DecisionPoint with Carl & Erin Swenlin on Mondays 7:00p EST or on the DecisionPoint playlist on the StockCharts TV YouTube channel here!
NOTE: The stocks reported herein are from mechanical trading model scans that are based upon moving average relationships, momentum and volume. DecisionPoint analysis is then applied to get five selections from the scans. The selections given should prompt readers to do a chart review using their own analysis process. This letter is not a call for a specific action to buy, sell or short any of the stocks provided. There are NO sure things or guaranteed returns on the daily selection of "Diamonds in the Rough."
Regarding BUY/SELL Signals: The signal status reported herein is based upon mechanical trading model signals and crossovers. They define the implied bias of the price index/stock based upon moving average relationships and momentum, but they do not necessarily call for a specific action. They are information flags that should prompt chart review. Further, they do not call for continuous buying or selling during the life of the signal. For example, a BUY signal will probably (but not necessarily) return the best results if action is taken soon after the signal is generated. Additional opportunities for buying may be found as price zigzags higher, but the trader must look for optimum entry points. Conversely, exit points to preserve gains (or minimize losses) may be evident before the model mechanically closes the signal.
Helpful DecisionPoint Links:
DecisionPoint Shared ChartList and DecisionPoint Chart Gallery
Price Momentum Oscillator (PMO)
Swenlin Trading Oscillators (STO-B and STO-V)
For more links, go to DecisionPoint.com