
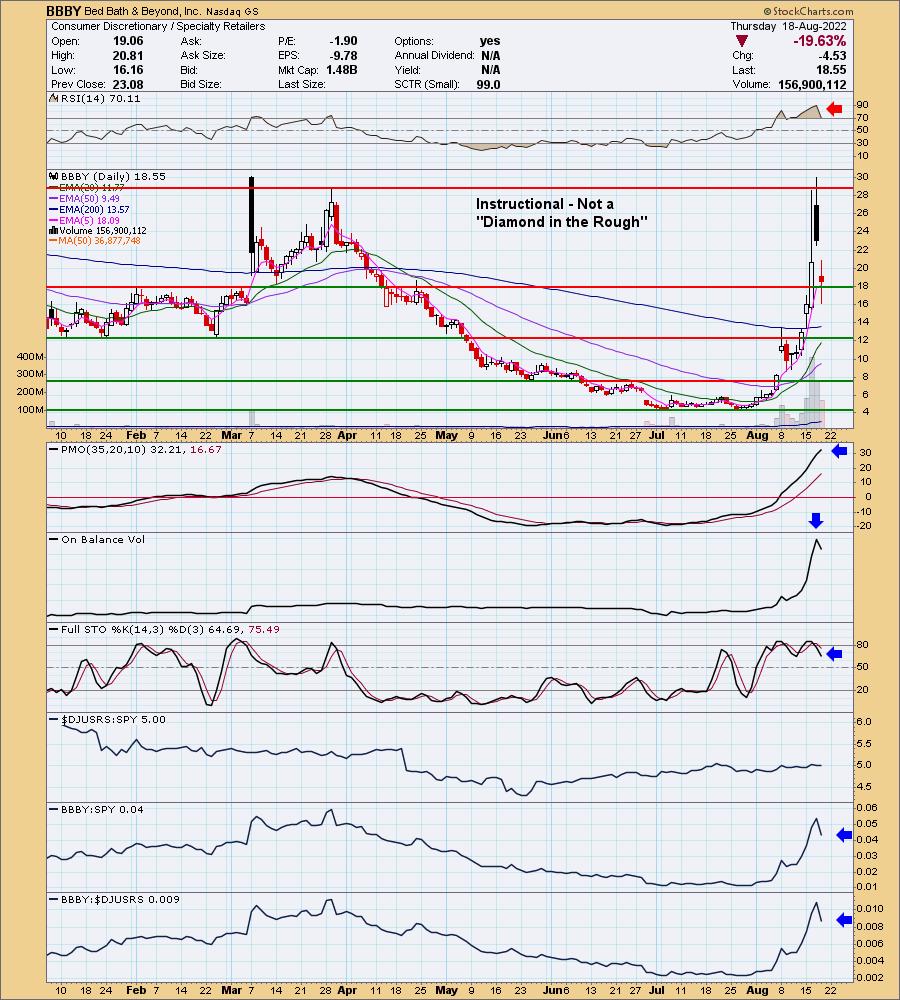
Today is going to be a little different than a typical Reader Request Day. Not many turned in symbol requests for me today so I examined what I had and decided I would show an example of a parabolic chart. It is not a "Diamond in the Rough"-- it is an example.
One of the stocks requested was Home Depot (HD). I noticed that relative strength for HD was abysmal, so I looked at its competitor, Lowes (LOW). LOW has incredible relative strength against the group. I'm going to talk about both charts. They both are bullish, but I believe LOW has an advantage over HD based on relative strength.
The other two stocks are from the Energy sector. I haven't been a fan of this area, but admittedly I am holding an Energy position. I like what is happening there so I've included two reader requests from this area of the market.
Don't forget tomorrow is the Diamond Mine trading room! All of the registration information is below, including the link to last week's recording.
Good Luck & Good Trading!
Erin
Today's "Diamonds in the Rough": BBBY, BTU, CTRA, HD and LOW.

RECORDING LINK (8/12/2022):
Topic: DecisionPoint Diamond Mine (8/12/2022) LIVE Trading Room
Start Time: Aug 12, 2022 08:59 AM
Meeting Recording Link
Access Passcode: August#12
REGISTRATION FOR Friday 8/19 Diamond Mine:
When: Aug 19, 2022 09:00 AM Pacific Time (US and Canada)
Topic: DecisionPoint Diamond Mine (8/19/2022) LIVE Trading Room
Register in advance for this webinar HERE
Save the registration confirmation email with login instructions in case Zoom doesn't notify you in time.

Unfortunately there is no recording for yesterday's DecisionPoint Trading Room so here is a copy of the one we did 2 weeks ago:
Welcome to DecisionPoint Daily Diamonds, wherein I highlight ten "Diamonds in the Rough" per week. These are selected from the results of my DecisionPoint Scans, which search for stocks that could benefit from the trend and condition of the market. Remember, these are not recommendations to buy or sell, but are the most interesting of the stocks that surfaced in my scans. My objective is to save you the work of the initial, tedious culling process, but you need to apply your own analysis to see if these stocks pique your interest as well. There are no guaranteed winners here!
"Predefined Scans Triggered" are taken from StockCharts.com using the "Symbol Summary" option instead of a "SharpChart" on the workbench.
Parabolic Example
Bed Bath & Beyond, Inc. (BBBY)
EARNINGS: 9/29/2022 (BMO)
Bed Bath & Beyond, Inc. engages in the operation of retail stores and retails domestics merchandise and home furnishings. Its products include domestic merchandise and home furnishings such as bed linens and related items, bath items, kitchen textiles, kitchen and tabletop items, fine tabletop, basic house wares, general home furnishings, and consumables. The company was founded by Warren Eisenberg and Leonard Feinstein in 1971 and is headquartered in Union, NJ.
Predefined Scans Triggered: Gap Downs, Elder Bar Turned Blue and P&F High Pole.
BBBY is down a whopping -41.38% and it is still falling fast. It was interesting because last weekend I was talking to my stepson who is an economics major. I mentioned how his brother had called me the night before Gamestop started its "meme stock" journey. It was the first move and first meme stock. He chuckled as his brother is a computer engineer and frequents Reddit. He told me that the current meme stock is Bed Bath & Beyond (BBBY). On Tuesday a subscriber asked me about this one. He told me how he was really enjoying the ride, but what now?
I informed him that BBBY is a meme stock and he better be careful. It was up yesterday, but formed a bearish filled black candlestick. Today it gapped down ruthlessly. This is a perfect example of a parabolic formation because when they fail, they fail spectacularly. They are so fun to ride up, but you have to be quick to dump them if anything looks fishy or consider using a deep trailing stop. We had warning back in March on the big filled black candlestick and yesterday we were warned too.
The volume this time around was huge--another characteristic of parabolic action. Another characteristic? Extraordinarily high volume. This is particularly true of meme stocks. As I finish writing this paragraph, BBBY is down another percentage point, -42.86%.
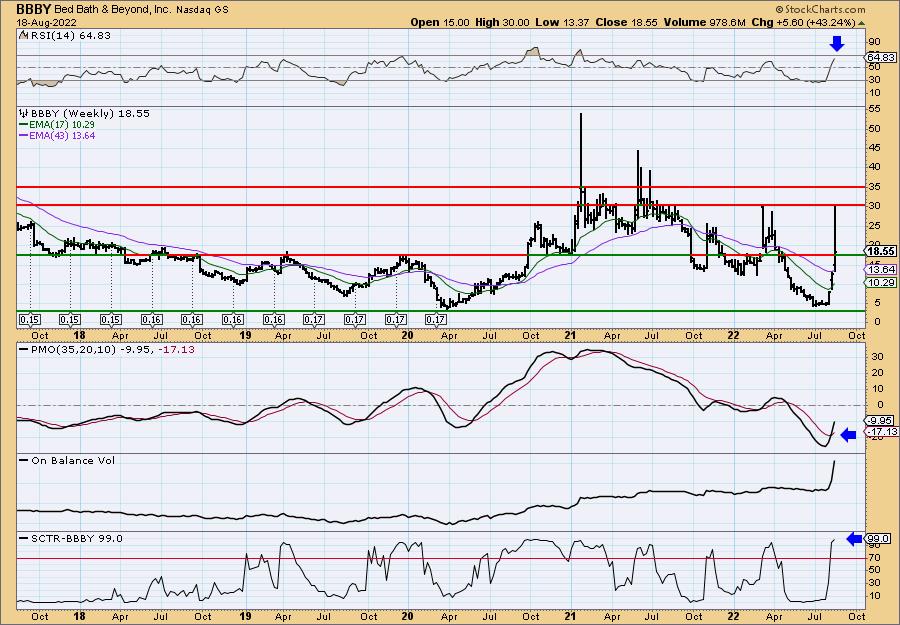
It isn't overly surprising that price turned down here. It was the sell point last time. Don't let the weekly chart mislead you. The weekly PMO just triggered a BUY signal and the RSI is rising strongly. The OBV looks wonky so that would be a clue that something is up if you hadn't glanced at the daily chart. Of course the SCTR jumped, but I expect it will fall quickly if the decline in after hours trading holds up. I know I don't do recommendations, but I wouldn't touch this one with a ten-foot pole.
Peabody Energy Corp. (BTU)
EARNINGS: 10/27/2022 (BMO)
Peabody Energy Corp. engages in the business of coal mining. It operates through the following business segments: Powder River Basin, Midwestern U.S., Western U.S., Seaborne Metallurgical, Seaborne Thermal Mining and Corporate and Other. The Powder River Basin Mining segment consists of its mines in Wyoming. The Midwestern U.S. includes Illinois and Indiana mining operations. The Western U.S. reflects the aggregation of its New Mexico, Arizona and Colorado mining operations. The Seaborne Metallurgical covers mines in Queensland, Australia. The Seaborne Thermal Mining handles operations in New South Wales, Australia. The Corporate and Other segment includes selling and administrative expenses, results from equity affiliates, corporate hedging activities and trading and brokerage activities. The company was founded by Francis S. Peabody in 1883 and is headquartered in St. Louis, MO.
Predefined Scans Triggered: Elder Bar Turned Green, Moved Above Upper Keltner Channel, Moved Above Upper Bollinger Band, Moved Above Ichimoku cloud, Moved Above Upper Price Channel, P&F Double Top Breakout, P&F Triple Top Breakout and P&F Quadruple Top Breakout.
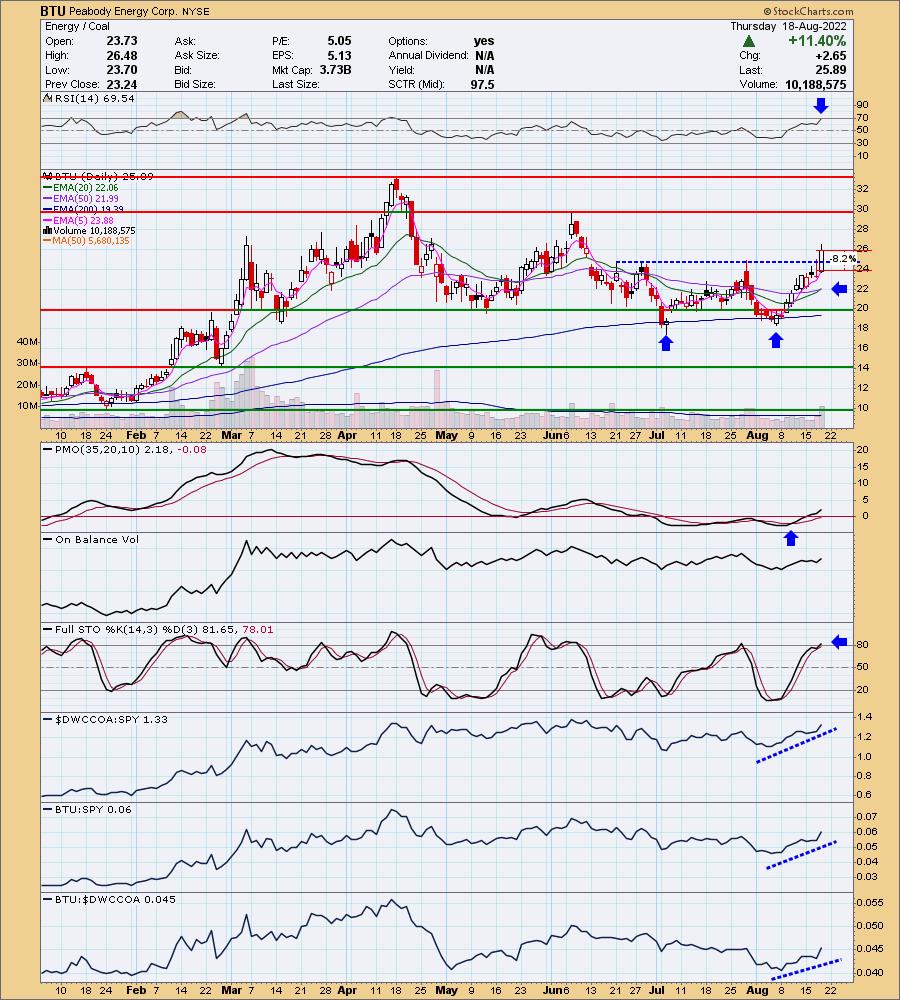
BTU is down -0.04% in after hours trading. The last time I covered it was on January 12th 2022 (position is open and up +95.84%). Rather than write and link to the other four times I covered it, just look at this one. It will list prior coverage and have the links to those prior reports.
Great breakout today from a bullish double-bottom pattern. The upside target of the pattern would take price close to the April top. The RSI is positive and not overbought. The PMO is on an oversold BUY signal. There was a new "Silver Cross" of the 20/50-day EMAs that triggers an IT Trend Model BUY signal. Stochastics just moved above 80. Relative strength is excellent across the board. The stop is set below the confirmation line of the double-bottom at 8.2% or around $23.77.
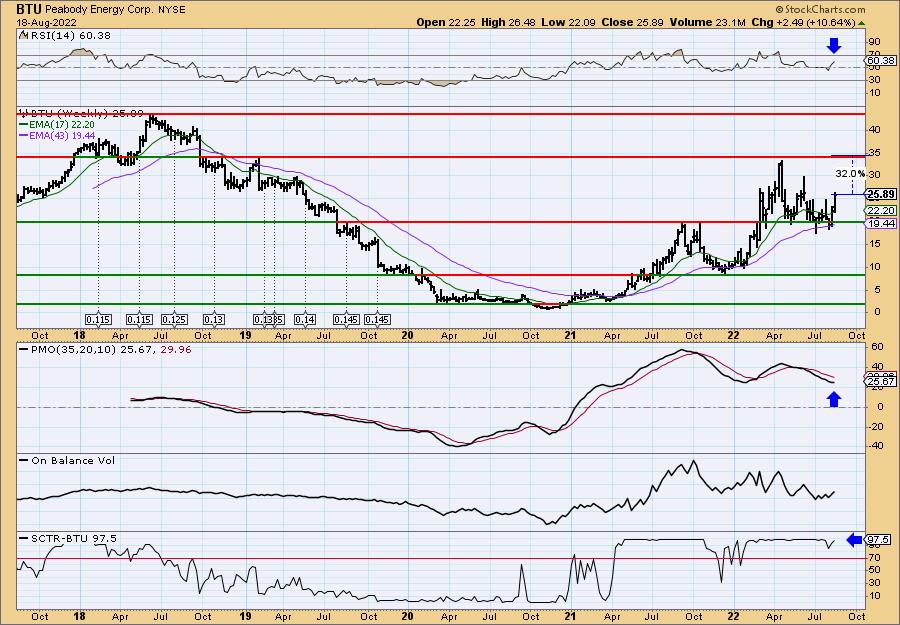
The weekly RSI is positive and rising. The weekly PMO is turning up. The SCTR is excellent at 97.5%. If BTU fulfills that double-bottom's minimum upside target, that would mean a 32% gain.
Coterra Energy Inc. (CTRA)
EARNINGS: 11/3/2022 (AMC)
Coterra Energy Inc. is a diversified energy company, which engages in the exploration, development, and production of oil and natural gas properties. Its portfolio includes projects in the Permian Basin, the Marcellus Shale, and the Anadarko Basin. The company was renamed to Coterra Energy Inc. on October 1, 2021 in connection with the merger involving Cabot Oil & Gas Corp. and Cimarex Energy Co. Coterra Energy was founded in 1989 and is headquartered in Houston, TX.
Predefined Scans Triggered: New CCI Buy Signals, Moved Above Upper Bollinger Band, Stocks in a New Uptrend (Aroon), Moved Above Ichimoku Cloud and Moved Above Upper Price Channel.
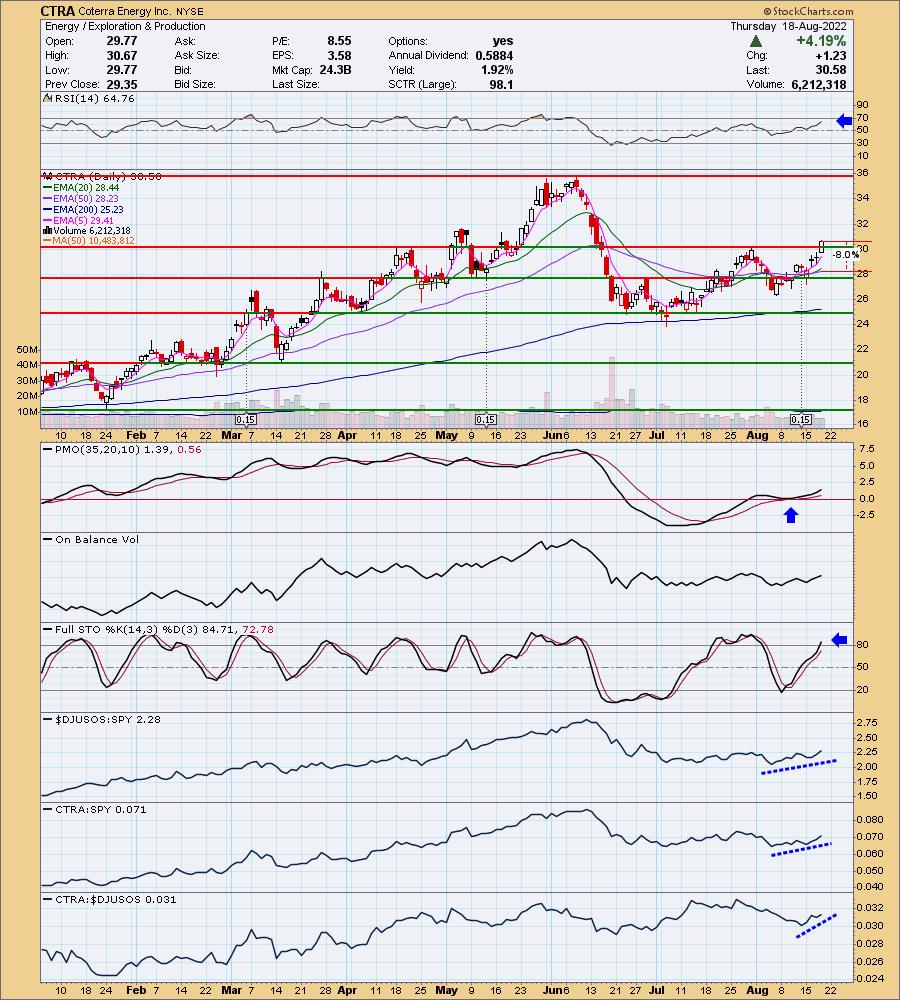
CTRA is up +0.16% in after hours trading. Energy is coming back to life as many of the other sectors are going back to sleep. I covered CTRA on July 29th 2022. It appears the stop was triggered. Today's breakout above the late July high is very encouraging. We have a PMO that may've bottomed above the signal line which is especially bullish. The RSI is positive and not overbought. Stochastics are now above 80 and relative strength is picking back up. The stop is set at 8% around $28.13.
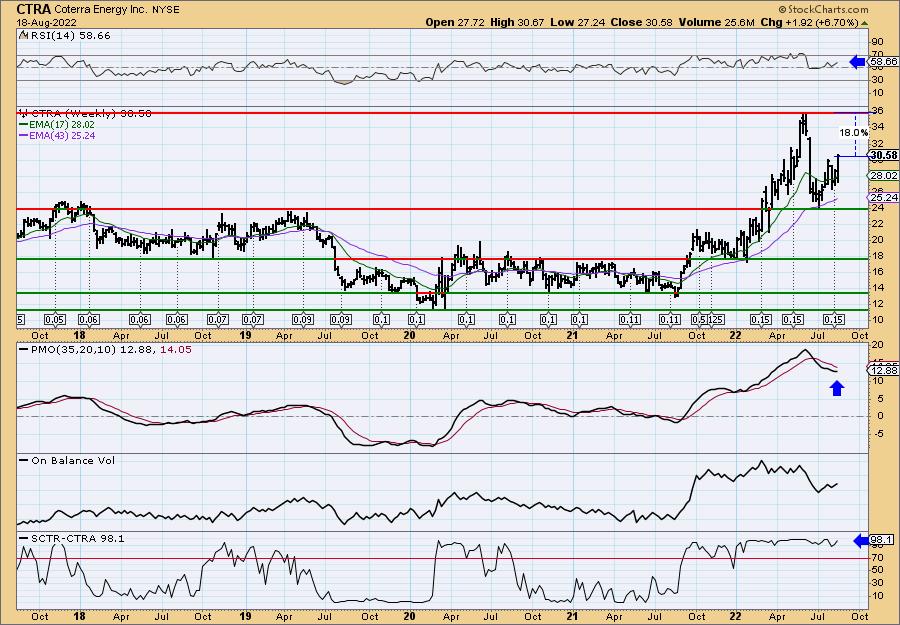
The weekly PMO is turning up and the weekly RSI is positive and not overbought. The SCTR is exceptional at 98.1%. Should it rally to all-time highs, it would be an 18% gain.
This or That?
Home Depot, Inc. (HD)
EARNINGS: 11/15/2022 (BMO)
The Home Depot, Inc. engages in the sale of building materials and home improvement products. Its products include building materials, home improvement products, lawn and garden products and decor products. The firm operates through the following geographical segments: U.S., Canada and Mexico. It offers home improvement installation services, and tool and equipment rental. The company was founded by Bernard Marcus, Arthur M. Blank, Kenneth Gerald Langone and Pat Farrah on June 29, 1978, and is headquartered at Atlanta, GA.
Predefined Scans Triggered: Elder Bar Turned Blue, P&F Ascending Triple Top Breakout and P&F Double Top Breakout.
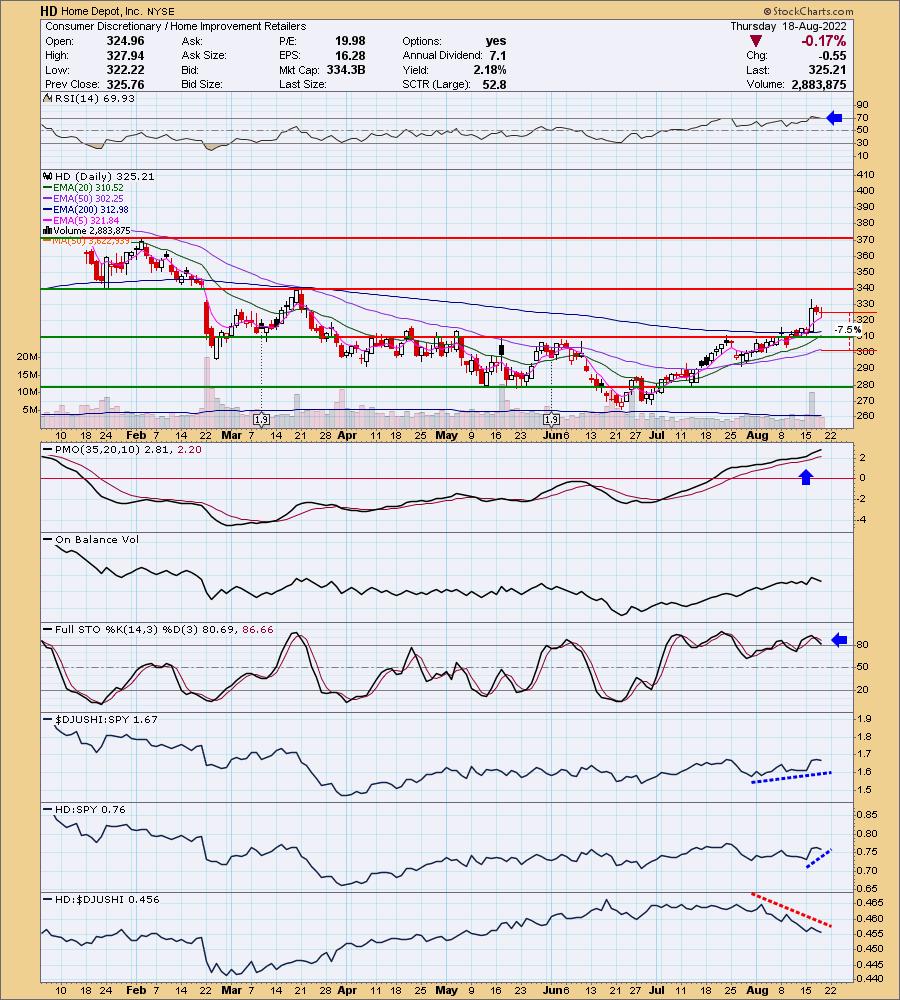
HD is up +0.98% in after hours trading. I covered HD on May 18th 2020. The position is still open and is up +32.55%. I will say that I do like both HD and LOW, but HD is at a disadvantage given its poor performance within the group. The RSI is positive and just moved out of overbought territory. The PMO is rising and isn't overbought given the bottom of the PMO range is -4. Stochastics are above 80, but did turn down. The stop is set at 7.5% around $300.82.
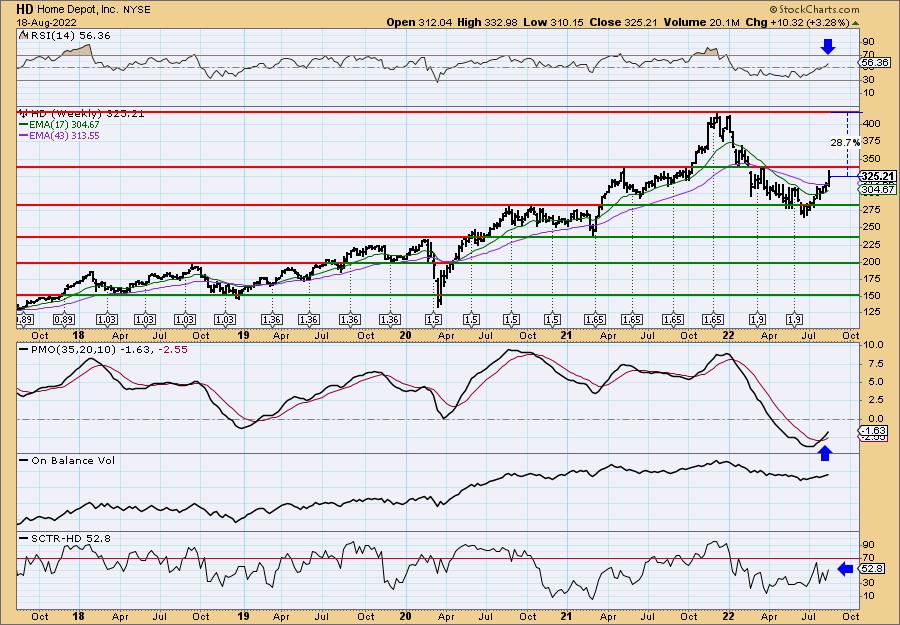
The weekly chart is nearly identical to LOW. This tells me that in the short-term LOW has an advantage, but overall in the intermediate term, they are both bullish and should move higher. The price bottom looks good. My only concern is a correction here would set up an ugly bearish head and shoulders. The weekly PMO is rising and the weekly RSI is positive. The SCTR is 52.8% which is lower than LOW's 65.7%. If it returns to all-time highs that would be an over 28% gain.
Lowes Companies, Inc. (LOW)
EARNINGS: 8/17/2022 (BMO) ** Reported Yesterday **
Lowe's Cos., Inc. engages in the retail sale of home improvement products. The firm offers products for maintenance, repair, remodeling, home decorating and property maintenance. It also provides home improvement products in the following categories: appliances, bathroom, building supply, electrical, flooring, hardware, paint, kitchen, plumbing, lighting & fans, outdoor living, windows and doors. The company was founded in 1946 and is headquartered in Mooresville, NC.
Predefined Scans Triggered: P&F Ascending Triple Top Breakout and P&F Double Top Breakout.
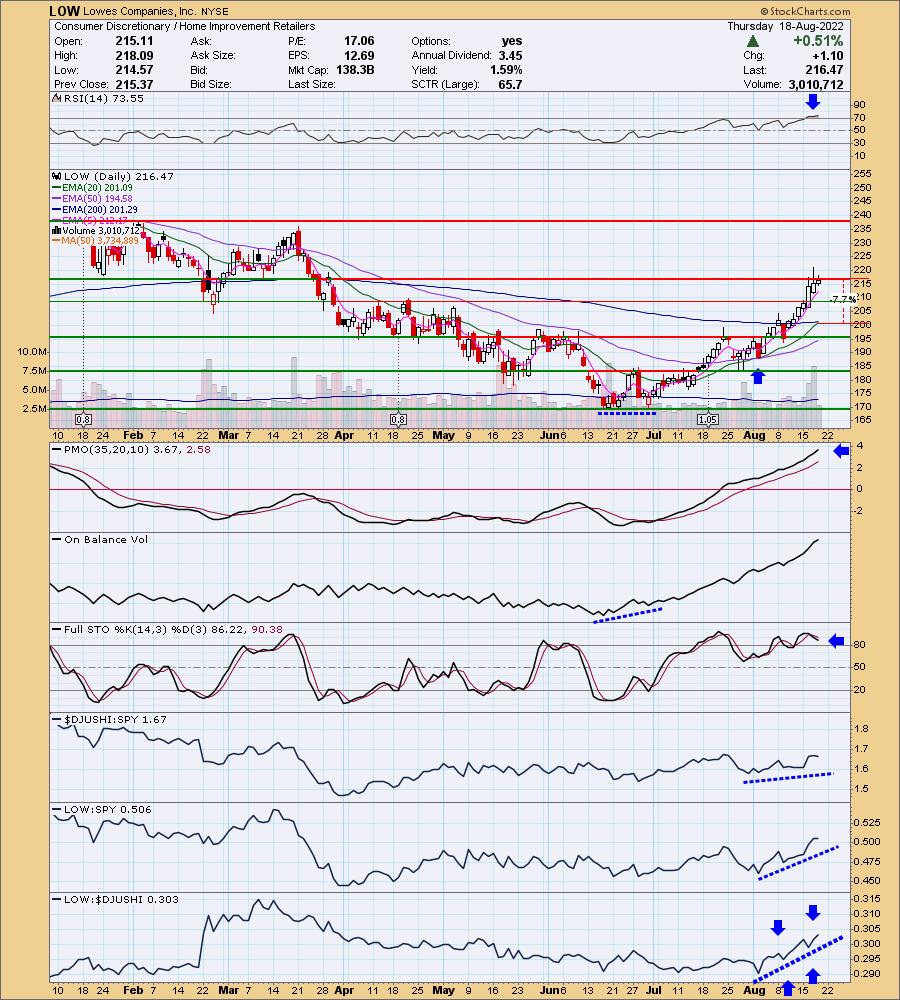
LOW is down -0.14% in after hours trading. I covered LOW on October 14th 2020. That position was stopped out. LOW has been in a nice rising trend. It nearly broke out above resistance. It has already overcome resistance at $210. The RSI is overbought, but the PMO looks very strong. Stochastics are oscillating above 80. For teaching purposes, notice the positive OBV divergence that led into this rally out of the June lows. I've emphasized LOW's relative strength against the group because that is why I would pick "This" v. HD "That". However, I like them both. The stop is set below the 200-day EMA around $199.80.
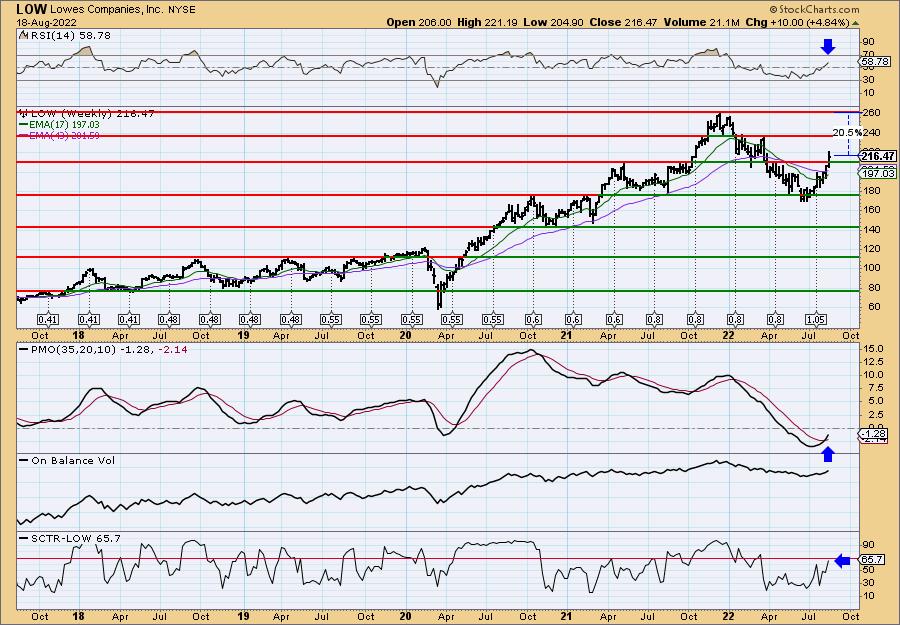
The weekly chart has all the characteristics that HD does with the exception of a higher SCTR at 65.7% v. HD's at 52.8%. That is another reason I prefer LOW to HD. The weekly RSI is positive and the weekly PMO is on a crossover BUY signal. Upside potential is about 20.5%.
Don't forget, on Thursdays I look at reader-requested symbols, click HERE to send me an email. I read every email I receive and try to answer them all!
Current Market Outlook:
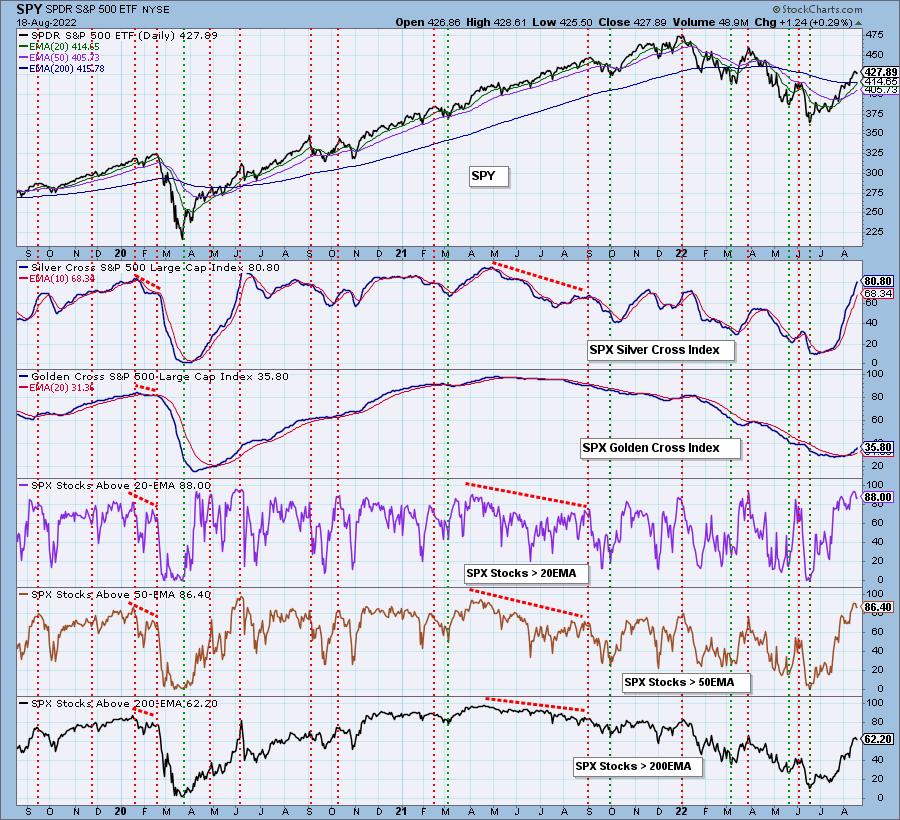
Market Environment: It is important to consider the odds for success by assessing the market tides. The following chart uses different methodologies for objectively showing the depth and trend of participation for intermediate- and long-term time frames.
- The Silver Cross Index (SCI) shows the percentage of SPX stocks on IT Trend Model BUY signals (20-EMA > 50-EMA)
- The Golden Cross Index (GCI) shows the percentage of SPX stocks on LT Trend Model BUY signals (50-EMA > 200-EMA)
Don't forget that as a "Diamonds" member, you have access to our GCI/SCI curated ChartList on DecisionPoint.com. You'll find it under "Members Only" links on the left side on the Blogs and Links Page.
Here is the current chart:
Full Disclosure: I am 60% exposed.
I'm required to disclose if I currently own a stock I mention and/or may buy/short it within the next 72 hours.
"Technical Analysis is a windsock, not a crystal ball." - Carl Swenlin
(c) Copyright 2022 DecisionPoint.com
Watch the latest episode of DecisionPoint with Carl & Erin Swenlin on Mondays 7:00p EST or on the DecisionPoint playlist on the StockCharts TV YouTube channel here!
NOTE: The stocks reported herein are from mechanical trading model scans that are based upon moving average relationships, momentum and volume. DecisionPoint analysis is then applied to get five selections from the scans. The selections given should prompt readers to do a chart review using their own analysis process. This letter is not a call for a specific action to buy, sell or short any of the stocks provided. There are NO sure things or guaranteed returns on the daily selection of "Diamonds in the Rough."
Regarding BUY/SELL Signals: The signal status reported herein is based upon mechanical trading model signals and crossovers. They define the implied bias of the price index/stock based upon moving average relationships and momentum, but they do not necessarily call for a specific action. They are information flags that should prompt chart review. Further, they do not call for continuous buying or selling during the life of the signal. For example, a BUY signal will probably (but not necessarily) return the best results if action is taken soon after the signal is generated. Additional opportunities for buying may be found as price zigzags higher, but the trader must look for optimum entry points. Conversely, exit points to preserve gains (or minimize losses) may be evident before the model mechanically closes the signal.
Helpful DecisionPoint Links:
DecisionPoint Shared ChartList and DecisionPoint Chart Gallery
Price Momentum Oscillator (PMO)
Swenlin Trading Oscillators (STO-B and STO-V)
For more links, go to DecisionPoint.com