
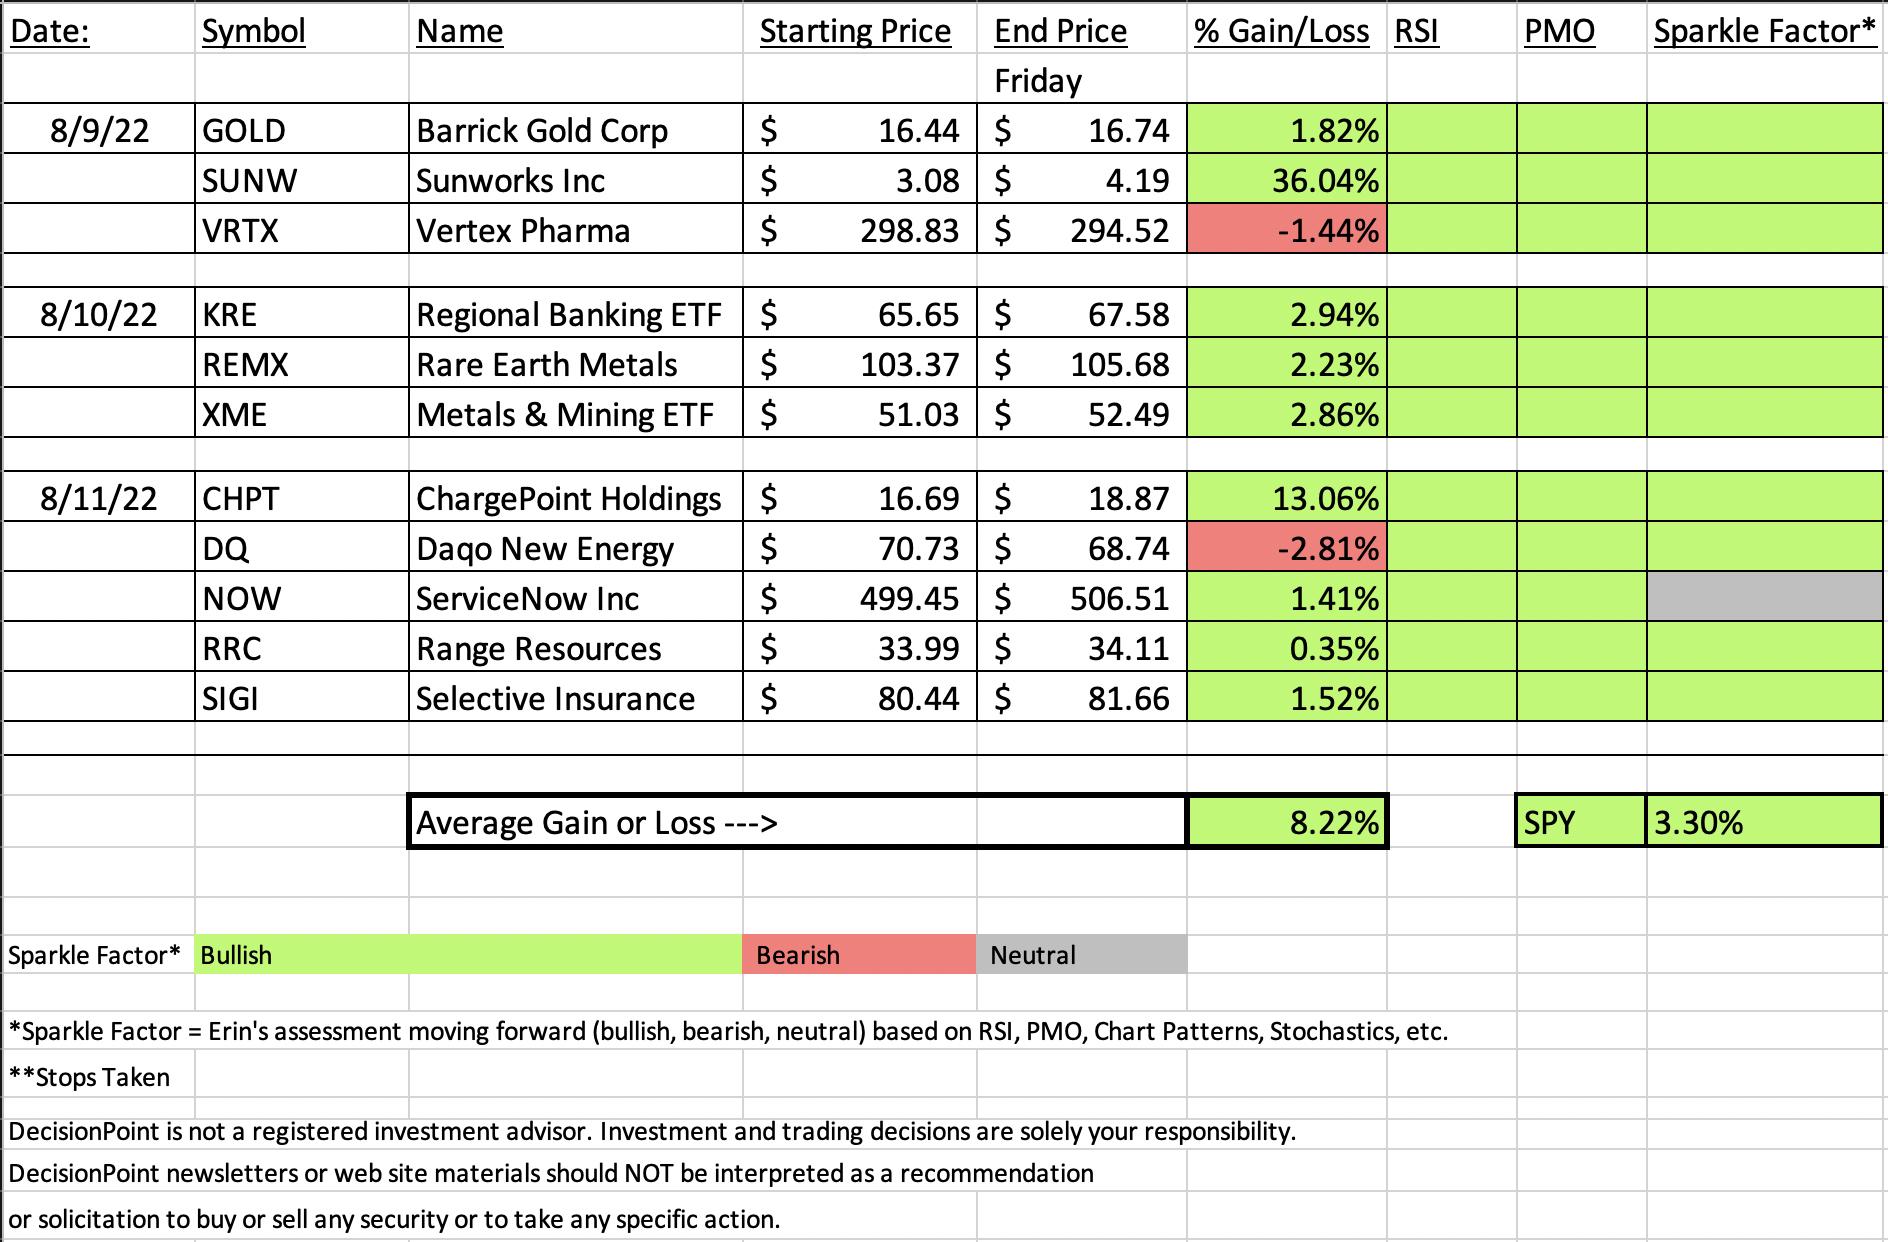
In the last DP Diamonds Recap, TPI Composites (TPIC), a Solar company, was the "Darling" of the "Diamonds in the Rough" (it's currently up over 43% since it was picked on August 2nd). This week another Solar company blew through resistance and was up over 36% since being picked Tuesday this week.
But that's only two stocks, the other stock, ChargePoint (CHPT) is a Consumer Discretionary/Specialty Retailer that focuses on electric vehicle (EV) charging stations. With the passage of the Inflation Reduction Bill, renewable energy, particularly EVs are emphasized. This has put the wind at the back of these stocks. Is it too late to get in? I don't think so. While the charts are extremely overbought, in the bull market each is in, those conditions can easily persist. Unfortunately you've missed some of the best gains, but I think there are more ahead.
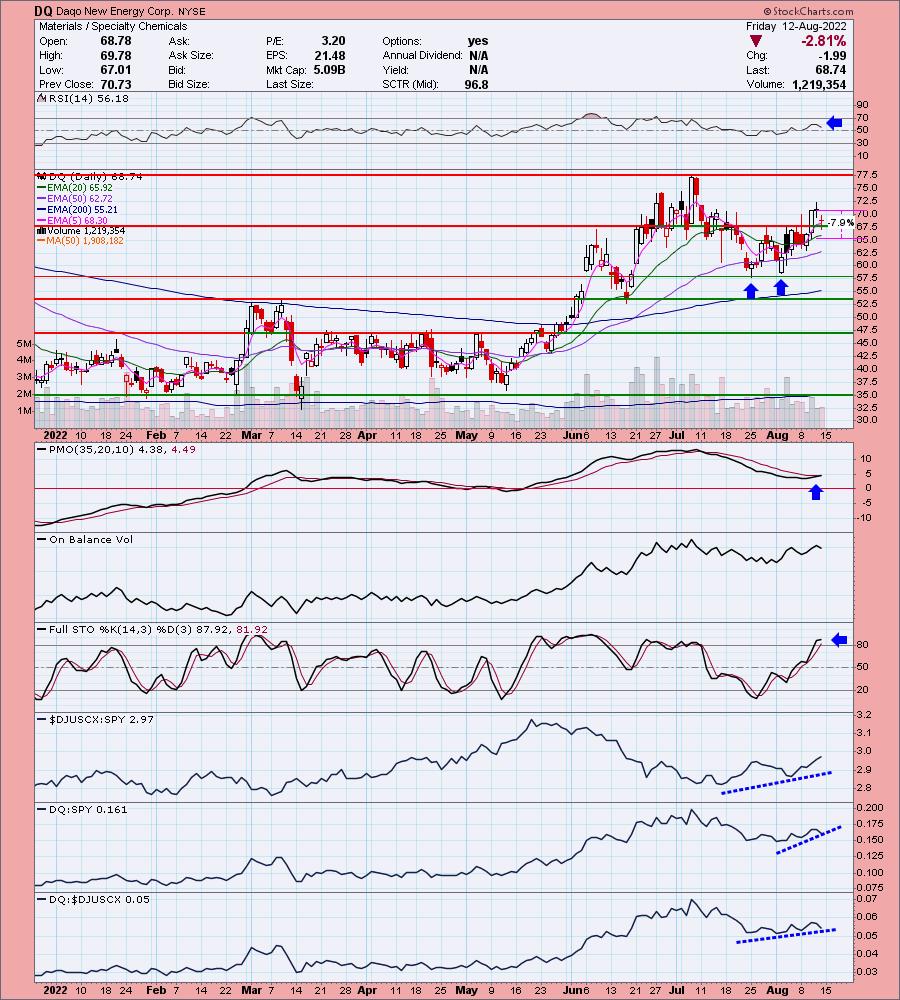
The dog this week was Daqo New Energy (DQ), a Specialty Chemicals company, but it was only down -2.81% and the chart still looks bullish--hence the "Green" Sparkle Factor on the spreadsheet.
The only stock that didn't have a Green/Bullish Sparkle Factor is ServiceNow Inc (NOW). I've marked it Gray/Neutral, not Red/Bearish. I don't like how it is starting to look toppy at overhead resistance. If I owned it, I'd hold it. However, I'd be careful about entry right now.
The recording link for today's Diamond Mine is below as well as the registration for next Friday's Diamond Mine. Have a great weekend!
Good Luck & Good Trading,
Erin

RECORDING LINK (8/12/2022):
Topic: DecisionPoint Diamond Mine (8/12/2022) LIVE Trading Room
Start Time: Aug 12, 2022 08:59 AM
Meeting Recording Link
Access Passcode: August#12
REGISTRATION For Friday 8/19 Diamond Mine:
When: Aug 19, 2022 09:00 AM Pacific Time (US and Canada)
Topic: DecisionPoint Diamond Mine (8/19/2022) LIVE Trading Room
Register in advance for this webinar HERE
Save the registration confirmation email with login instructions in case Zoom doesn't notify you in time.

A few items about the spreadsheet: I've put on the spreadsheet whether the RSI is positive (green) or negative (red). The PMO column tells you if it is rising (green) or falling (red). Finally I've added my own "Sparkle Factor" that gives you my assessment going forward, bullish (green), bearish (red) or neutral (gray). The Sparkle Factor is basically my thoughts on whether I expect it to rise or fall. A neutral means it could really go either way so it could be added to a watch list. If you're in a stock I consider "neutral" going forward, the ball is in your court.
Darling:
Sunworks, Inc. (SUNW)
EARNINGS: 8/9/2022 (BMO)
Sunworks, Inc. engages in the provision of photovoltaic and battery based power and storage systems for the residential and commercial markets. It operates through the Solcius and Sunworks business segments. The Solcius segment focuses on residential projects. The Sunworks segment deals with commercial projects including commercial, agricultural, industrial, and public works projects. The company was founded by Roland F. Bryan, Mark P. Harris, and Christopher T. Kleveland in 1983 and is headquartered in Provo, UT.
Predefined Scans Triggered: P&F Double Top Breakout.
Below are the commentary and chart from Tuesday (8/9):
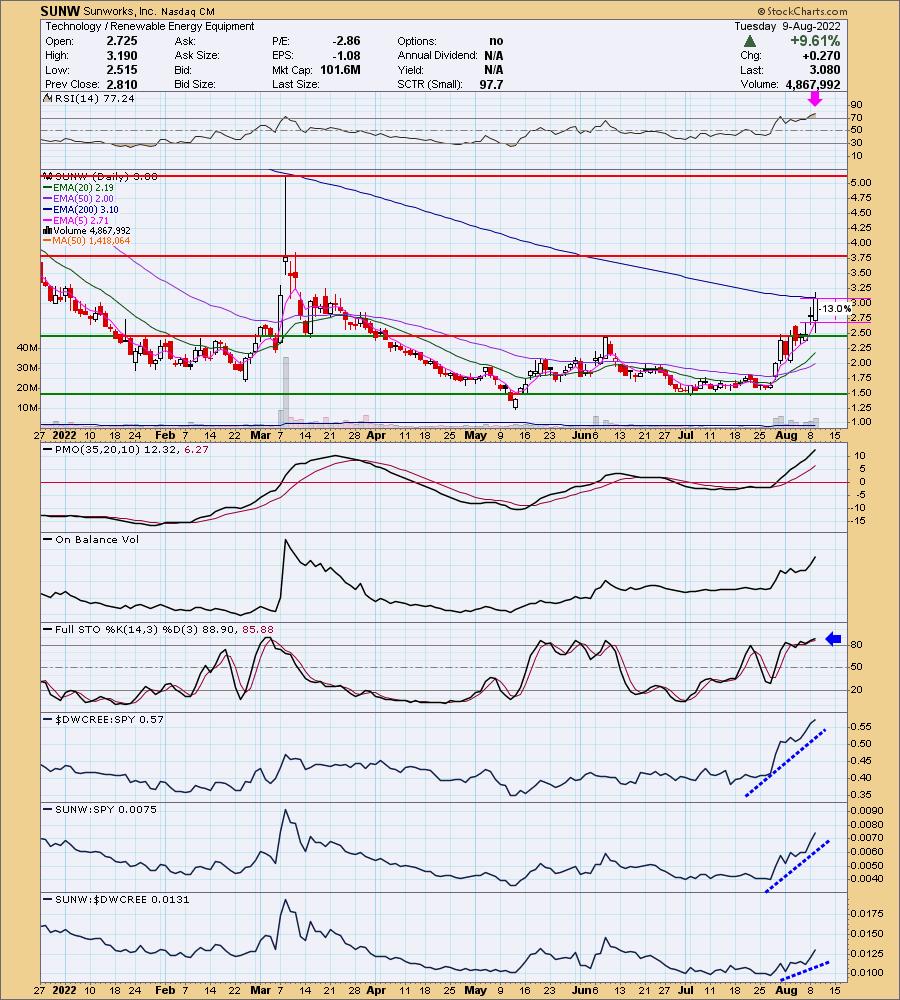
"SUNW is down -1.30% in after hours trading. They reported earnings before the market opened and clearly investors liked it. Please note this is a very low-priced stock, so position size wisely. A pullback is highly likely after a move this strong. That would offer you a better entry and the 13% stop level I've listed will be smaller. I don't like to list stops that deep, but it is taking into account a possible pullback before entry. The RSI is overbought which I'm not thrilled with, but price action has been impressive. Remember overbought conditions can persist for a stock in a bull market. It nearly closed above the 200-day EMA today. The PMO is rising strongly and is somewhat overbought. We do see the bottom of its range is generally -15, so the current +12.32 reading isn't that bad. The OBV is confirming the rally, Stochastics are above 80 and oscillating, and relative strength is excellent. As noted above the stop is deep, but a pullback will help. Of course we have a bullish engulfing candlestick today so it may continue higher."
Here is today's chart:
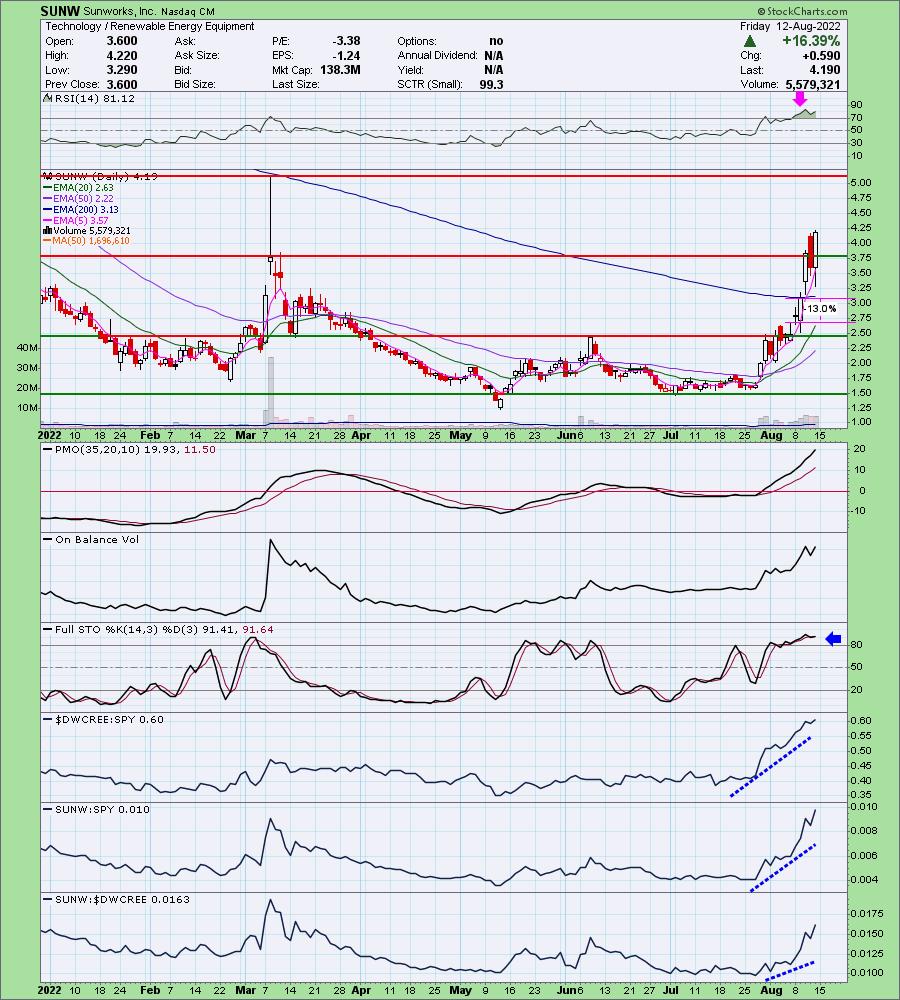
What is there to say. This one ignored overbought conditions and rallied strongly today. As noted in the opening, a stock that is in a strong bull market will be able to hold overbought conditions for some time. The PMO is overbought, but clearly doesn't care. The RSI is extremely overbought, but doesn't care. I don't think it is too late to get in on these stocks, but a trip into TAN, the Solar ETF, might be a less volatile ride.
Don't forget, on Thursdays I look at reader-requested symbols, so shoot me an email at erin@decisionpoint.com. I read every email I receive and try to answer them all!
Dud:
Daqo New Energy Corp. (DQ)
EARNINGS: 10/27/2022 (BMO)
Daqo New Energy Corp. is a holding company, which engages in the provision of polysilicon products. It involves in the manufacture and sale of polysilicon to photovoltaic product manufactures, who further process the polysilicon into ingots, wafers, cells, and modules for solar power solutions. The company was founded by Guang Fu Xu on November 22, 2007 and is headquartered in Shanghai, China.
Predefined Scans Triggered: P&F Bullish Catapult, Filled Black Candles, P&F Ascending Triple Top Breakout and P&F Double Top Breakout.
Below are the commentary and chart from Thursday (8/11):
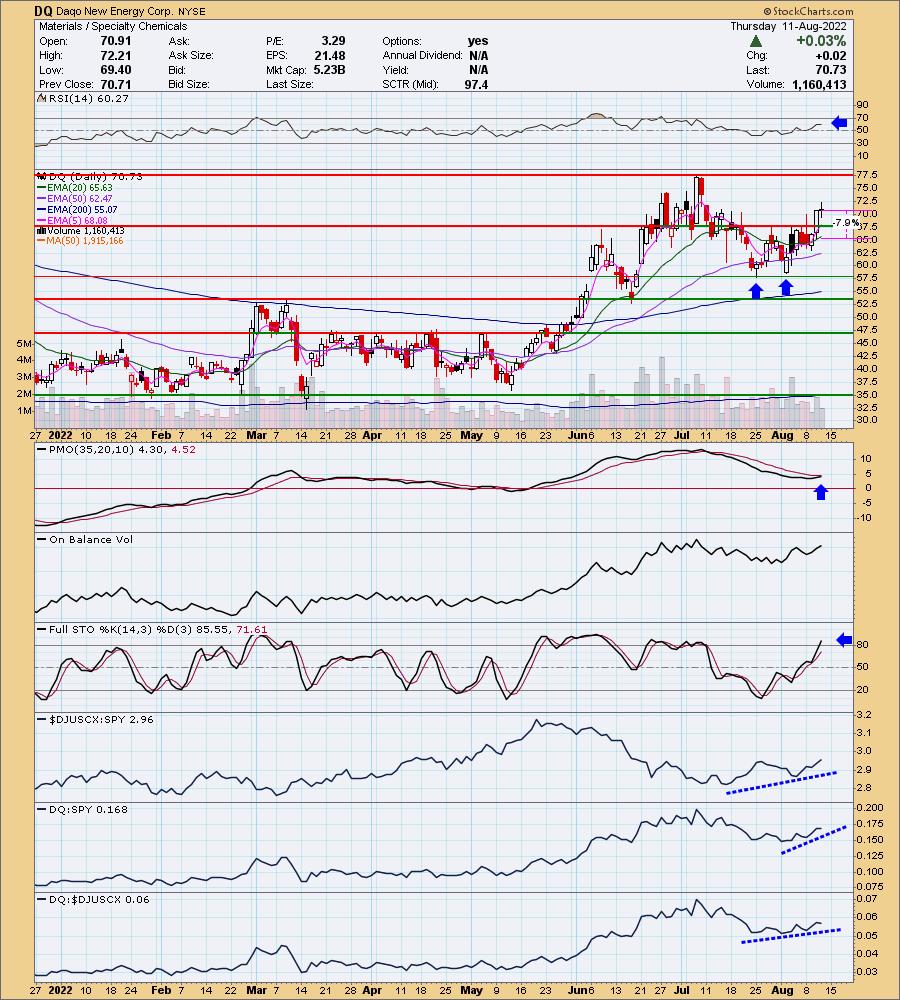
"DQ is down -1.02% in after hours trading. I must say that every time I see this symbol I think "Dairy Queen" as that is what we call it. Pretty sure I don't want to eat what Daqo produces. We have a bullish double bottom pattern that executed on yesterday's breakout. The minimum upside target is just past the July high. The RSI is positive and the PMO is nearing a crossover BUY signal. Stochastics are above 80 and relative strength is very good. I've set the stop below support and the 20-day EMA at 7.9% or around $65.14."
Here is today's chart:
I believe this chart still has merit. It only had one day as a "Diamond in the Rough". This pullback is constructive and support is still holding. The PMO is about to trigger a crossover BUY signal. I think it just had a bad day as it needed to pullback to the breakout point.
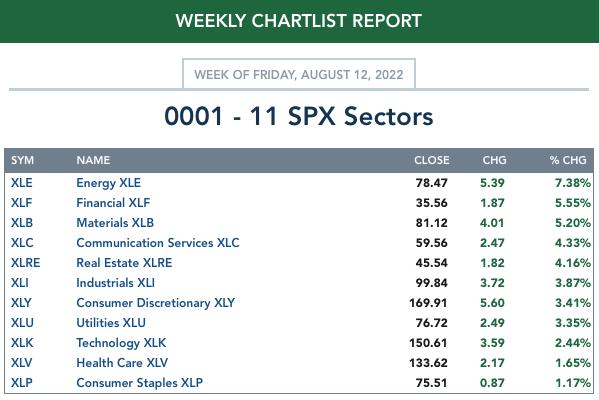
THIS WEEK's Sector Performance:
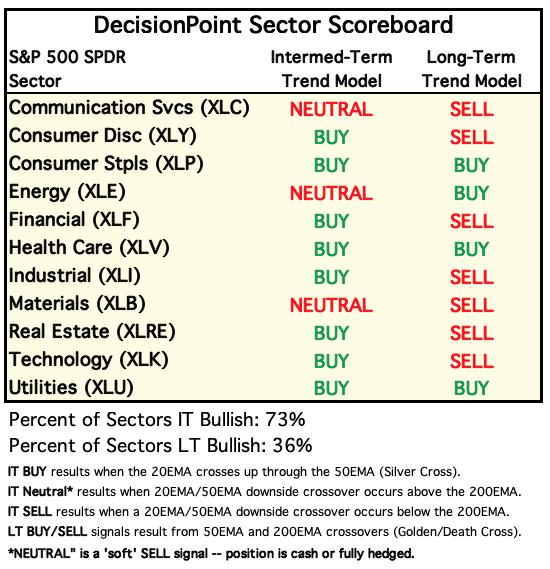
DecisionPoint Sector Scoreboard (Mechanical Trend Model Signals):
Click Here to view Carl's annotated Sector ChartList!
RRG® Daily Chart ($ONE Benchmark):
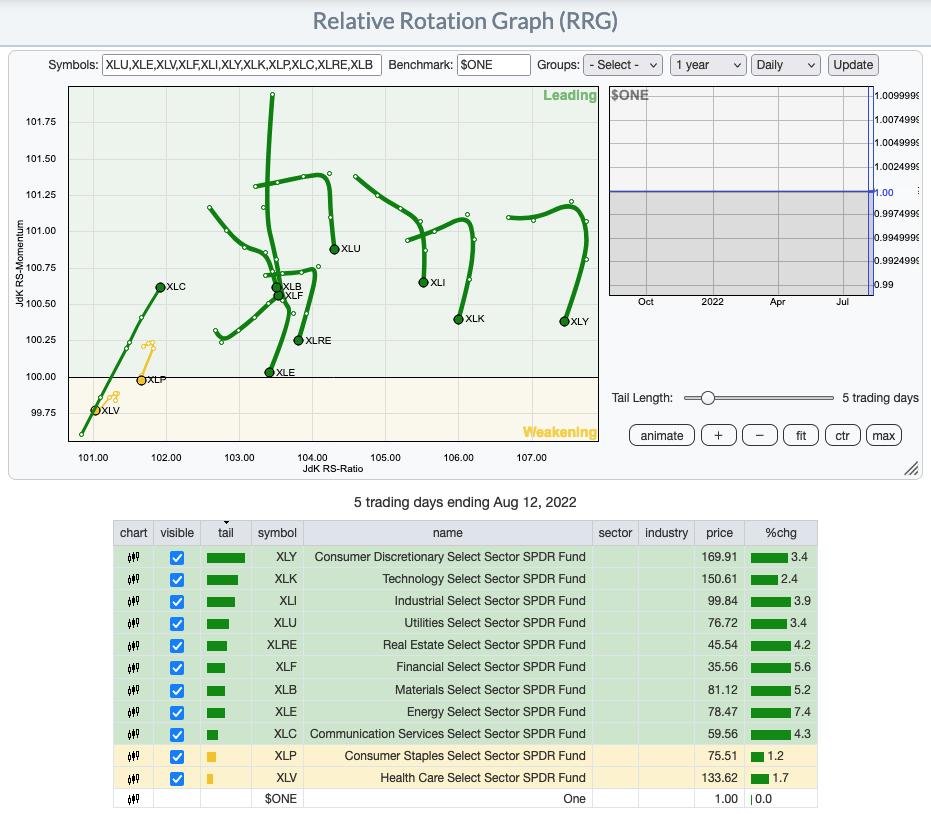
We see new leadership arising and that is from XLC and XLF. Looking at their charts in the Diamond Mine this morning (Diamond subscriber-only trading room), it isn't surprising that these two are getting renewed strength.
XLP and XLV are the most bearish given their bearish southwest headings and being the only sectors in the Weakening quadrant.
However, we see bullish rotation deteriorating on most of the other sectors. XLE, XLRE, XLI, XLK and XLY all have bearish southwest headings even though they are resident in the Leading quadrant.
More neutral sectors would be XLU and XLB. They looks somewhat bearish as they travel southward, but they still have an eastward component to their heading.
RRG® Weekly Chart ($ONE Benchmark):
The weekly RRG is overall. All sectors with the exception of XLU, XLB and XLE, have bullish northeast headings and are rising strongly. XLP is in the Lagging quadrant, but its bullish northeast heading nearly pushed it into the Leading quadrant to finish the week.
The intermediate-term picture is still bright based on the RRG, but less so on the short-term daily RRG above.
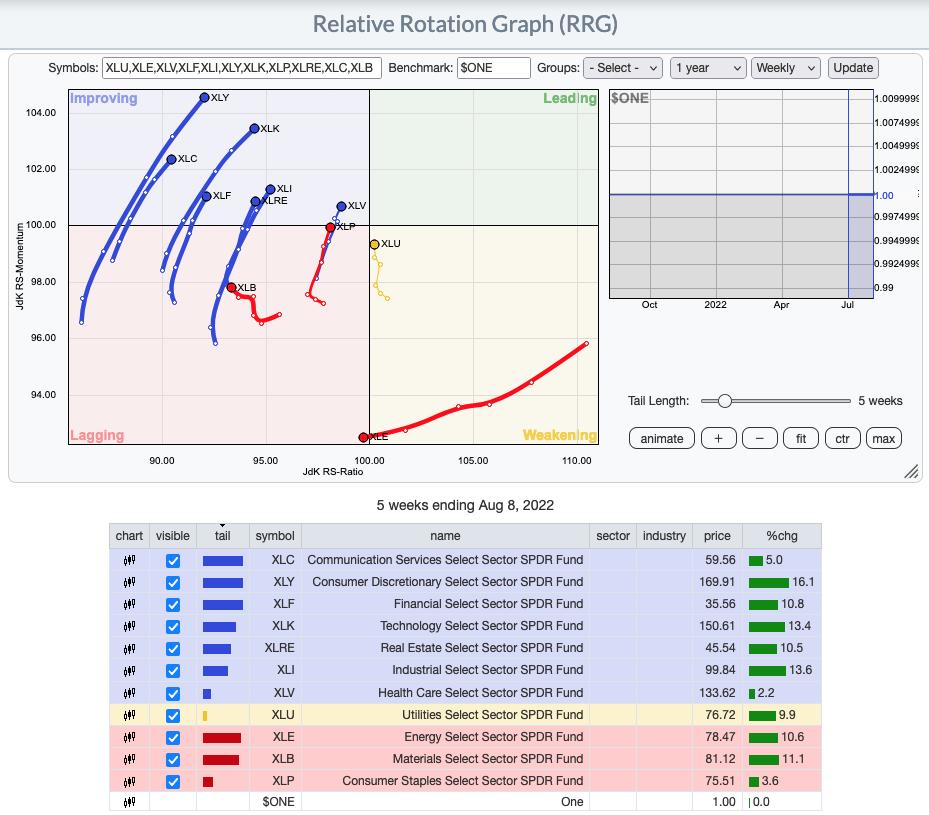
RRG® charts show you the relative strength and momentum for a group of stocks. Stocks with strong relative strength and momentum appear in the green Leading quadrant. As relative momentum fades, they typically move into the yellow Weakening quadrant. If relative strength then fades, they move into the red Lagging quadrant. Finally, when momentum starts to pick up again, they shift into the blue Improving quadrant.
CLICK HERE for an animated version of the RRG charts.
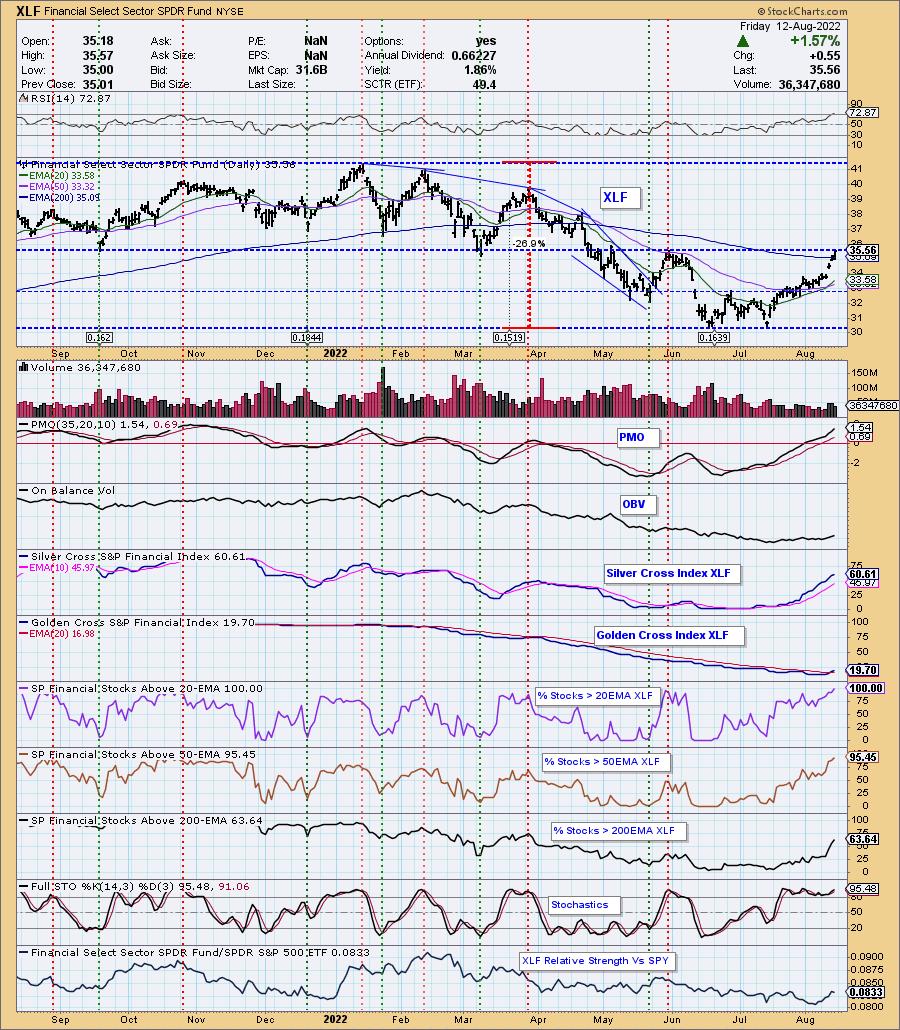
Sector to Watch: Financials (XLF)
I'm going with the sector I liked best this morning, but I'll tell you, it was a very close tie between XLF and XLI. The tiebreaker turned out to be the Silver Cross Index (SCI). It looked good on XLI, but overbought and a little toppy. XLF's SCI is just getting started. Notice we have new relative strength and now 100% of XLF have price above their 20-day EMAs. We also got an IT Trend Model "Silver Cross" BUY signal on XLF Wednesday as the 20-day EMA crossed above the 50-day EMA. I think this sector will do very well this coming week. But don't count out XLI!
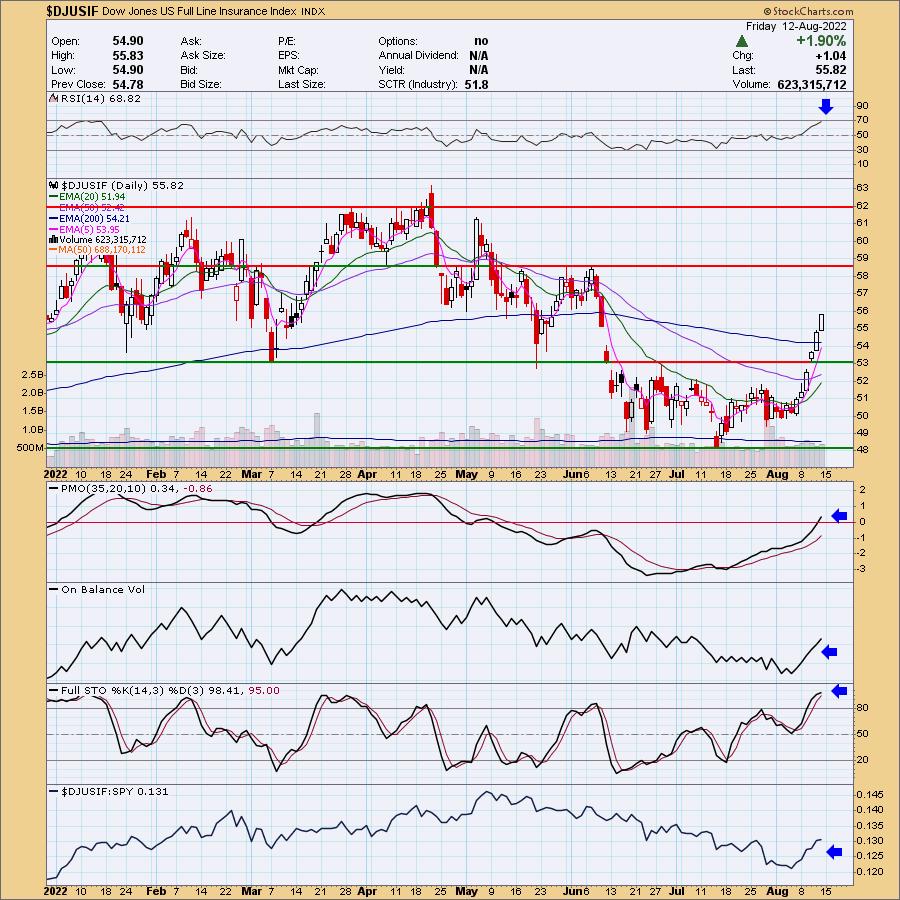
Industry Group to Watch: Full Line Insurance ($DJUSIF)
To be honest, I liked the look of every single industry group within Financials when I went through them after the close. However, I had to just pick one so I'll go with the group we talked about in the Diamond Mine, Full Line Insurance. The rally this week has been astounding, but there is plenty of upside potential left. The RSI is positive and the PMO just moved into positive territory this week. Volume has been flying in on the rally too. The OBV has made a strong upside move in response. Stochastics are very strong and relative strength is picking up on the rally of the past two weeks. A few stocks we found in the Diamond Mine in this group and two from Property/Casualty: AIG, KMPR, PLMR and AJG.
Go to our Sector ChartList on DecisionPoint.com to get an in-depth view of all the sectors.
Have a great weekend! Good Luck & Good Trading!
- Erin
erin@decisionpoint.com
Full Disclosure: I'm 60% exposed and considering adding CHPT and possibly AJG next week.
Watch the latest episode of DecisionPoint with Carl & Erin Swenlin on Mondays 7:00p EST or on the DecisionPoint playlist on the StockCharts TV YouTube channel here!
Technical Analysis is a windsock, not a crystal ball. --Carl Swenlin
NOTE: The stocks reported herein are from mechanical trading model scans that are based upon moving average relationships, momentum and volume. DecisionPoint analysis is then applied to get five selections from the scans. The selections given should prompt readers to do a chart review using their own analysis process. This letter is not a call for a specific action to buy, sell or short any of the stocks provided. There are NO sure things or guaranteed returns on the daily selection of "diamonds in the rough."
Helpful DecisionPoint Links:
DecisionPoint Shared ChartList and DecisionPoint Chart Gallery
Price Momentum Oscillator (PMO)
Swenlin Trading Oscillators (STO-B and STO-V)
(c) Copyright 2022 DecisionPoint.com