
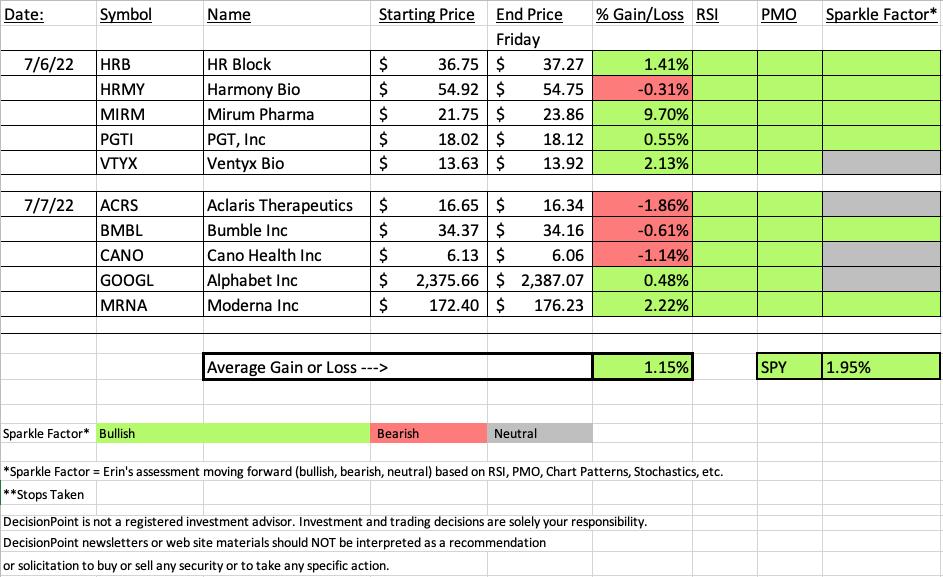
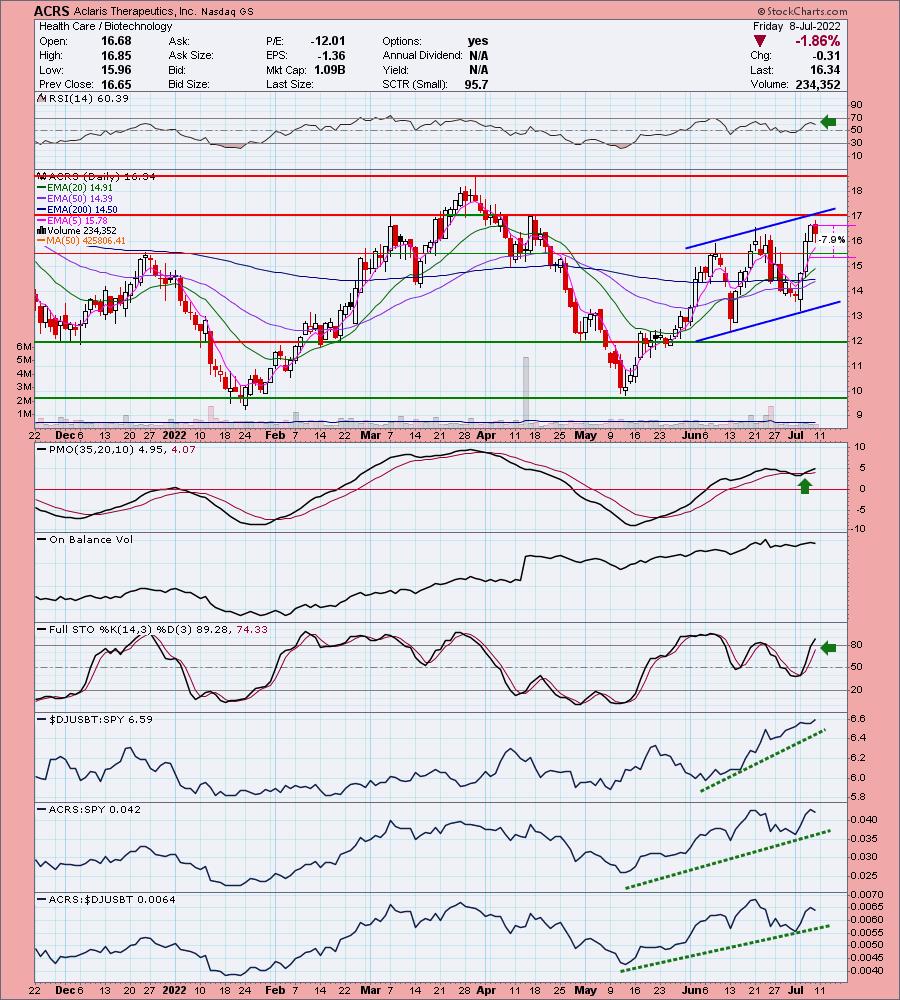
It was a positive finish for "Diamonds in the Rough" this week as we averaged +1.15%. Given it was a short week and picks came only on Wednesday and Thursday, I was pleased to see our "Darling" this week up +9.7%! The "Dud" this week was down -1.86% which isn't terrible.
Both the Darling and the Dud are in the Healthcare sector--Pharma and Biotech respectively. Biotechs have been on our list since late June and they have been performing very well. Unfortunately this week's Dud was a Biotech. It shows you how hit and miss that industry group can be. There are over 580 stocks listed in that industry group so picking the best of the bunch isn't always easy. Pharma is also outperforming. Just look at Moderna (MRNA) and this week's Darling, Miriam Pharmaceuticals (MIRM).
This sector was hands down the "Sector to Watch" this morning with industry groups that are outperforming. I'll discuss my "Industry Group to Watch" below and share one symbol that had a very favorable chart.
The new "DecisionPoint Trading Room" begins on Monday. Carl will now be in the room and the recording will be aired on StockChartsTV at 3p ET. We would love to have you there live! Carl is enthusiastic and is really looking forward to interacting with all of you.
Mom will likely go in for heart surgery Monday or Tuesday so our publishing schedule will continue to be irregular. Just know that you'll always have your reports before the market opens the next day.
Remember that the recording and registration links are in EVERY Diamonds Report.
Next Diamonds report will be on Tuesday, July 12th and the LIVE DP Trading Room will be this Monday (7/12) at Noon ET.
Good Luck & Good Trading,
Erin

RECORDING LINK (7/8/2022):
Topic: DecisionPoint Diamond Mine (7/8/2022) LIVE Trading Room
Start Time: Jul 8, 2022 09:00 AM PT
Access Passcode: July#8th
REGISTRATION FOR Friday 7/15 Diamond Mine:
When: Jul 15, 2022 09:00 AM Pacific Time (US and Canada)
Topic: DecisionPoint Diamond Mine (7/15/2022) LIVE Trading Room
Register in advance for this webinar HERE.
Save the registration confirmation email with login instructions in case Zoom doesn't notify you in time.

Free DP Trading Room (7/5/2022) RECORDING LINK:
Topic: DecisionPoint Trading Room
Start Time: Jul 5, 2022 08:55 AM
Meeting Recording Link
Access Passcode: July$5th
For best results, copy and paste the access code to avoid typos.
A few items about the spreadsheet: I've put on the spreadsheet whether the RSI is positive (green) or negative (red). The PMO column tells you if it is rising (green) or falling (red). Finally I've added my own "Sparkle Factor" that gives you my assessment going forward, bullish (green), bearish (red) or neutral (gray). The Sparkle Factor is basically my thoughts on whether I expect it to rise or fall. A neutral means it could really go either way so it could be added to a watch list. If you're in a stock I consider "neutral" going forward, the ball is in your court.
Darling:
Mirum Pharmaceuticals Inc. (MIRM)
EARNINGS: 8/4/2022 (BMO)
Mirum Pharmaceuticals, Inc. is a biopharmaceutical company. The firm focuses on the development and commercialization of a late-stage pipeline of novel therapies for debilitating liver diseases. Its products include Maralixibat and Volixibat. The company was founded by Niall O'Donnel, Michael Grey and Christopher Peetz in May 2018 and is headquartered in Foster City, CA.
Predefined Scans Triggered: P&F Double Top Breakout.
Below are the commentary and chart from Wednesday (7/6):
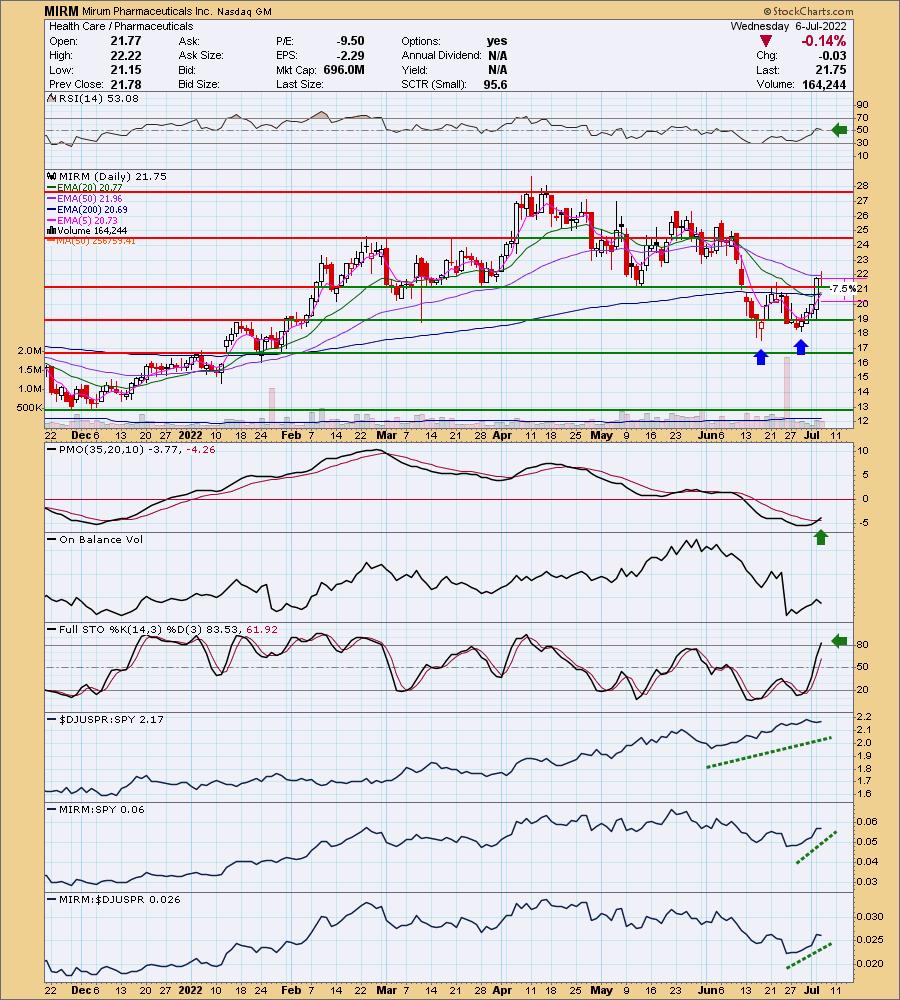
"MIRM was unchanged in after hours trading. I covered MIRM on April 5th 2022. The position is closed. We have a bullish double-bottom pattern that was confirmed with yesterday's breakout. While price closed slightly lower today, it traded above the confirmation line of the double-bottom. The RSI is positive and the PMO just triggered a crossover BUY signal. The OBV isn't confirming given the negative divergence between price tops (rising) and OBV tops (falling). Stochastics just moved above 80 and relative strength is excellent. The stop is set below the 200-day EMA."
Here is today's chart:
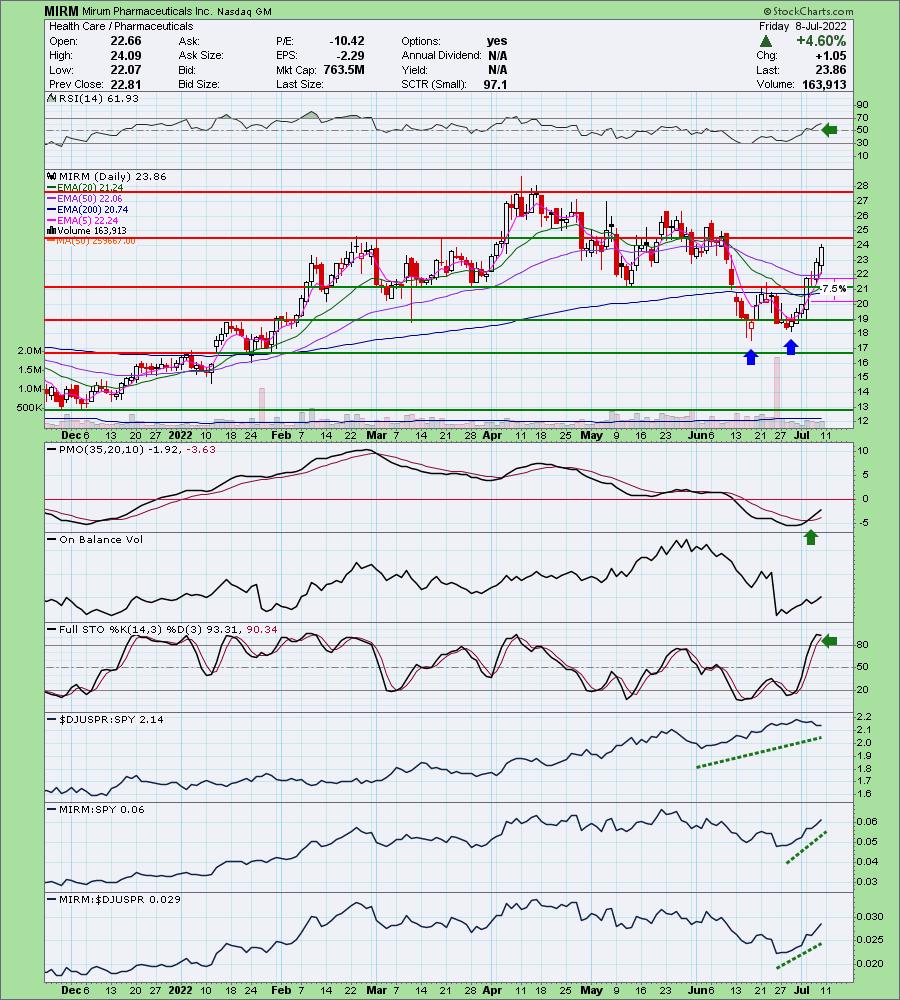
This chart is still very bullish. If I had one complaint it would be that price is nearing overhead resistance. The rest of the indicators are favorable, although Stochastics are tipping over. That doesn't concern me given they are still firmly above 80 and it was really only a "tick" downward.
Don't forget, on Thursdays I look at reader-requested symbols, so shoot me an email at erin@decisionpoint.com. I read every email I receive and try to answer them all!
Dud:
Aclaris Therapeutics, Inc. (ACRS)
EARNINGS: 8/3/2022 (BMO)
Aclaris Therapeutics, Inc. operates as a dermatologist-led biopharmaceutical company, which engages in identifying, developing, and commercializing novel drugs to address the needs in medical and aesthetic dermatology and immunology. It operates through the Therapeutics and Contract Research segments. The Therapeutics segment focuses on identifying, developing, and commercializing different therapies to address significant unmet needs in medical and aesthetic dermatology. The Contract Research segment provides laboratory services under contract research arrangements to pharmaceutical and biotech companies. The company was founded by Neal S. Walker, Frank Ruffo, Kamil Ali-Jackson, Christopher V. Powala, and Stuart D. Shanler in July 2012 and is headquartered in Wayne, PA.
Predefined Scans Triggered: New CCI Buy Signals, Moved Above Upper Price Channel and Parabolic SAR Buy Signals.
Below are commentary and chart from yesterday (7/7):
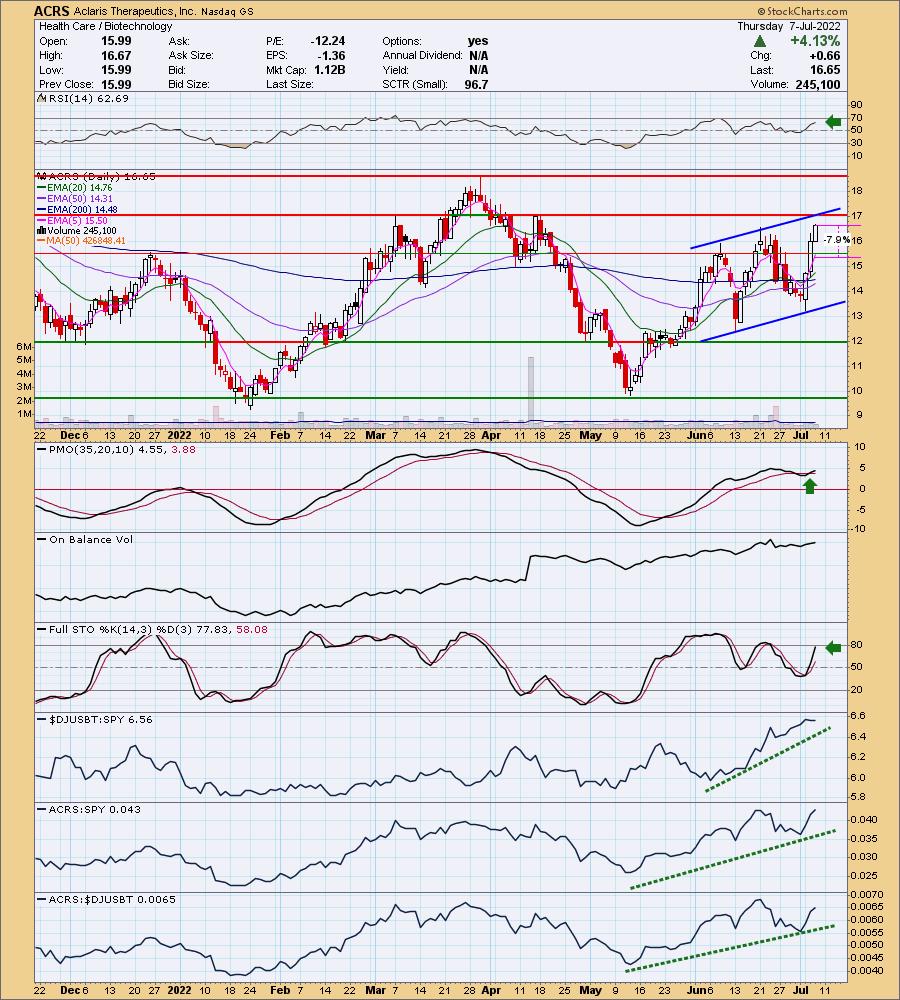
"ACRS is down -0.12% in after hours trading. A pullback wouldn't be a surprise here given today's big move. Price is also about to reach the top of the rising trend channel and resistance at early March top/mid-April high so be careful. The RSI is positive and the PMO just triggered a new crossover BUY signal. The 50-day EMA is on its way toward the 200-day EMA for a possible "golden cross". Stochastics are rising strongly and should hit 80 tomorrow. Relative strength of the group has been solid since the beginning of June. Performance by this stock is accelerating rapidly right now. The stop is set below the December top."
Here is today's chart:
The chart hasn't gotten THAT negative, but I still would rate it as "neutral" going forward. Price is now at overhead resistance and the top of a rising trend channel. While indicators are still favorable, if it doesn't breakout above $17 soon, more serious damage will be done.
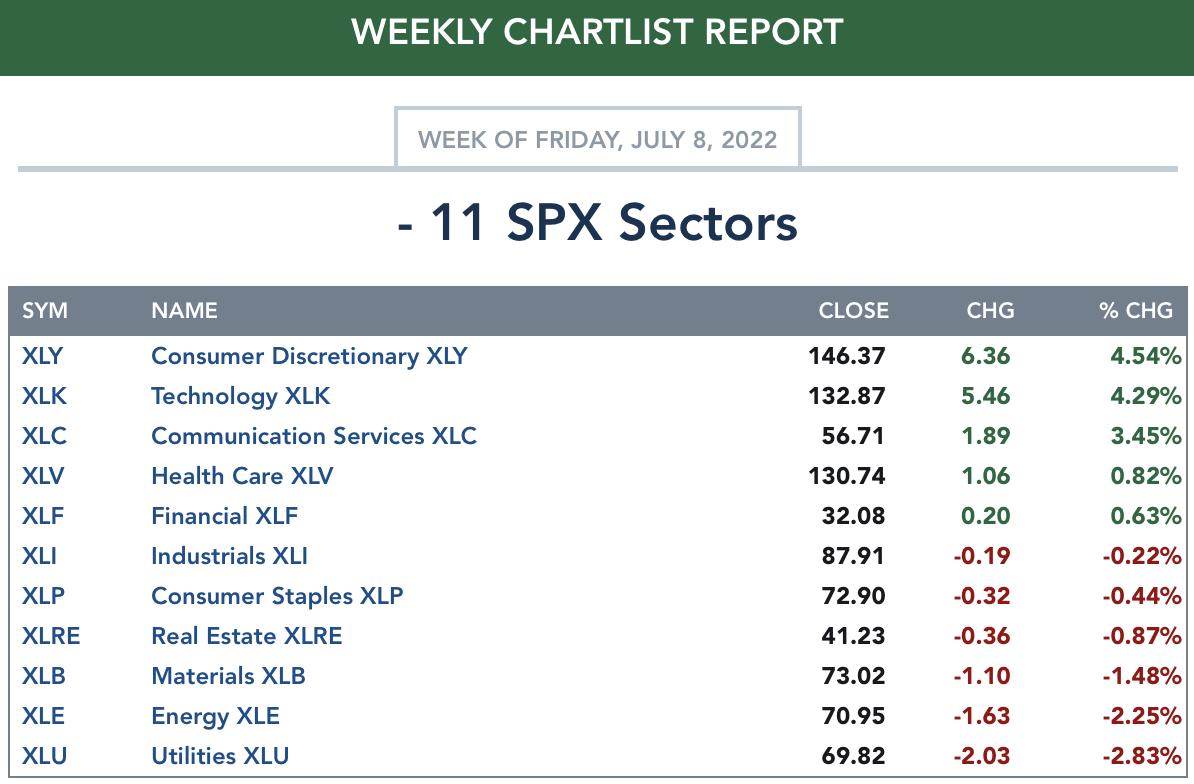
THIS WEEK's Sector Performance:
DecisionPoint Sector Scoreboard (Mechanical Trend Model Signals):

Click Here to view Carl's annotated Sector ChartList!
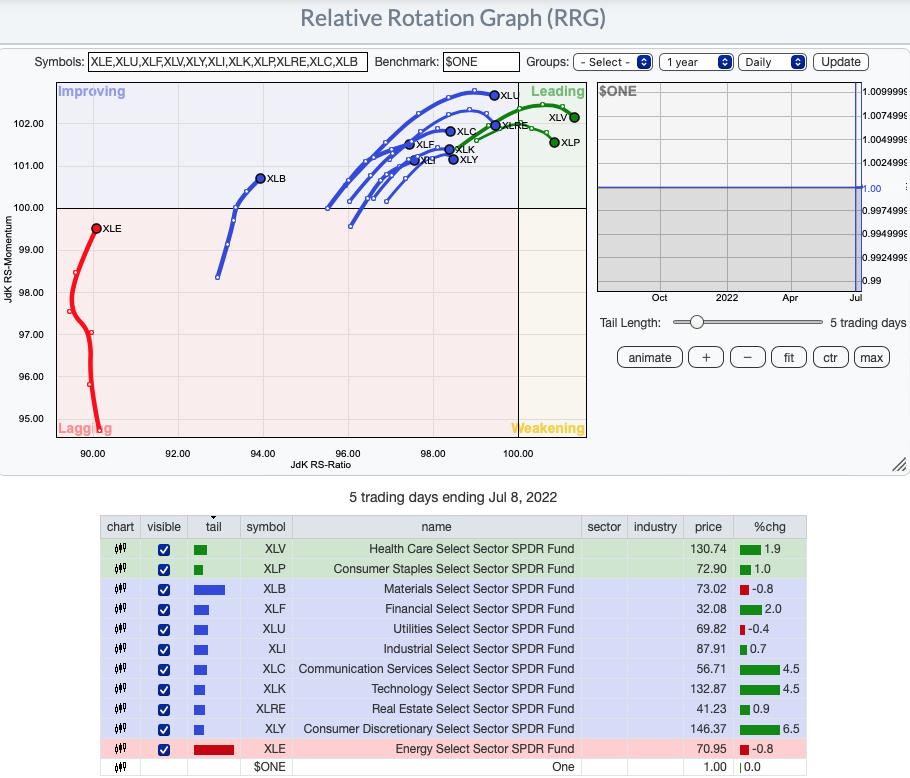
RRG® Daily Chart ($ONE Benchmark):
The majority of sectors are in the Improving quadrant. All have a eastern component to their heading so most should hit the Leading quadrant.
XLB, XLE, XLF and XLI have bullish northeast headings, but it so far away from the Leading quadrant. XLE and XLB have a lot of traveling to do in order to reach the Leading quadrant. So while they have a bullish heading, they have more work to do.
The remainder of the sectors have southeast headings which is somewhat neutral. Although we consider XLV and XLP more bullish given their position in the Leading quadrant.
RRG® Weekly Chart ($ONE Benchmark):
We're seeing some improvements on the weekly RRG. For some time we've had all of the sectors with southwest headings, now many have curled upward to move toward the Improving quadrant.
Three sectors still have bearish southwest headings, XLE, XLP and XLB. This makes sense when we step back and look at activity in the longer term. XLE has been smacked down and took away much of its previous gains. XLP had to deal with the Target (TGT) debacle and crash. It is still trying to right the ship. XLB is skewed toward Gold which has put it under pressure in the long term.
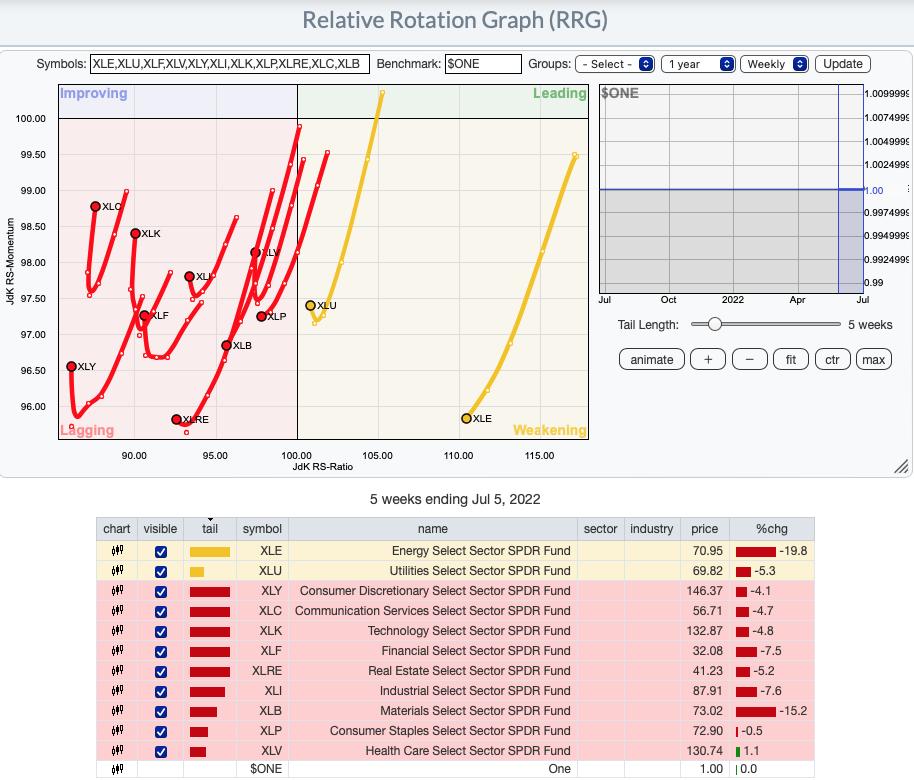
RRG® charts show you the relative strength and momentum for a group of stocks. Stocks with strong relative strength and momentum appear in the green Leading quadrant. As relative momentum fades, they typically move into the yellow Weakening quadrant. If relative strength then fades, they move into the red Lagging quadrant. Finally, when momentum starts to pick up again, they shift into the blue Improving quadrant.
CLICK HERE for an animated version of the RRG charts.
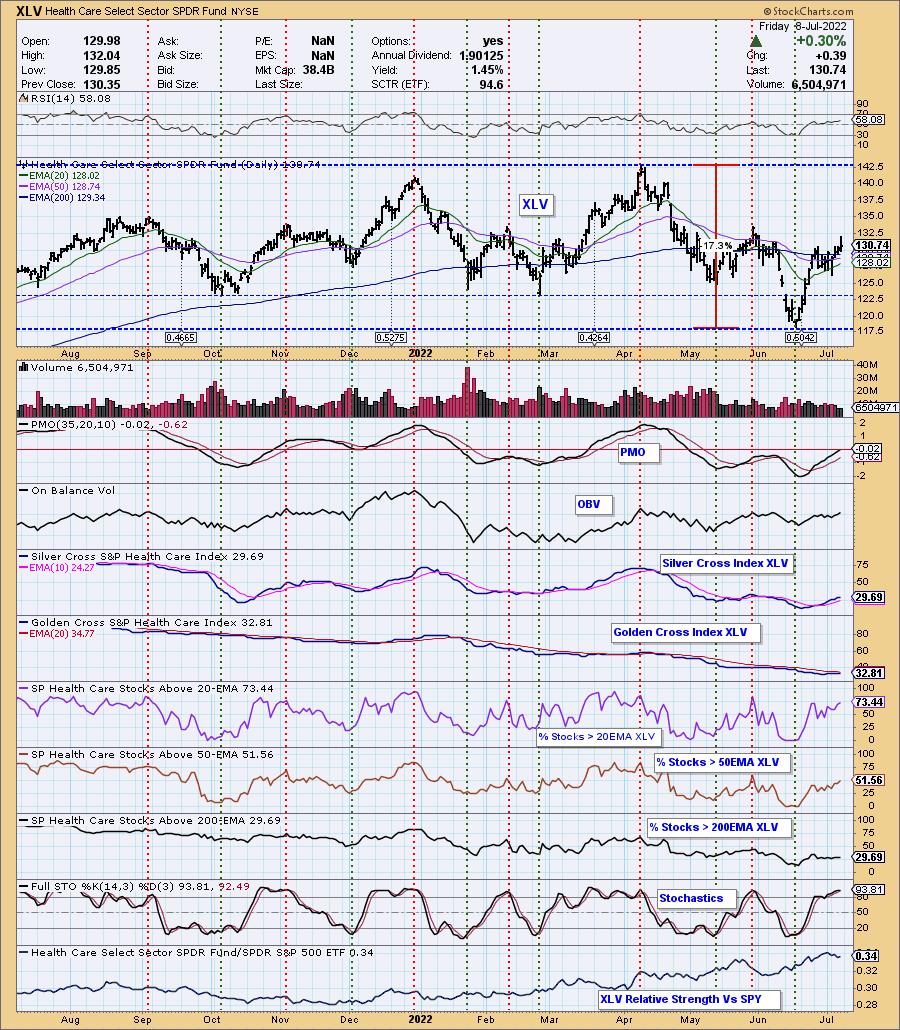
Sector to Watch: Healthcare (XLV)
I might not have picked this one had we not seen the strong breakout from the bullish flag formation as I was worried the overall rally in this sector might be over. Today's price action dispelled that concern. I was most impressed with participation. The GCI is falling still, but if we can get more stocks above their 200-day EMA, that will change.
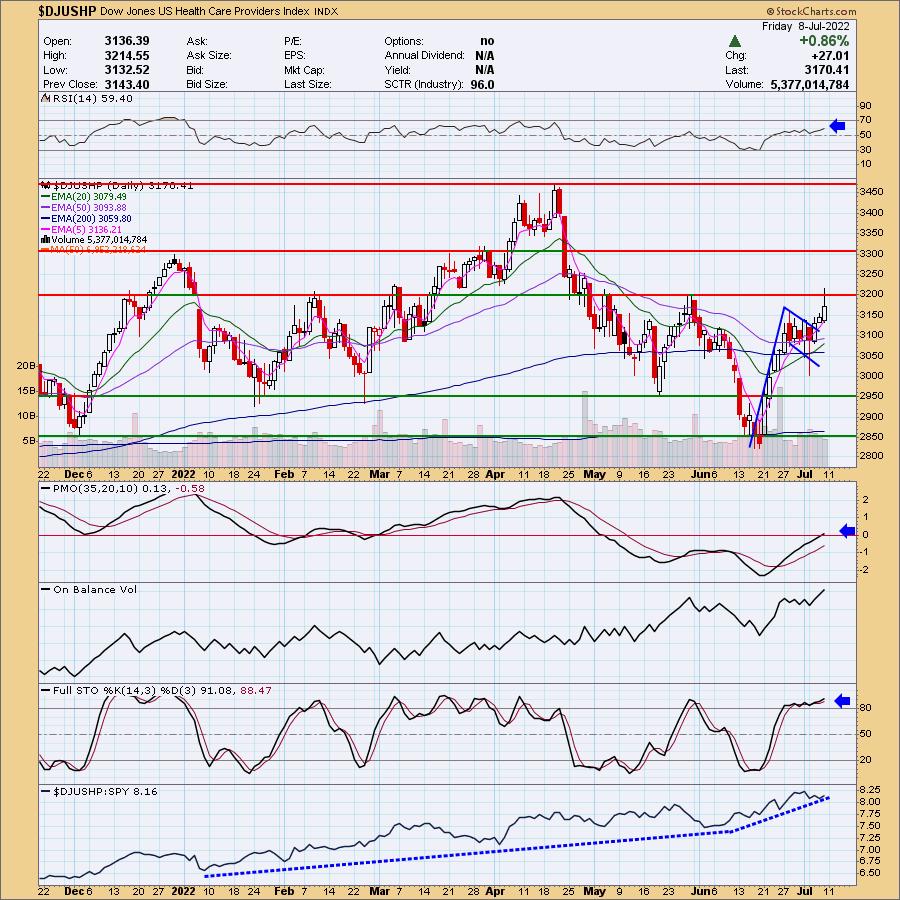
Industry Group to Watch: Healthcare Providers ($DJUSHP)
Like the XLV chart, we have a bull flag that has been confirmed with a breakout from the flag. The RSI is positive and the PMO just moved above zero on a BUY signal. Volume is coming in based on the OBV. Stochastics look excellent as they trend upward above 80. Relative strength has been rising for months and it is beginning to accelerate its rising trend.
Go to our Sector ChartList on DecisionPoint.com to get an in-depth view of all the sectors.
Have a great weekend! Good Luck & Good Trading!
- Erin
erin@decisionpoint.com
Full Disclosure: I'm 45% exposed.
Watch the latest episode of DecisionPoint with Carl & Erin Swenlin on Mondays 7:00p EST or on the DecisionPoint playlist on the StockCharts TV YouTube channel here!
Technical Analysis is a windsock, not a crystal ball. --Carl Swenlin
NOTE: The stocks reported herein are from mechanical trading model scans that are based upon moving average relationships, momentum and volume. DecisionPoint analysis is then applied to get five selections from the scans. The selections given should prompt readers to do a chart review using their own analysis process. This letter is not a call for a specific action to buy, sell or short any of the stocks provided. There are NO sure things or guaranteed returns on the daily selection of "diamonds in the rough."
Helpful DecisionPoint Links:
DecisionPoint Shared ChartList and DecisionPoint Chart Gallery
Price Momentum Oscillator (PMO)
Swenlin Trading Oscillators (STO-B and STO-V)
(c) Copyright 2022 DecisionPoint.com