
The market finished mixed today with the Dow down -0.25% and the SPX up +0.25%. The Nasdaq outperformed up nearly +1%. Where does this leave us? The Diamond PMO Scan only saw two results today, neither of which was particularly bullish. Meanwhile, the Diamond Dog Scan provided 87 choices for shorts. It seems the obvious choice is to continue to provide "Diamonds in the Rough" that are good for shorting or whatever your vehicle of choice is.
Given I had so many choices for shorting, I was surprised that I was only interested in six charts, but I'm picky if I'm going to short a stock.
What I look for in a short position:
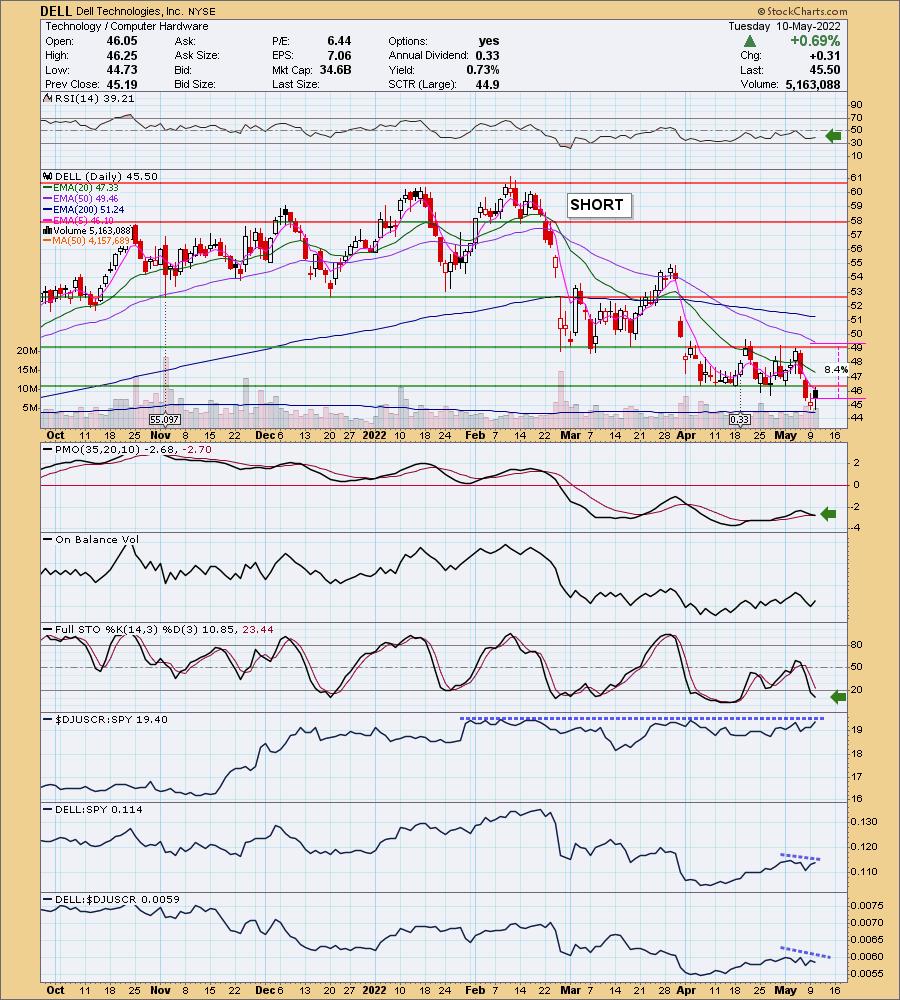
I consider a stock a shorting opportunity if strong support has been broken in the short term and price is far away from the next support level on a weekly chart. I want bearish chart patterns if possible. I want to see volume flying out of the stock/ETF.
Momentum must be negative (PMO pointing downward) and on a SELL signal or close to triggering one. RSI and Stochastics should be below net neutral (50). Relative strength should be equal (if SPY is in a bear market configuration) or worse than the benchmark SPY.
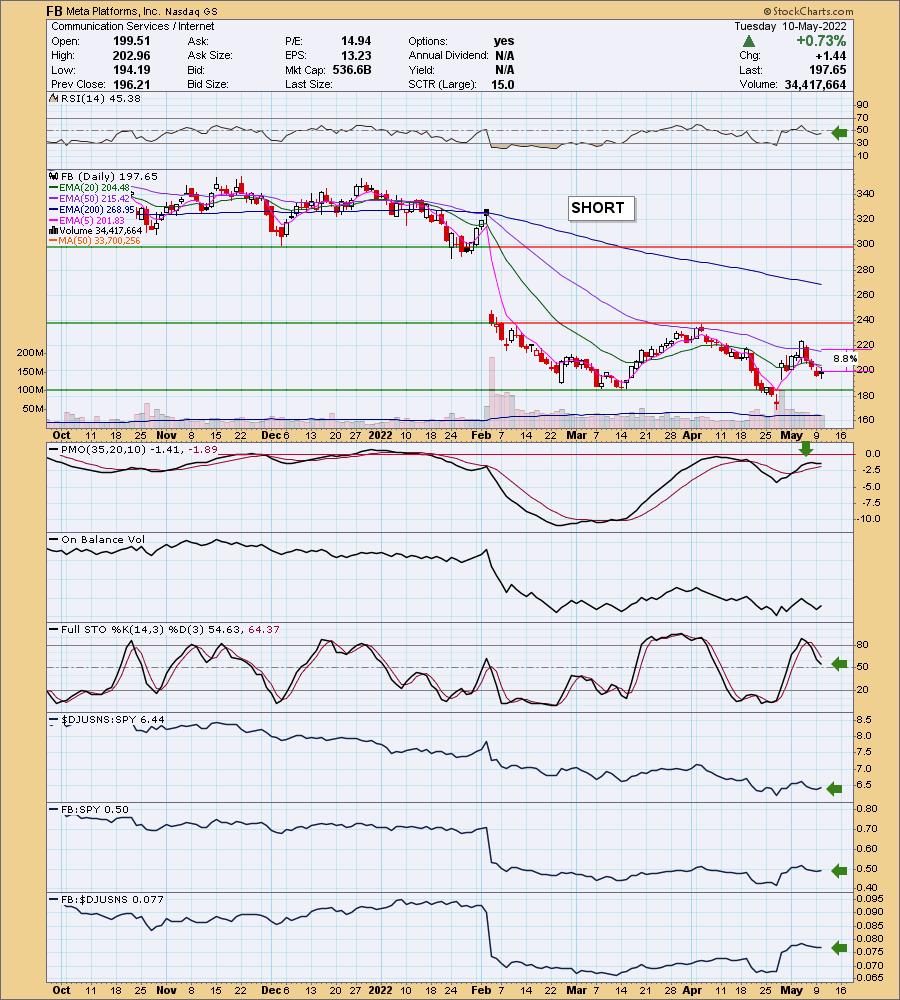
Remember that on the daily chart I'm giving you a "stop" level that is higher than today's current price. We are shorting, so we need to determine how far we will let it rally before covering the short.
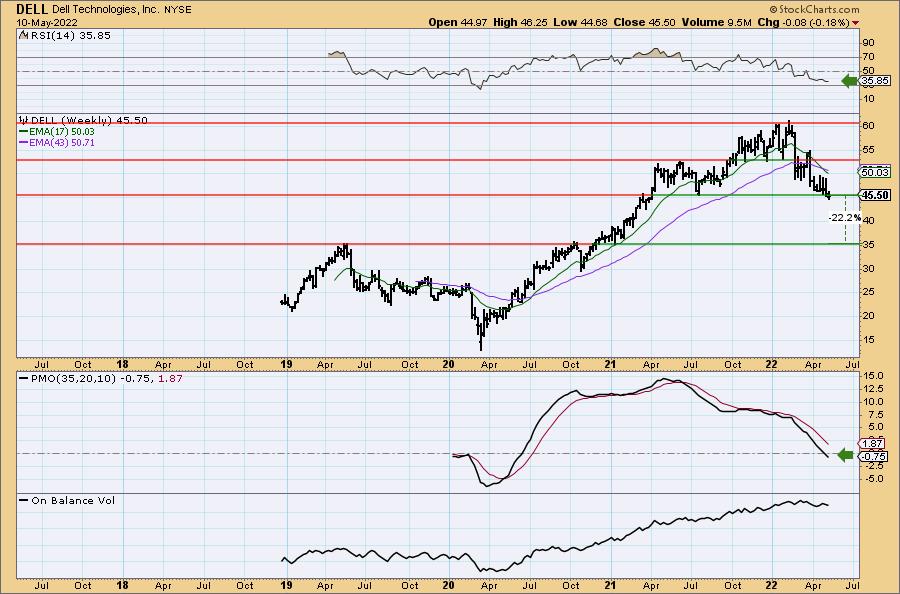
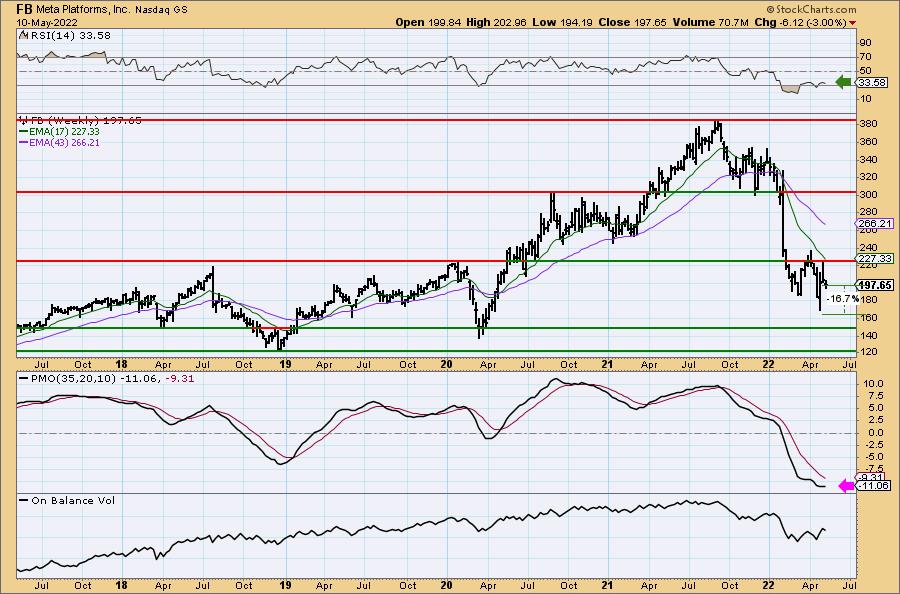
On the weekly chart the "targets" are downside targets, not upside targets.
Good Luck & Good Trading,
Erin
Today's "Diamonds in the Rough": DELL (Short), FB (Short) and FL (Short).

RECORDING LINK (5/6/2022):
Topic: DecisionPoint Diamond Mine (5/6/2022) LIVE Trading Room
Start Time: May 6, 2022 09:00 AM
Meeting Recording Link.
Access Passcode: @Maythe5th
REGISTRATION FOR Friday 5/13 Diamond Mine:
When: May 13, 2022 09:00 AM Pacific Time (US and Canada)
Topic: DecisionPoint Diamond Mine (5/13/2022) LIVE Trading Room
Register in advance for this webinar HERE.
** Save the registration confirmation email with login instructions in case Zoom doesn't notify you in time.**

Free DP Trading Room (5/9) RECORDING LINK:
Topic: DecisionPoint Trading Room
Start Time: May 9, 2022 08:59 AM
Meeting Recording Link.
Access Passcode: May#on9th
For best results, copy and paste the access code to avoid typos.
Welcome to DecisionPoint Daily Diamonds, wherein I highlight ten "Diamonds in the Rough" per week. These are selected from the results of my DecisionPoint Scans, which search for stocks that could benefit from the trend and condition of the market. Remember, these are not recommendations to buy or sell, but are the most interesting of the stocks that surfaced in my scans. My objective is to save you the work of the initial, tedious culling process, but you need to apply your own analysis to see if these stocks pique your interest as well. There are no guaranteed winners here!
"Predefined Scans Triggered" are taken from StockCharts.com using the "Symbol Summary" option instead of a "SharpChart" on the workbench.
Dell Technologies, Inc. (DELL)
EARNINGS: 5/26/2022 (AMC)
Dell Technologies, Inc. is a holding company, which engages in the provision of information technology hardware, software, and service solutions through its subsidiaries. It operates through the following segments: Infrastructure Solutions Group (ISG), Client Solutions Group (CSG), and VMware. The ISG segment includes servers, networking, and storage, as well as services and third-party software and peripherals that are closely tied to the sale of ISG hardware. The CSG segment consists of sales to commercial and consumer customers of desktops, thin client products, and notebooks. The VMware segment provides compute, cloud management, networking and security, storage and availability, and other end-user computing offerings. The company was founded by Michael Saul Dell in 1984 and is headquartered in Round Rock, TX.
Predefined Scans Triggered: Filled Black Candles and P&F Double Bottom Breakout.
DELL is down -0.99% in after hours trading. I covered DELL as a long on November 10th 2020. The position is still open and up +40.2%. Had one sold nearer to the all-time high the position would've been up about 85%. This short was presented yesterday on the DecisionPoint Show. We now have an added benefit of a positive close today as well as a bearish filled black candlestick. The RSI is negative and the PMO is nearing a crossover SELL signal well below the zero line. Price has broken short-term support and despite today's rally stay beneath that support level. Stochastics are falling in negative territory. Relative strength is fairly weak and getting weaker. The stop is set above resistance at about $49.25.
If price has a decisive (3%+) drop below this current support level, the next level available is at $35. The RSI is negative and the weekly PMO has dropped below the zero line.
Meta Platforms, Inc. (FB)
EARNINGS: 7/27/2022 (AMC)
Meta Platforms, Inc., engages in the development of social media applications. It builds technology that helps people connect, find communities, and grow businesses. It operates through the Family of Apps (FoA) and Reality Labs (RL) segments. The FoA segment consists of Facebook, Instagram, Messenger, WhatsApp, and other services. The RL segment includes augmented and virtual reality related consumer hardware, software, and content. The company was founded by Mark Elliot Zuckerberg, Dustin Moskovitz, Chris R. Hughes, Andrew McCollum, and Eduardo P. Saverin on February 4, 2004, and is headquartered in Menlo Park, CA.
Predefined Scans Triggered: Filled Black Candles.
FB is down -0.12% in after hours trading. FB has been holding support at about $180 and has been in a trading range. The recent rally failed at the 50-day EMA so I am expecting another break below $180. The RSI is negative and the PMO has topped beneath the zero line. Stochastics are still in positive territory, but despite today's rally is falling. Today's rally did end with a bearish filled black candlestick. Relative strength is flat which isn't good enough in a bear market. I've set the stop above the 50-day EMA.
FB isn't on long-term support. The next support level is between $140 and $160. Even if price only tests $160, that would be an over 16% gain on a short. The weekly RSI is negative. The weekly PMO is a bit suspect as it does appear to be flattening.
Foot Locker, Inc. (FL)
EARNINGS: 5/20/2022 (BMO)
Foot Locker, Inc. engages in the retail of athletic shoes and apparel. The firm uses its omni-channel capabilities to bridge the digital world and physical stores, including order-in-store, buy online and pickup-in-store, and buy online and ship-from-store, as well as e-commerce. It operates through following segments: North America, EMEA (Europe, Middle East, and Africa, and Asia Pacific. The North America segment includes the following banners operating in the U.S. and Canada: Foot Locker, Kids Foot Locker, Lady Foot Locker, Champs Sports, and Footaction. The EMEA segment includes the following banners operating in Europe: Foot Locker, Runners Point, Sidestep, and Kids Foot Locker. The Asia Pacific segment includes Foot Locker and Kids Foot Locker operating in Australia, New Zealand, and Asia. The company was founded on April 7, 1989 and is headquartered in New York, NY.
Predefined Scans Triggered: Stocks in a New Downtrend (Aroon), Moved Below Lower Price Channel, P&F Triple Bottom Breakdown and P&F Double Bottom Breakout.
ZIM is down -0.59% in after hours trading. I covered ZIM on January 12th 2022. This was a heartbreaker. It pulled back immediately to the 50day EMA and triggered the stop, but then bounced and didn't stop until it was up 55%. Of course, it slid back down in April.
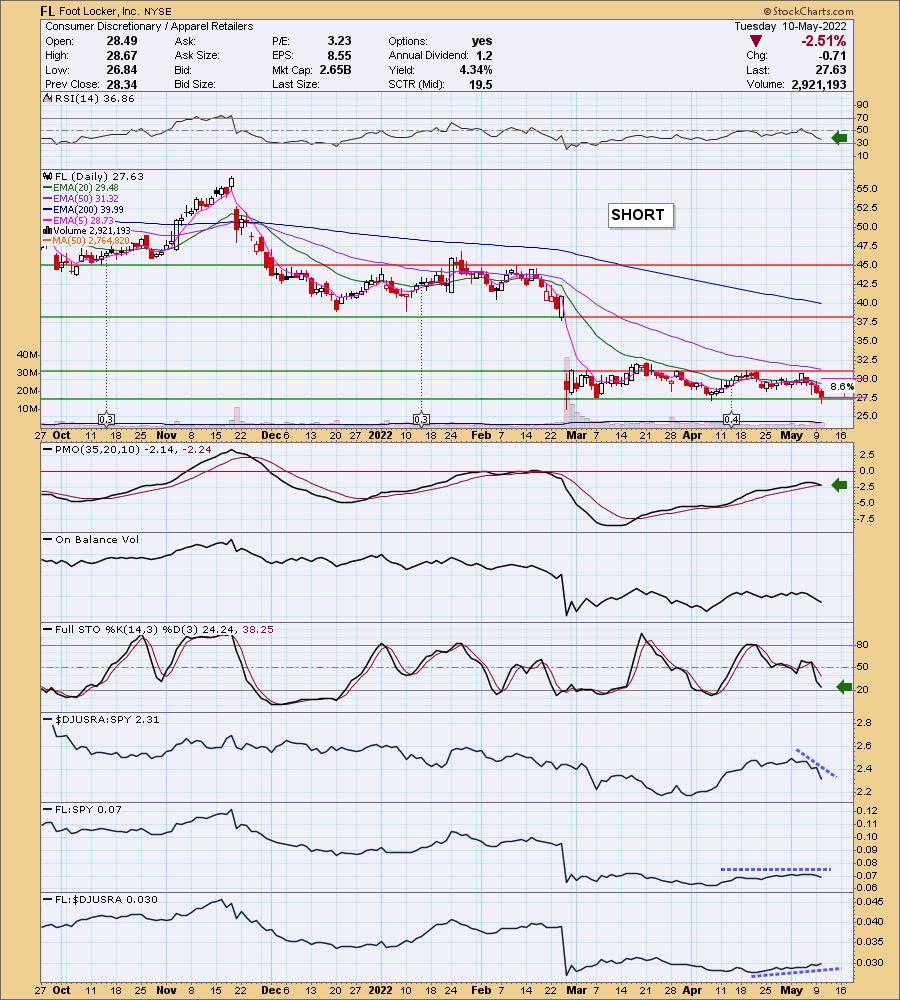
FL is up +0.47% in after hours trading. Price is testing short-term support. I prefer to see an actual breakdown, but volume has been coming in on the selling. The RSI is in negative territory and falling. The PMO topped beneath the zero line and is about to trigger a crossover SELL signal. Stochastics are negative and falling. The group is very weak against the SPY so the little outperformance FL has, it is only enough to perform as well as the market which is not good enough right now. The upside stop on this short is above the 20-day EMA.
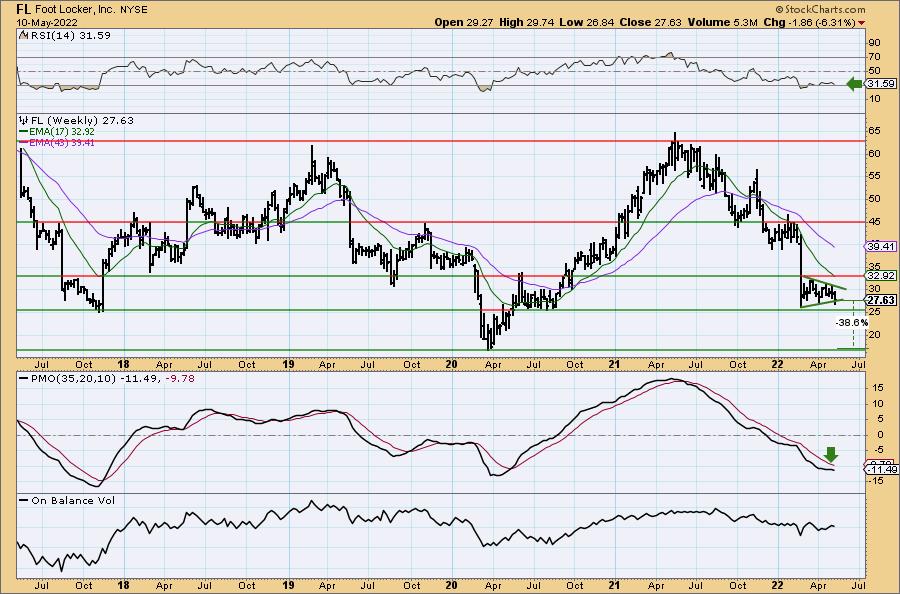
On the weekly chart there is a clear reverse flag (pennant) chart pattern. They are continuation patterns so we should expect downside resolution that would break long-term support. The weekly RSI is negative and falling. The weekly PMO has begun to decline again. If support is broken here, the next level of support arrives at the 2020 bottom. That would be an over 38% gain.
Don't forget, on Thursdays I look at reader-requested symbols, click HERE to shoot me an email. I read every email I receive and try to answer them all!
Current Market Outlook:
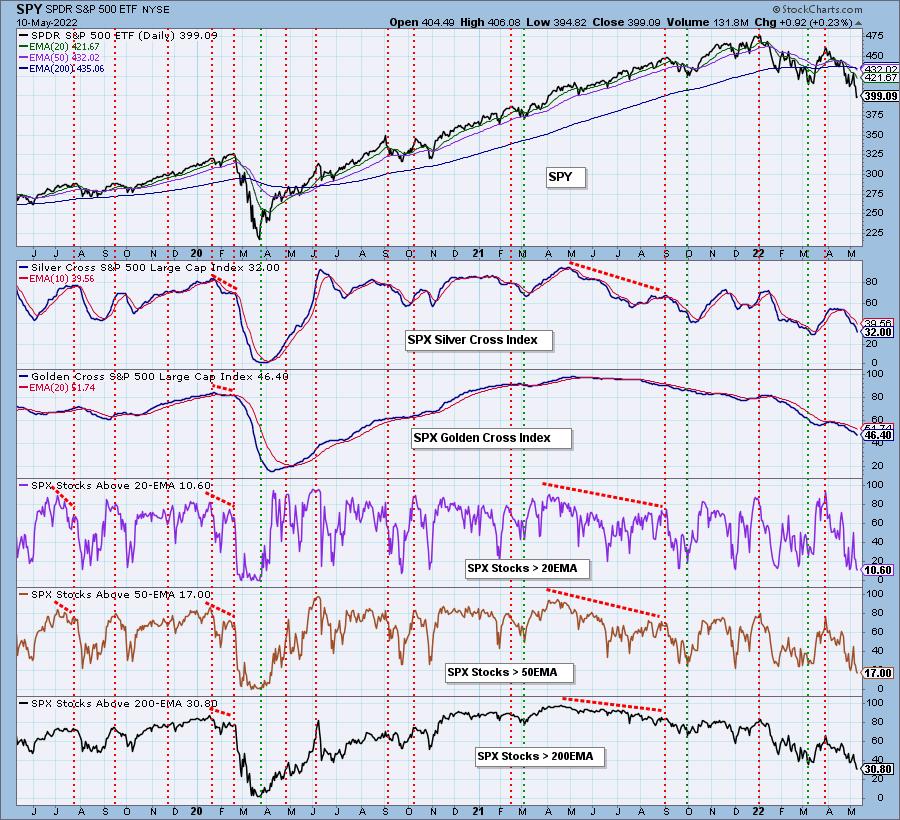
Market Environment: It is important to consider the odds for success by assessing the market tides. The following chart uses different methodologies for objectively showing the depth and trend of participation for intermediate- and long-term time frames.
- The Silver Cross Index (SCI) shows the percentage of SPX stocks on IT Trend Model BUY signals (20-EMA > 50-EMA)
- The Golden Cross Index (GCI) shows the percentage of SPX stocks on LT Trend Model BUY signals (50-EMA > 200-EMA)
Don't forget that as a "Diamonds" member, you have access to our GCI/SCI curated ChartList on DecisionPoint.com. You'll find it under "Members Only" links on the left side on the Blogs and Links Page.
Here is the current chart:
Full Disclosure: I'm 20% invested, 15% are bearish positions.
I'm required to disclose if I currently own a stock and/or may buy it within the next 72 hours.
"Technical Analysis is a windsock, not a crystal ball." - Carl Swenlin
(c) Copyright 2022 DecisionPoint.com
Watch the latest episode of DecisionPoint with Carl & Erin Swenlin on Mondays 7:00p EST or on the DecisionPoint playlist on the StockCharts TV YouTube channel here!
NOTE: The stocks reported herein are from mechanical trading model scans that are based upon moving average relationships, momentum and volume. DecisionPoint analysis is then applied to get five selections from the scans. The selections given should prompt readers to do a chart review using their own analysis process. This letter is not a call for a specific action to buy, sell or short any of the stocks provided. There are NO sure things or guaranteed returns on the daily selection of "Diamonds in the Rough."
Helpful DecisionPoint Links:
DecisionPoint Shared ChartList and DecisionPoint Chart Gallery
Price Momentum Oscillator (PMO)
Swenlin Trading Oscillators (STO-B and STO-V)
For more links, go to DecisionPoint.com