
Well, obviously, I didn't dip my toes in the water this morning...on the buy side. However, I did add inverse ETFs and an interest rate hedge ETF which is the one that I will cover today. My exposure is now roughly 25% with about 10% being on the "buy side". This should guarantee a huge rally <grin>.
One of the requests came in on the buy side, but I decided I liked it as a short position. This particular subscriber is more often right than wrong, so we'll see how it goes. One subscriber requested a Solar stock (EVGO), but I decided everyone would be better served if I presented the one I like best in the group. EVGO is underperforming in a big way. The Renewable Energy space is looking somewhat bullish, but I only saw two solar stocks I liked, RUN and JKS. I opted for JKS and you'll see why.
One request is a "juiced" 3x short ETF. I've used stop levels and upside targets at 3x. For example, a 5% stop would be a 15% stop. So don't let it confuse you. If you're going to trade these "ultra" ETFs, you need to have this mindset. It will also prevent you from sinking too much into an "ultra" position.
Don't forget to sign up for tomorrow's Diamond Mine trading room. If the market acts anything like it did today, it should be extra interesting and educational. Sign up HERE or use the link below.
Good Luck & Good Trading,
Erin
Today's "Diamonds in the Rough": JKS, PFIX, SQQQ and UPWK (Short).

Diamond Mine RECORDING LINK (4/29/2022):
Topic: DecisionPoint Diamond Mine (4/29/2022) LIVE Trading Room
Start Time: Apr 29, 2022 09:01 AM
Meeting Recording Link.
Access Passcode: April@29
REGISTRATION FOR 5/6 Diamond Mine:
When: May 6, 2022 09:00 AM Pacific Time (US and Canada)
Topic: DecisionPoint Diamond Mine (5/6/2022) LIVE Trading Room
Register in advance for this webinar HERE.
** Save the registration confirmation email with login instructions in case Zoom doesn't notify you in time.**

Free DP Trading Room (5/2) RECORDING LINK:
Topic: DecisionPoint Trading Room
Start Time: May 2, 2022 09:00 AM
Meeting Recording Link.
Access Passcode: May#the2nd
For best results, copy and paste the access code to avoid typos.
Welcome to DecisionPoint Daily Diamonds, wherein I highlight ten "Diamonds in the Rough" per week. These are selected from the results of my DecisionPoint Scans, which search for stocks that could benefit from the trend and condition of the market. Remember, these are not recommendations to buy or sell, but are the most interesting of the stocks that surfaced in my scans. My objective is to save you the work of the initial, tedious culling process, but you need to apply your own analysis to see if these stocks pique your interest as well. There are no guaranteed winners here!
"Predefined Scans Triggered" are taken from StockCharts.com using the "Symbol Summary" option instead of a "SharpChart" on the workbench.
Jinkosolar Holding Co. Ltd. (JKS)
EARNINGS: 7/28/2022 (BMO)
JinkoSolar Holding Co., Ltd. manufactures innovative solar modules. It distributes solar products and sells its solutions and services to a diversified international utility, commercial and residential customer. The company was founded by Xiande Li, Kangping Chen, and Xianhua Li on August 3, 2007 and is headquartered in Shangrao, China.
Predefined Scans Triggered: Elder Bar Turned Blue and P&F High Pole.
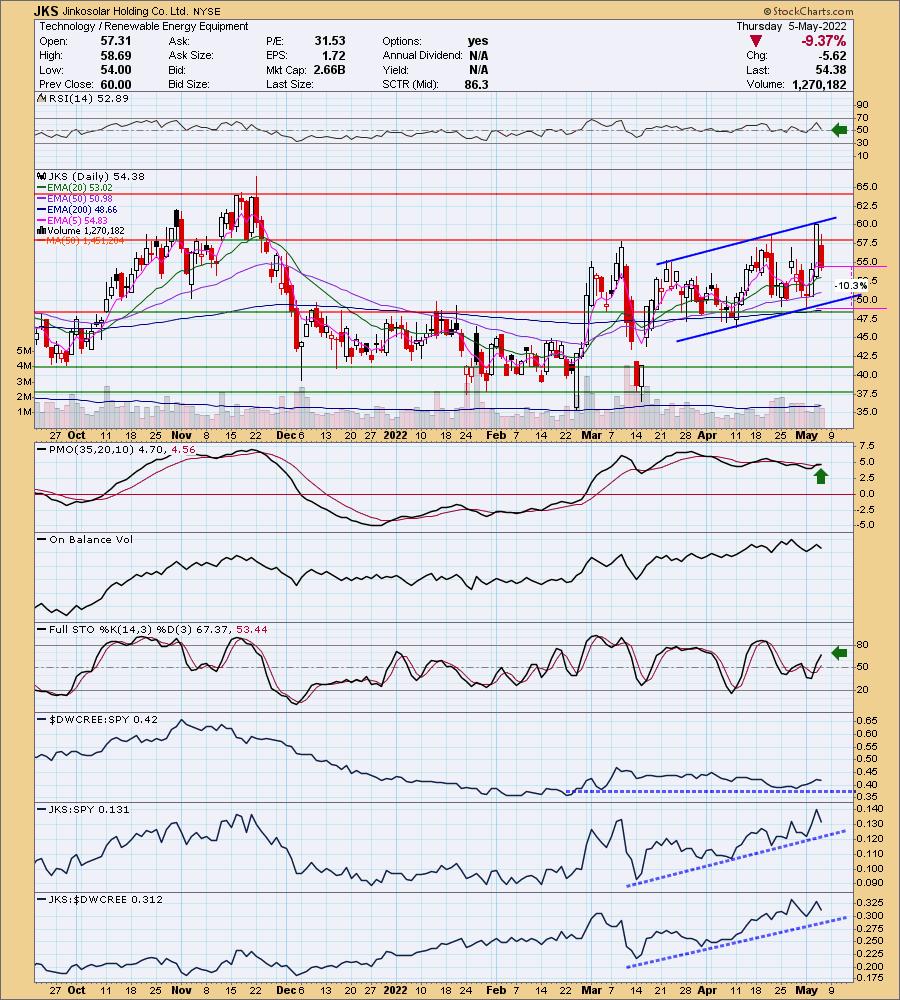
JKS is up +2.78% in after hours trading so it is taking back some of the losses from today. Clearly when you look at the price chart, you'll need to be prepared for a ton of volatility. This is why the stop level is over 10%. You'll need a healthy risk appetite to jump on this one, but if you want a solar stock, this is the one I like best. Currently price is in an established rising trend channel. It dropped today on what turned out to be a false breakout. The indicators are fairly bullish. The RSI is still positive despite an over 9% decline today. The PMO was damaged, but remains on a crossover BUY signal. Stochastics are rising in positive territory. The group has been performing in line with the SPY which is not good. However, JKS is outperforming both benchmarks.
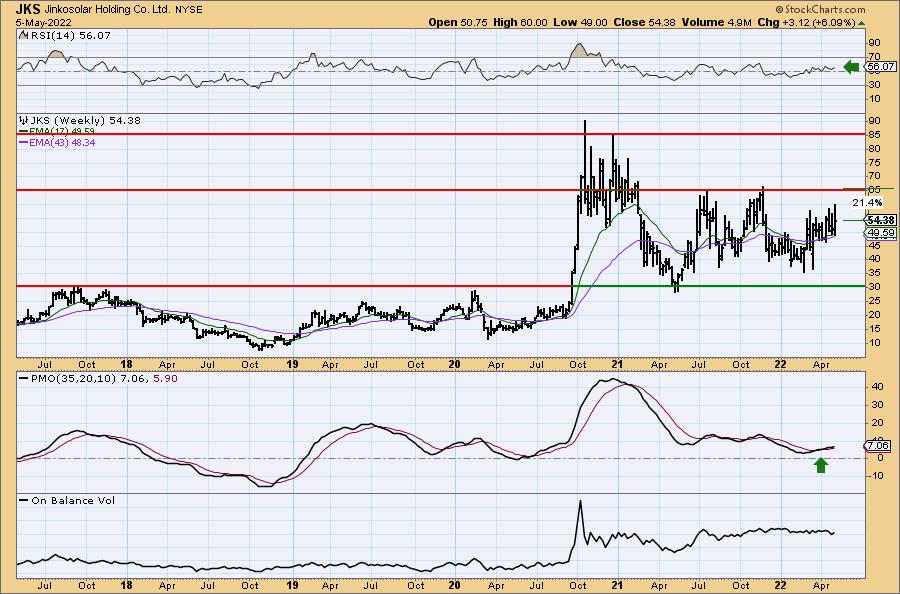
The weekly chart is very bullish. The RSI is rising above net neutral (50). The PMO is rising on a crossover BUY signal. Upside potential would be at least 21% if it reaches last year's tops.
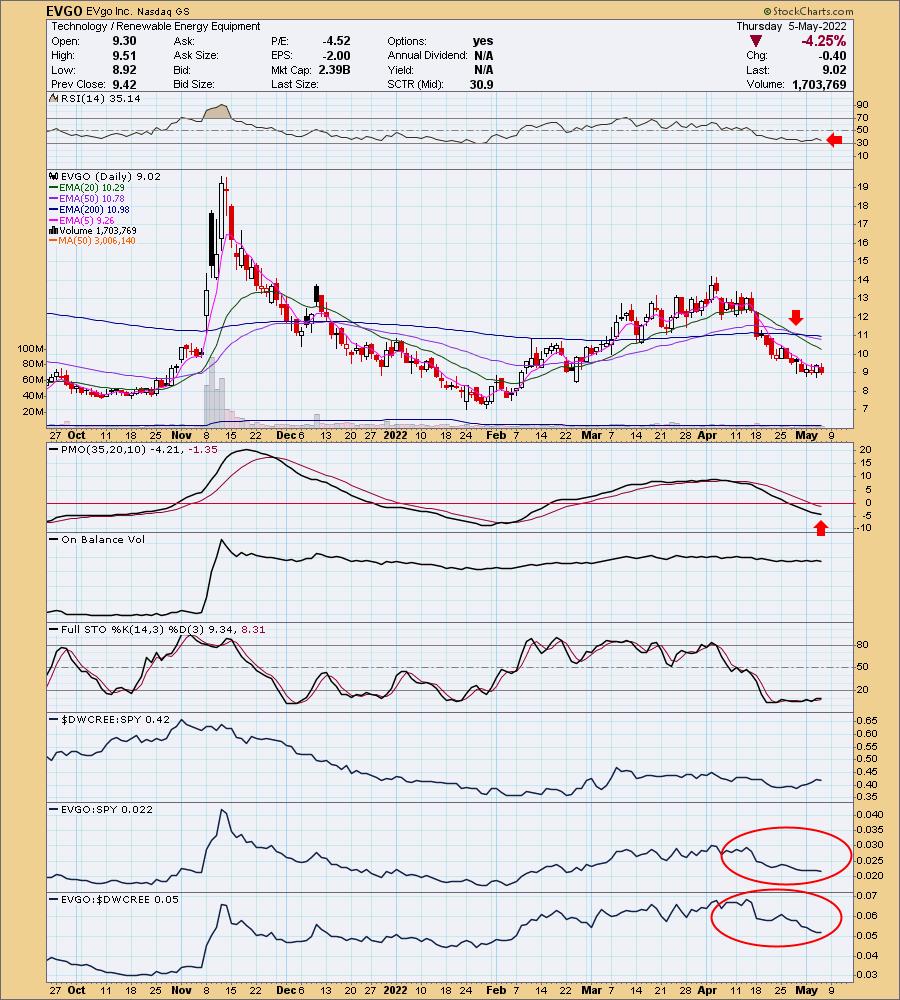
Here's a comparison chart of EVGO. While it does look like it is bottoming, the indicators are far more negative. The key moving averages are aligned bearishly, showing a Death Cross of 50/200-EMAs and "Dark Cross" of the 20/50-day EMAs. Relative strength is terrible and the PMO is still falling on a crossover SELL signal. Stochastics are oscillating well below 20. Much different look, am I right?
Simplify Interest Rate Hedge ETF (PFIX)
EARNINGS: N/A
PFIX is actively managed to provide a hedge against a sharp increase in long-term interest rates. The fund holds OTC interest rate options, US Treasurys, and US Treasury Inflation-Protected Securities (TIPS).
Predefined Scans Triggered: Elder Bar Turned Green, New CCI Buy Signals, P&F Bullish Catapult, Moved Above Upper Bollinger Band, Moved Above Upper Price Channel P&F Ascending Triple Top Breakout and P&F Double Top Breakout.
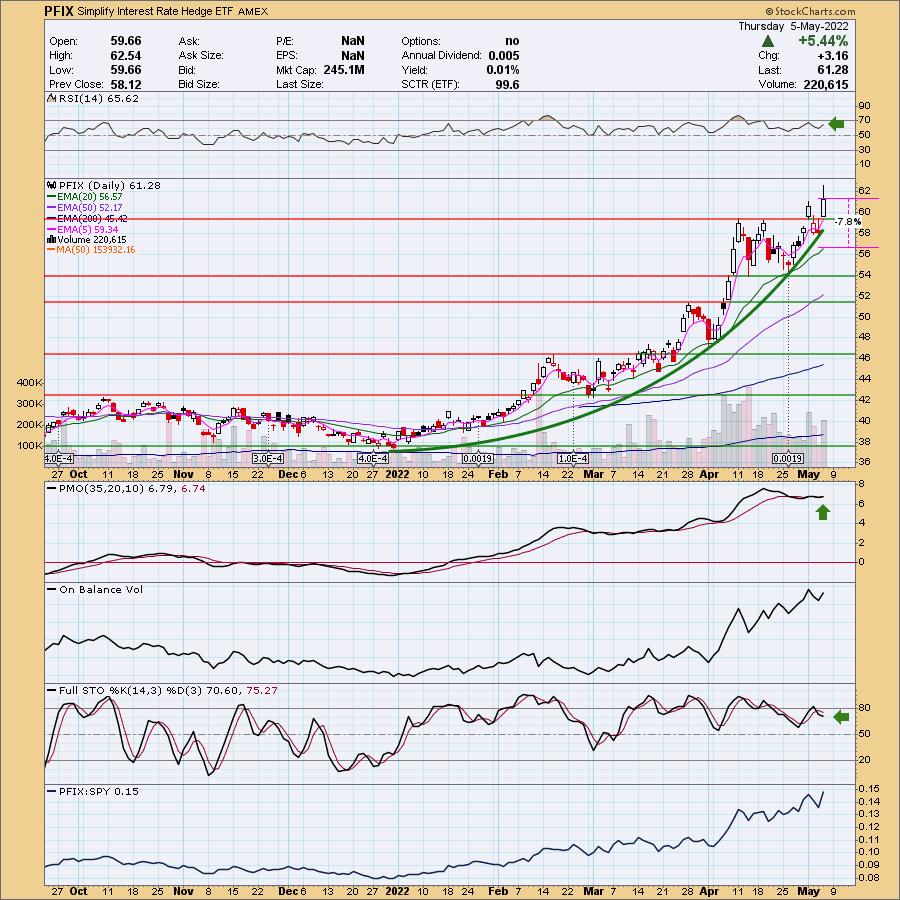
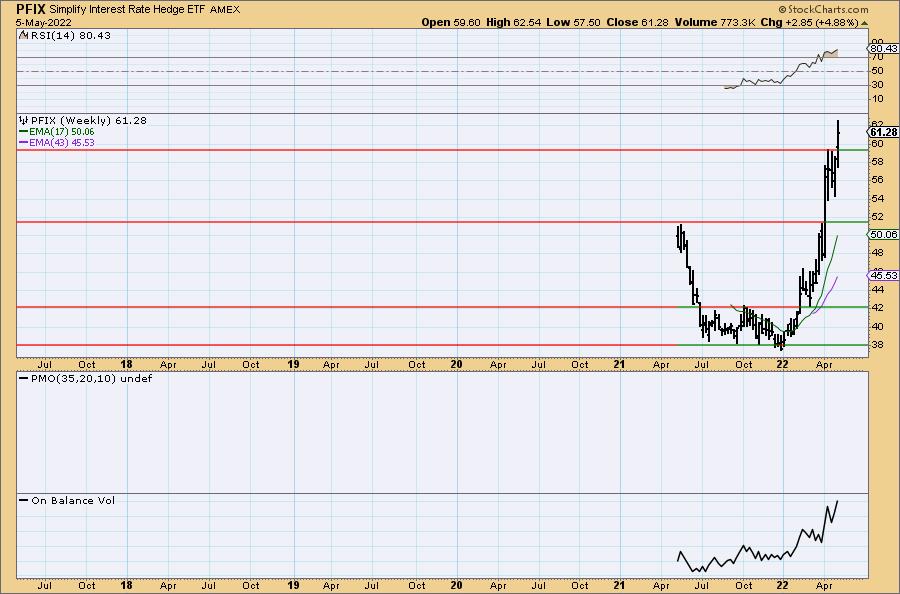
PFIX is up +1.01% in after hours trading. I'm kicking myself that I didn't get into this one months ago. Price spent much of April consolidating sideways, but we are now seeing a breakout. It has been in a parabolic rise and we expect it to continue based on the rising rate environment. The RSI is positive and not overbought. The PMO triggered a crossover BUY signal today. Stochastic aren't great, but they continue to oscillate in positive territory above 50. The stop is set at 7.8% or around the 20-day EMA.
The weekly chart doesn't have much data, but we do see that volume is coming in based on the rising OBV and the RSI, while overbought, is still rising. Upside target could be set at 18% or $72.31.
ProShares UltraPro Short QQQ (SQQQ)
EARNINGS: N/A
SQQQ provides (-3x) inverse exposure to a modified market-cap-weighted index of 100 of the largest non-financial firms listed on the NASDAQ.
Predefined Scans Triggered: Elder Bar Turned Green and Moved Above Ichimoku Cloud.
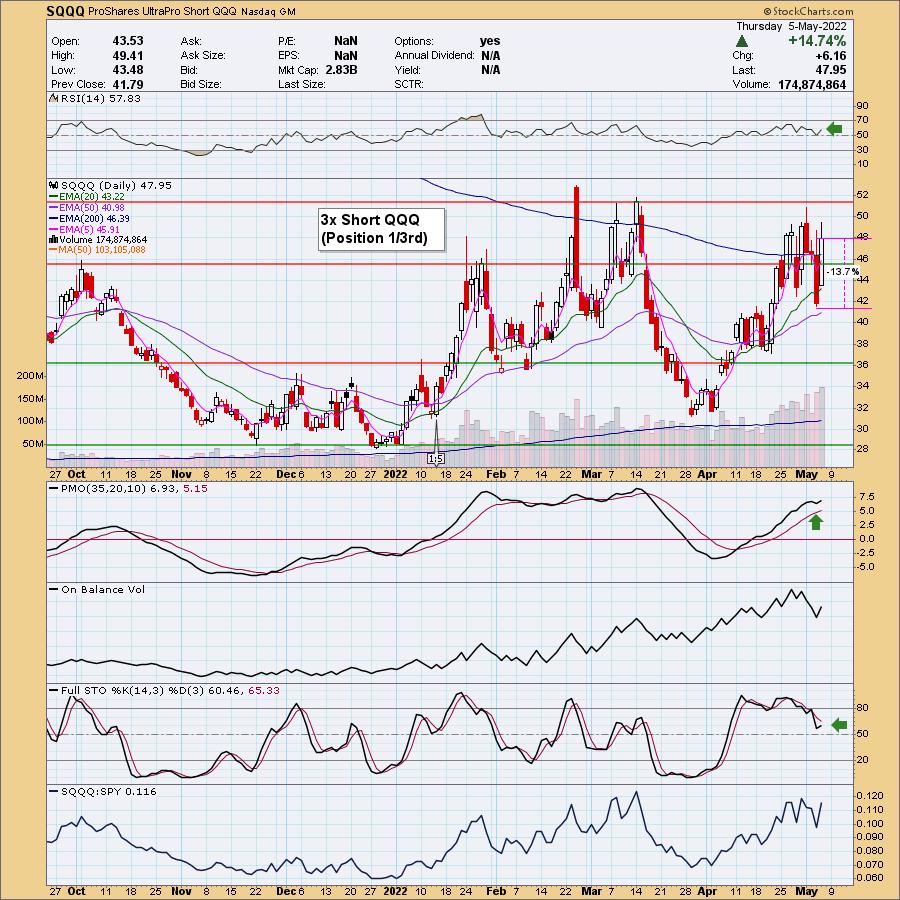
SQQQ is down -0.08% in after hours trading. I'm very bearish on the Nasdaq, but I always hesitate on these juiced ETFs. As noted in the opening, I've listed the stop deep at the 50-day EMA, but in actuality, it may require more risk tolerance than that. The RSI is positive and rising. The PMO just bottomed above its signal line which is especially bullish. Stochastics are in positive territory above 50 and are rising as of today's giant bounce.
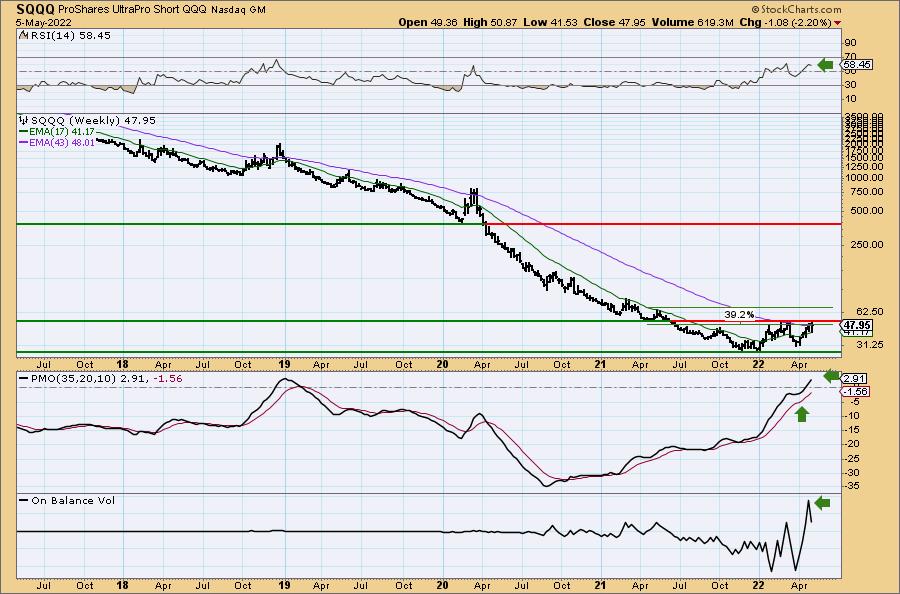
I had to move to a log scale chart in order to see price action. Remember on log scale charts, support and resistance levels are fine, but drawing trendlines isn't wise as they don't always translate to an arithmetic scale. We see that price is up against resistance. However, given the strongly rising and positive weekly PMO, I suspect a breakout is going to happen. The weekly RSI is also positive and volume is clearly coming in. The upside target is at least 39%, but I could see it moving much higher than that if the bear market continues.
Upwork Inc. (UPWK) - SHORT
EARNINGS: 7/27/2022 (AMC)
Upwork, Inc. operates an online marketplace that enables businesses to find, hire, and pay freelancers for short-term and longer-term projects. Its marketplace offerings include Upwork Basic, Upwork Plus, Upwork Business, Upwork Enterprise, and Upwork Payroll. The company was founded by Odysseas Tsatalos and Efstratios Karamanlakis in December 2013 and is headquartered in San Francisco, CA.
Predefined Scans Triggered: Moved Below Ichimoku Cloud and Elder Bar Turned Red.
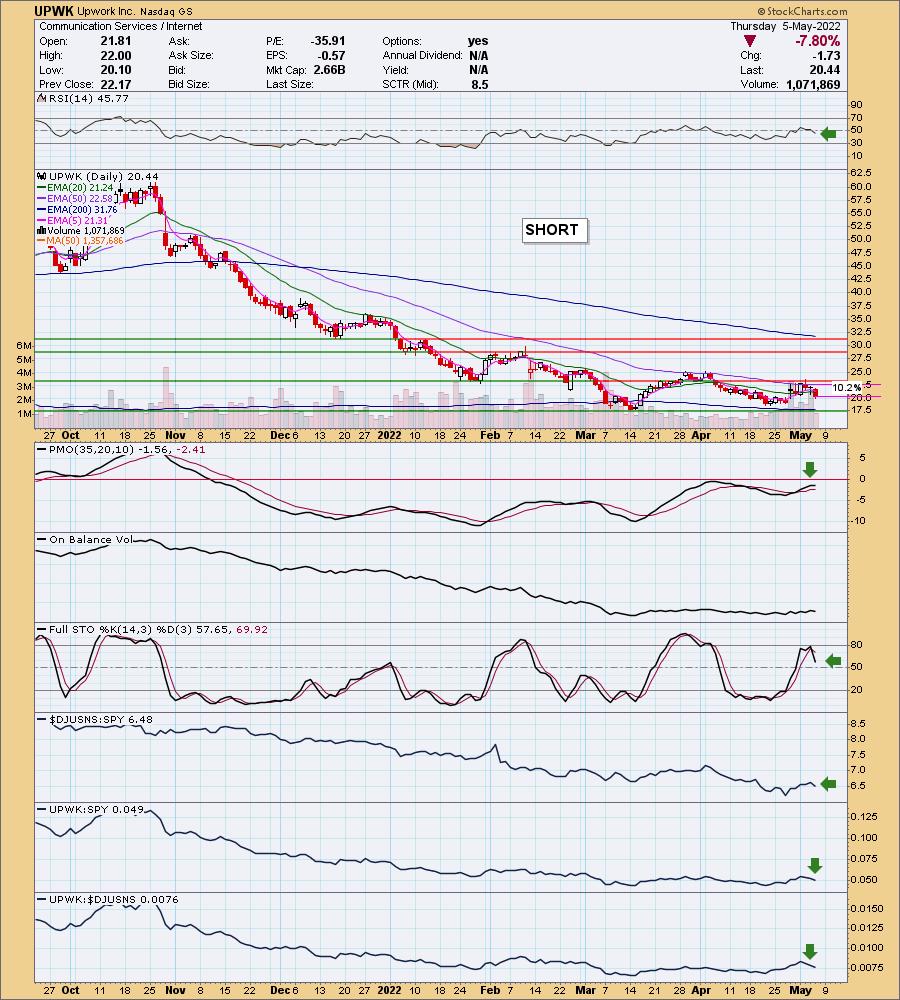
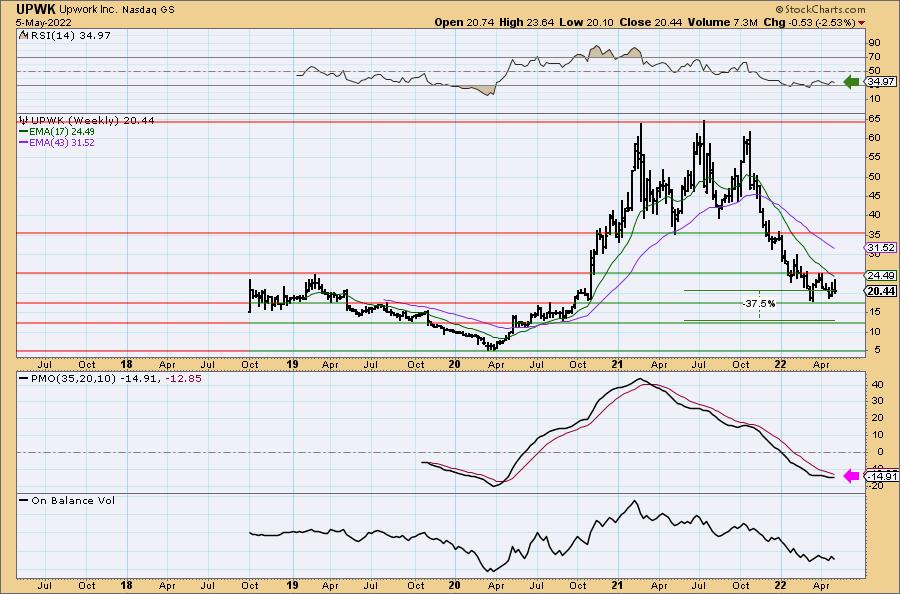
UPWK is down -1.66% in after hours trading. Admittedly this request came in earlier in the week while the PMO was rising. Since then the chart has taken a turn for the worse. The RSI is falling and is now in negative territory. The PMO has topped beneath the zero line and Stochastics are falling and should reach negative territory soon. It is underperforming the SPY and its group which is obviously not good right now. The "upside" stop is over 10% so again a risk appetite will need to be high.
The weekly PMO is improving right now which isn't good for a short position, but the RSI is negative and moving sideways. Downside target could be about 37.5% or more.
Don't forget, on Thursdays I look at reader-requested symbols, click HERE to shoot me an email. I read every email I receive and try to answer them all!
Current Market Outlook:
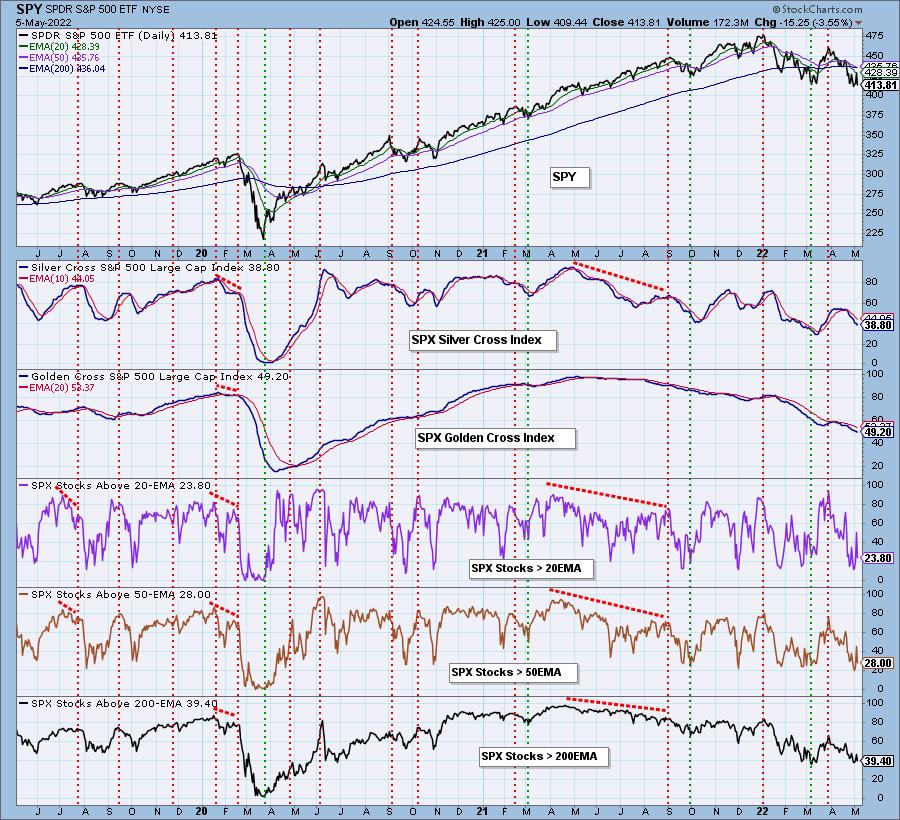
Market Environment: It is important to consider the odds for success by assessing the market tides. The following chart uses different methodologies for objectively showing the depth and trend of participation for intermediate- and long-term time frames.
- The Silver Cross Index (SCI) shows the percentage of SPX stocks on IT Trend Model BUY signals (20-EMA > 50-EMA)
- The Golden Cross Index (GCI) shows the percentage of SPX stocks on LT Trend Model BUY signals (50-EMA > 200-EMA)
Don't forget that as a "Diamonds" member, you have access to our GCI/SCI curated ChartList on DecisionPoint.com. You'll find it under "Members Only" links on the left side on the Blogs and Links Page.
Here is the current chart:
Full Disclosure: I'm 25% invested and 75% is in 'cash', meaning in money markets and readily available to trade with. Only 10% is on the "buy side".
I'm required to disclose if I currently own a stock and/or may buy it within the next 72 hours.
"Technical Analysis is a windsock, not a crystal ball." - Carl Swenlin
(c) Copyright 2022 DecisionPoint.com
Watch the latest episode of DecisionPoint with Carl & Erin Swenlin on Mondays 7:00p EST or on the DecisionPoint playlist on the StockCharts TV YouTube channel here!
NOTE: The stocks reported herein are from mechanical trading model scans that are based upon moving average relationships, momentum and volume. DecisionPoint analysis is then applied to get five selections from the scans. The selections given should prompt readers to do a chart review using their own analysis process. This letter is not a call for a specific action to buy, sell or short any of the stocks provided. There are NO sure things or guaranteed returns on the daily selection of "Diamonds in the Rough."
Helpful DecisionPoint Links:
DecisionPoint Shared ChartList and DecisionPoint Chart Gallery
Price Momentum Oscillator (PMO)
Swenlin Trading Oscillators (STO-B and STO-V)
For more links, go to DecisionPoint.com