
I shouldn't be surprised, but I am. There were no reader requests today. Not one. Consequently I had to march on and find some interesting "Diamonds in the Rough" for you. I think I came up with some good ones today centering on the run up in commodities.
Overall commodities remain in an uptrend, but what makes them intriguing is that they had a period of consolidation and are beginning to gain traction again.
Yesterday I went all in on Home Builders so of course they had a huge rebound today. I doubt many of you got caught as it was clear on the open they were gaining strength on the day. I still believe they are going to be good shorts as most did not recapture prior support levels. Mortgage rates are through the roof so I expect this group will continue to struggle. I suppose I should've picked Banks since that group was also prominent in my Diamond Dog Scan yesterday.
Don't forget to sign up for tomorrow's Diamond Mine trading room! You can do so in the section below or right HERE.
Good Luck & Good Trading,
Erin
Today's "Diamonds in the Rough": DBA, GSG, UGA and WEAT.

RECORDING LINK (5/6/2022):
Topic: DecisionPoint Diamond Mine (5/6/2022) LIVE Trading Room
Start Time: May 6, 2022 09:00 AM
Meeting Recording Link.
Access Passcode: @Maythe5th
REGISTRATION FOR Friday 5/13 Diamond Mine:
When: May 13, 2022 09:00 AM Pacific Time (US and Canada)
Topic: DecisionPoint Diamond Mine (5/13/2022) LIVE Trading Room
Register in advance for this webinar HERE.
** Save the registration confirmation email with login instructions in case Zoom doesn't notify you in time.**

Free DP Trading Room (5/9) RECORDING LINK:
Topic: DecisionPoint Trading Room
Start Time: May 9, 2022 08:59 AM
Meeting Recording Link.
Access Passcode: May#on9th
For best results, copy and paste the access code to avoid typos.
Welcome to DecisionPoint Daily Diamonds, wherein I highlight ten "Diamonds in the Rough" per week. These are selected from the results of my DecisionPoint Scans, which search for stocks that could benefit from the trend and condition of the market. Remember, these are not recommendations to buy or sell, but are the most interesting of the stocks that surfaced in my scans. My objective is to save you the work of the initial, tedious culling process, but you need to apply your own analysis to see if these stocks pique your interest as well. There are no guaranteed winners here!
"Predefined Scans Triggered" are taken from StockCharts.com using the "Symbol Summary" option instead of a "SharpChart" on the workbench.
Invesco DB Agriculture Fund (DBA)
EARNINGS: N/A
DBA tracks an index of 10 agricultural commodity futures contracts. It selects contracts based on the shape of the futures curve to minimize contango.
Predefined Scans Triggered: Elder Bar Turned Green, P&F Double Top Breakout and P&F Bearish Signal Reversal.
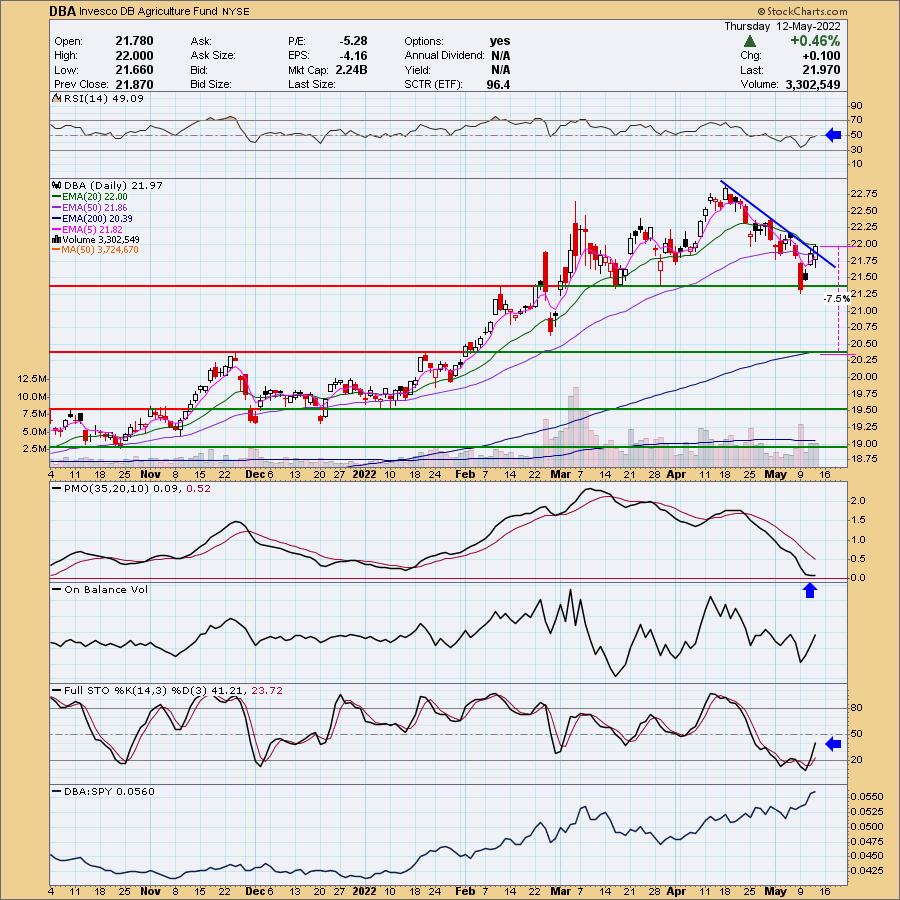
DBA is up +0.14% in after hours trading. I covered DBA a number of times: February 18th 2020 (position closed), August 6th 2020 (position still open and up +55.4%) and January 19th 2022 (position open and up +8.22%). This one is a slow mover, but is great for those who don't have a huge appetite for risk. Today we got a breakout from the declining trend. Price hasn't yet overcome resistance at the 20-day EMA, but expect it to. The RSI is almost in positive territory. The PMO is turning back up and Stochastics are rising strongly. You can set a much smaller stop level if you wish, but this one is set below the 200-day EMA and the November top.
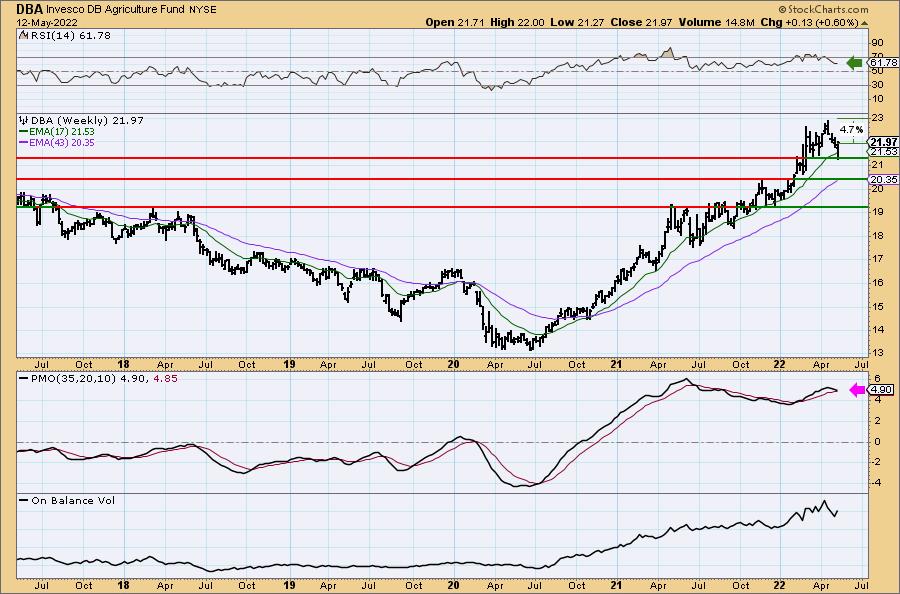
Right now price is bouncing off support. The weekly RSI is positive. I don't like the PMO which is going in for a crossover SELL signal. Upside potential has to be determined on the monthly chart.
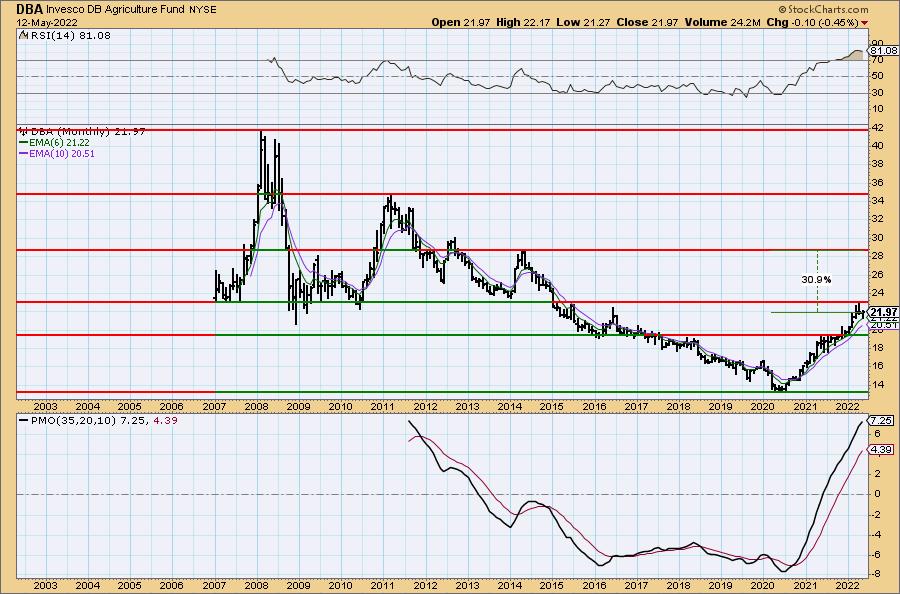
I am looking for a test of the 2014 top.
iShares S&P GSCI Commodity-Indexed Trust (GSG)
EARNINGS: N/A
GSG uses index futures contracts to gain exposure to a production-weighted index of front-month commodities futures contracts. Click HERE for more information.
Predefined Scans Triggered: Elder Bar Turned Green.
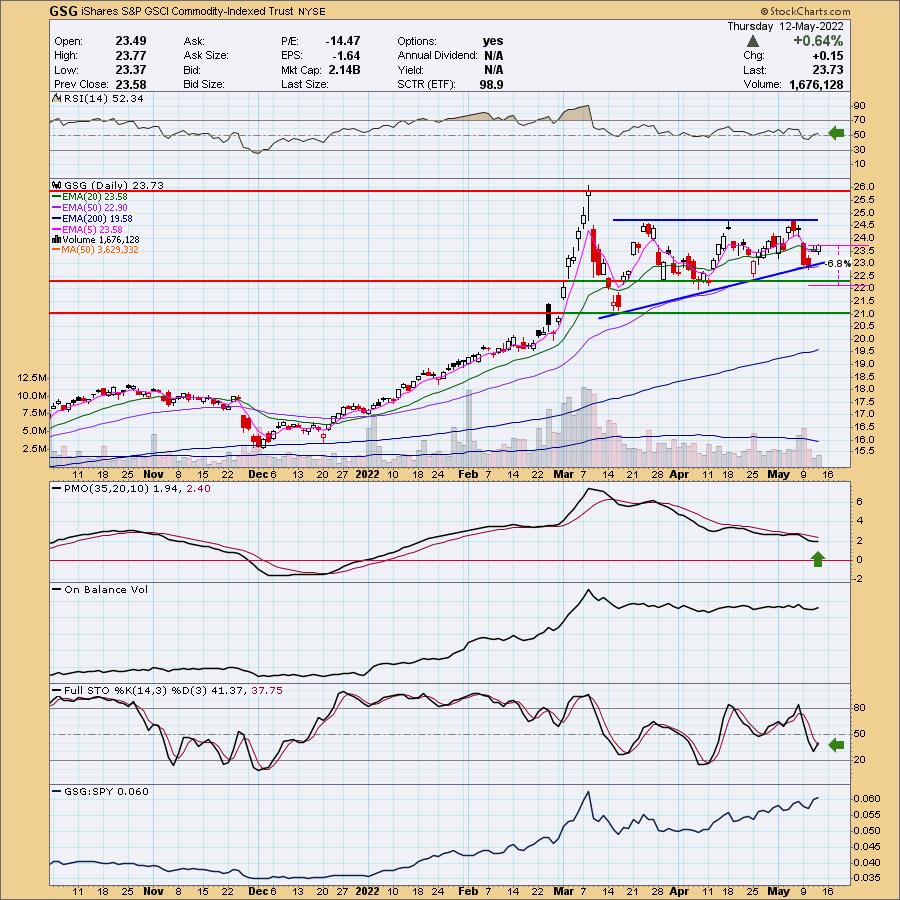
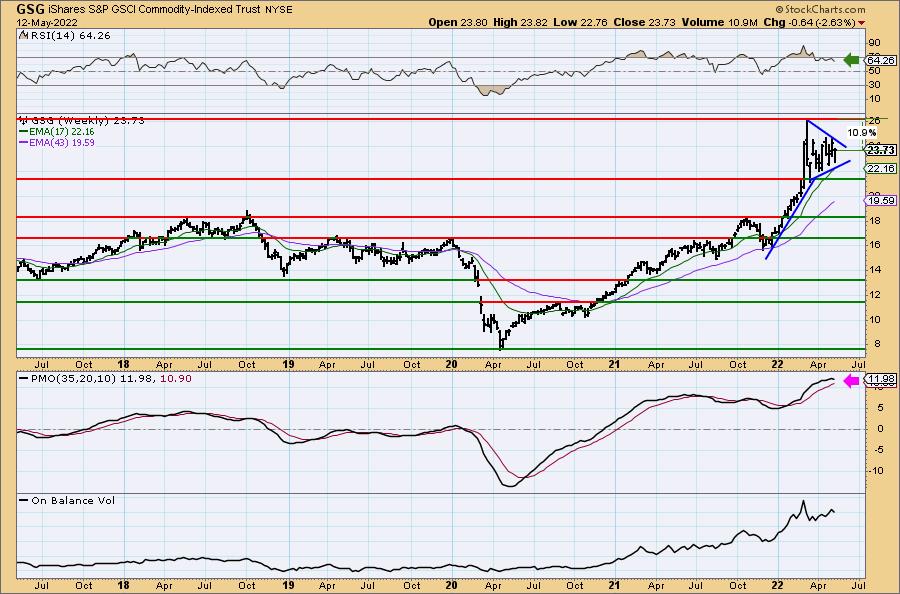
GSG is down -0.42% in after hours trading. This looks almost identical to the USO chart (Crude Oil) which is why I like it. We have a bullish ascending triangle. The RSI just hit positive territory. Price closed above the 20-day EMA and appears ready to test resistance again. The PMO is turning up. Stochastics have reversed quickly and are rising again. I don't see an end to inflation anytime soon and supply for commodities is being disrupted by the war in Ukraine. The stop can be set below support at $22.25. If it falls to that level it will have broken the rising trend and dropped below support at the late April low.
I see a pennant on a flagpole on the weekly chart that implies a breakout to the upside. The weekly RSI has moved out of overbought territory. The weekly PMO doesn't look healthy as it is topping, but with a breakout that will correct itself quickly. Upside potential is almost 11% if it reaches the all-time high for the fund.
United States Gasoline Fund, LP (UGA)
EARNINGS: N/A
UGA holds near-month NYMEX futures contracts on reformulated gasoline blendstock for oxygen blending (RBOB) gasoline. For more information click HERE.
Predefined Scans Triggered: New CCI Buy Signals, Elder Bar Turned Green, New CCI Buy Signals, New 52-week Highs and Moved Above Upper Price Channel.
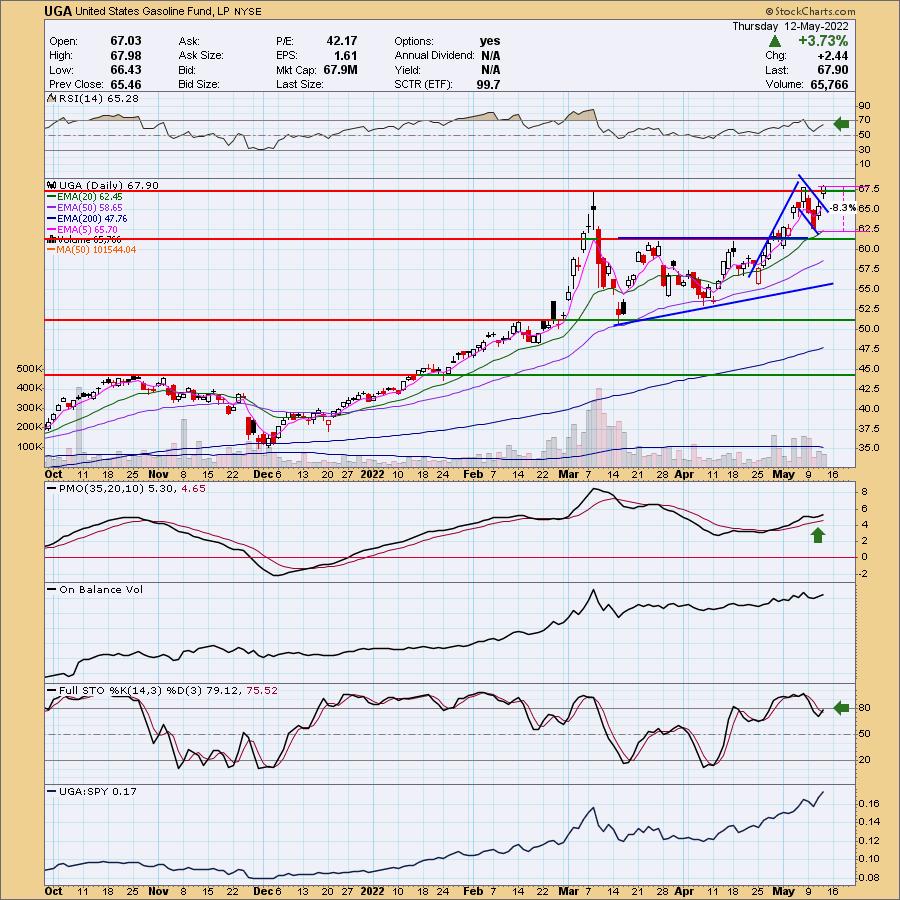
UGA is down -0.03% in after hours trading. Price is breaking out again and today closed at a new 52-week high. The RSI is positive and the PMO has bottomed above the signal line. Stochastics have turned back up. After pulling back in March, price has been consolidating sideways. A bullish ascending triangle had formed and we got the expected breakout. Now we have a bull flag leading into today's gap up. I will say that it barely makes my average daily volume requirement of 100,000 or more, but volume has been flying in since the war in Ukraine took off. The stop is set below the 20-day EMA and bottom of the flag.
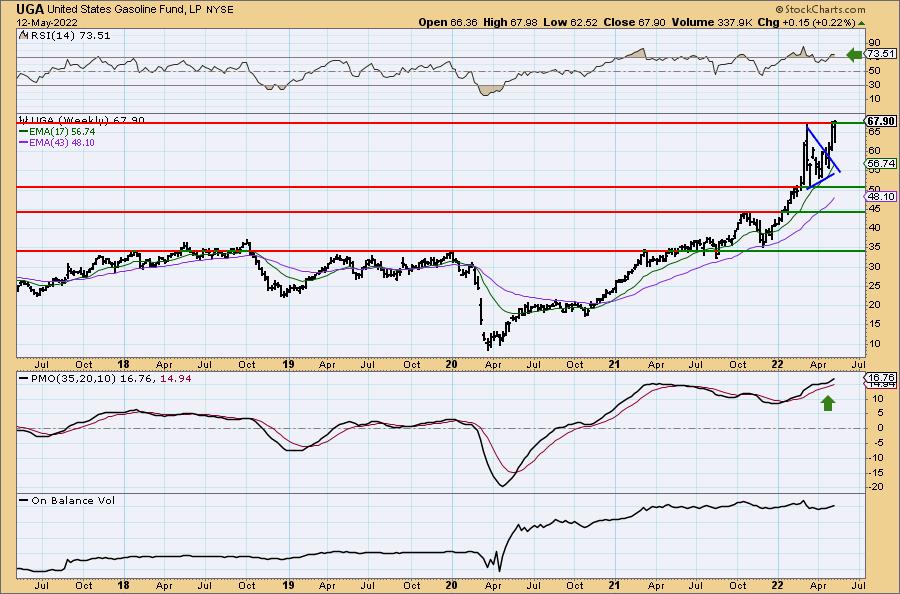
We have another flagpole with a pennant and price has broken out of it as expected to the upside. The weekly RSI is positive and the weekly PMO has bottomed above the signal line. Since it is at 52-week highs, consider an upside target of 16% at $78.76.
Teucrium Wheat Fund (WEAT)
EARNINGS: N/A
WEAT tracks an index of wheat futures contracts. It reflects the performance of wheat by holding Chicago Board of Trade wheat futures contracts with three different expiration dates. Click HERE for more info.
Predefined Scans Triggered: Stocks in a New Uptrend (ADX) and Moved Above Upper Price Channel.
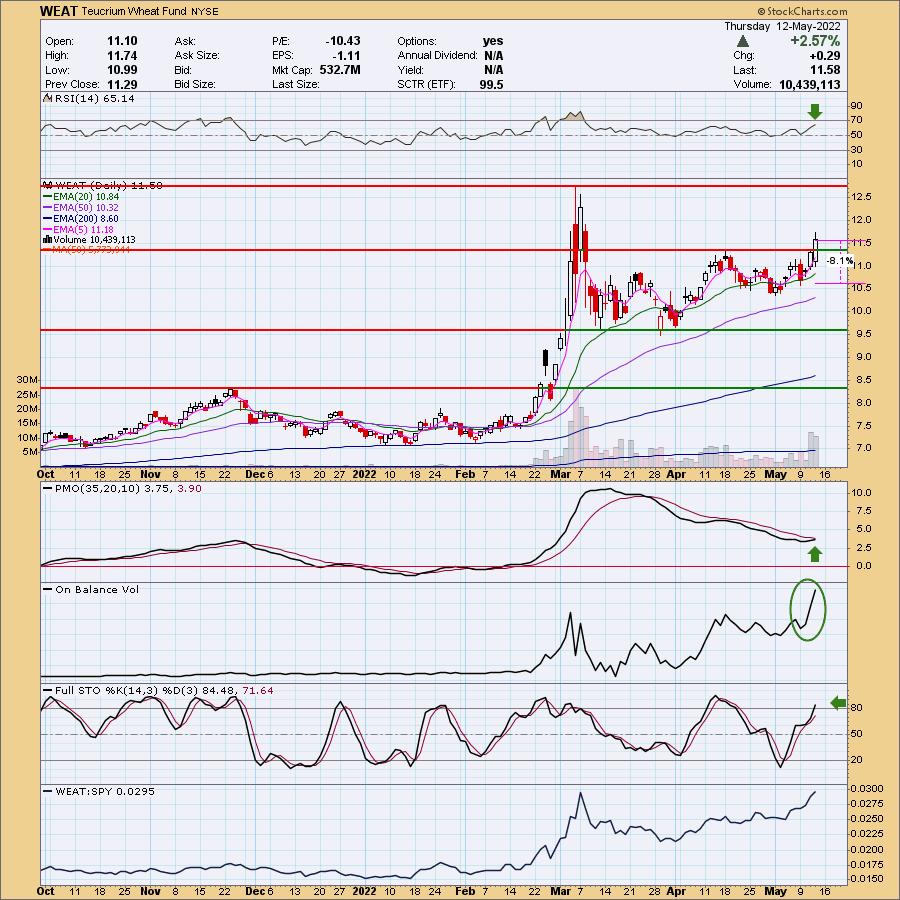
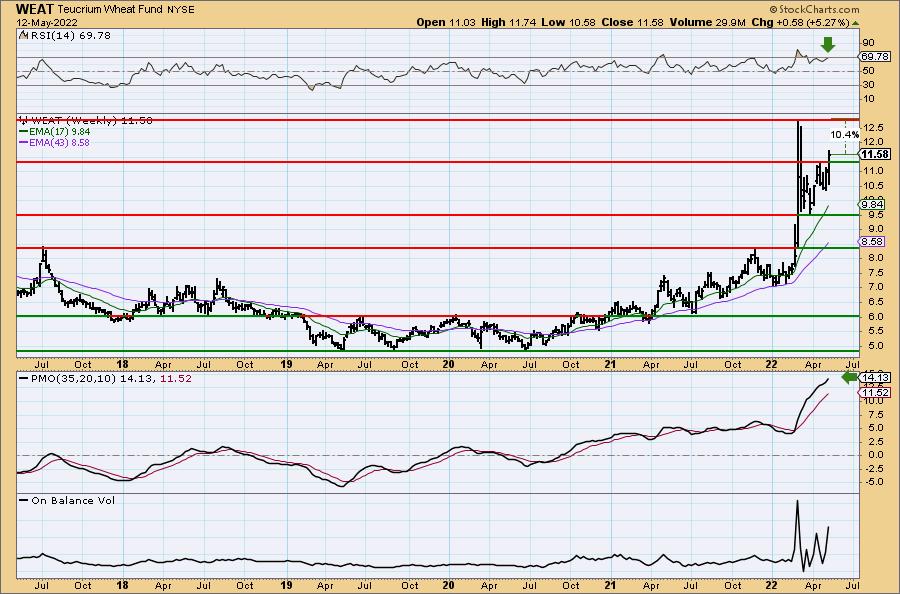
WEAT is up +0.60% in after hours trading. I love today's breakout. As I mentioned in the opening, these commodity stocks had parabolic rises and then crashed as most parabolic formations do. It then spent almost two months consolidating. Now we have a breakout combined with a PMO that is about to trigger a crossover BUY signal. Volume has been pouring in. The RSI is positive, rising and not overbought. Stochastics have now reached above 80. The stop is set between the 20-day and 50-day EMAs.
The weekly RSI is rising, but it is getting a bit overbought. The weekly PMO is soaring skyward. The war has certainly disrupted the normal volatility of this ETF. Upside potential is at least 10%, but I'm looking for more than that.
Don't forget, on Thursdays I look at reader-requested symbols, click HERE to shoot me an email. I read every email I receive and try to answer them all!
Current Market Outlook:
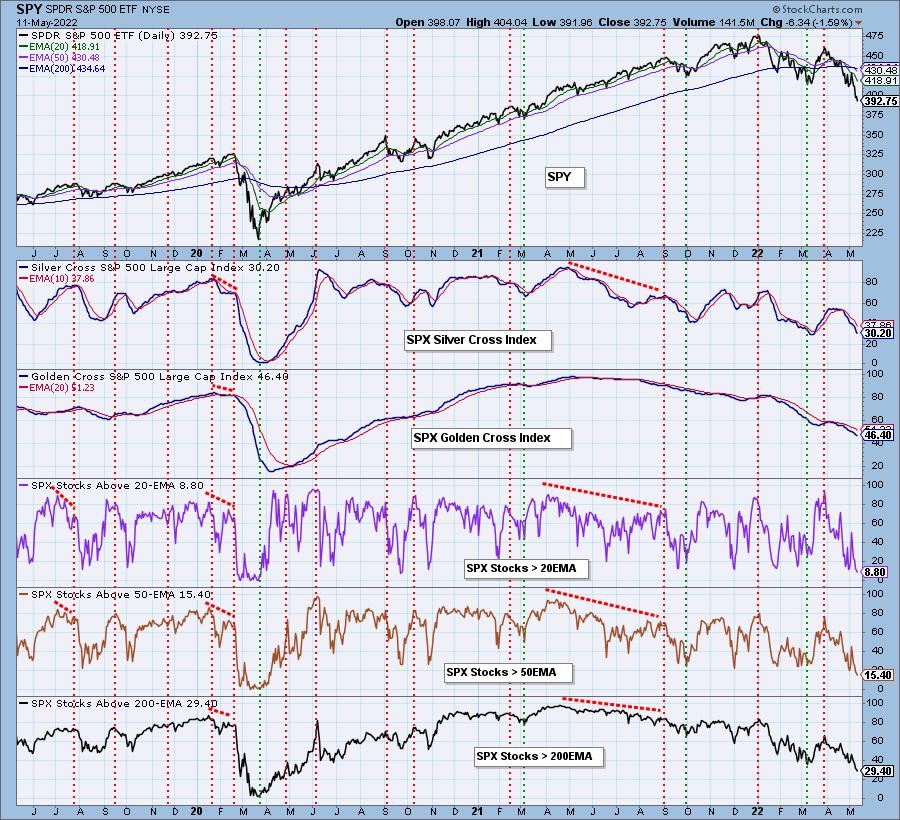
Market Environment: It is important to consider the odds for success by assessing the market tides. The following chart uses different methodologies for objectively showing the depth and trend of participation for intermediate- and long-term time frames.
- The Silver Cross Index (SCI) shows the percentage of SPX stocks on IT Trend Model BUY signals (20-EMA > 50-EMA)
- The Golden Cross Index (GCI) shows the percentage of SPX stocks on LT Trend Model BUY signals (50-EMA > 200-EMA)
Don't forget that as a "Diamonds" member, you have access to our GCI/SCI curated ChartList on DecisionPoint.com. You'll find it under "Members Only" links on the left side on the Blogs and Links Page.
Here is the current chart:
What I look for in a short position:
I consider a stock a shorting opportunity if strong support has been broken in the short term and price is far away from the next support level on a weekly chart. I want bearish chart patterns if possible. I want to see volume flying out of the stock/ETF.
Momentum must be negative (PMO pointing downward) and on a SELL signal or close to triggering one. RSI and Stochastics should be below net neutral (50). Relative strength should be equal (if SPY is in a bear market configuration) or worse than the benchmark SPY.
Remember that on the daily chart I'm giving you a "stop" level that is higher than today's current price. We are shorting, so we need to determine how far we will let it rally before covering the short.
On the weekly chart the "targets" are downside targets, not upside targets.
Full Disclosure: I'm 20% invested, 15% are bearish positions.
I'm required to disclose if I currently own a stock and/or may buy/short it within the next 72 hours.
"Technical Analysis is a windsock, not a crystal ball." - Carl Swenlin
(c) Copyright 2022 DecisionPoint.com
Watch the latest episode of DecisionPoint with Carl & Erin Swenlin on Mondays 7:00p EST or on the DecisionPoint playlist on the StockCharts TV YouTube channel here!
NOTE: The stocks reported herein are from mechanical trading model scans that are based upon moving average relationships, momentum and volume. DecisionPoint analysis is then applied to get five selections from the scans. The selections given should prompt readers to do a chart review using their own analysis process. This letter is not a call for a specific action to buy, sell or short any of the stocks provided. There are NO sure things or guaranteed returns on the daily selection of "Diamonds in the Rough."
Helpful DecisionPoint Links:
DecisionPoint Shared ChartList and DecisionPoint Chart Gallery
Price Momentum Oscillator (PMO)
Swenlin Trading Oscillators (STO-B and STO-V)
For more links, go to DecisionPoint.com