
I and many other analysts have been discussing "relative strength". The primary measurement we use is "price relative". Basically we take a ratio of the stock/ETF and the SPY. We compare price to price. This works great when your benchmark (the SPY in this case) is performing well or in a bull market. While it is in a bear market, the results are skewed. A stock/ETF could be considered "outperforming" even if it is in a decline; it simply is going down slower than the benchmark. That is not helpful.
I've always liked the StockCharts Technical Rank (SCTR), but ultimately decided to abandon it on my daily charts in favor of price relative because I could dissect it between the stock, industry group and SPY. The SCTR is unique in that it is a relative strength tool, but it calculates the internals on the stock or ETF based on various factors (determined by John Murphy) that of course includes price. Once those internals have been calculated, the result is then compared to others in its "universe". Universes are Large-Caps, Mid-Caps, Small-Caps and ETFs. This seems a much better way of determining relative strength right now.
I'm keeping the price relative on the daily chart, but have added the SCTR to the weekly charts. I think you'll agree it gives us even more insight on the stock's performance.
Today I have four picks for you. I presented AbbVie (ABBV) on "The Pitch" this morning, the show aired today at 2p ET on StockChartsTV. Here is the link to the YouTube recording if you don't have the StockChartsTV app.
In addition to ABBV, I have two more picks from the Healthcare sector. The last pick is an ETF (I've gotten requests to include more ETFs). There were a few ETFs on High Yielders, I narrowed it down to two, PEY and HDV. I opted for HDV, but PEY is worth a gander.
Good Luck & Good Trading,
Erin
Today's "Diamonds in the Rough": ABBV, ACHC, AMPH and HDV.
Stocks to Review: AM, DAR, PEY, SNY, TRP and WEC.

RECORDING LINK (5/13/2022):
Topic: DecisionPoint Diamond Mine (5/13/2022) LIVE Trading Room
Start Time: May 13, 2022 09:00 AM
Meeting Recording Link.
Access Passcode: May@0513
REGISTRATION FOR Friday 5/20 Diamond Mine:
When: May 20, 2022 09:00 AM Pacific Time (US and Canada)
Topic: DecisionPoint Diamond Mine (5/20/2022) LIVE Trading Room
Register in advance for this webinar HERE.
** Save the registration confirmation email with login instructions in case Zoom doesn't notify you in time.**

Free DP Trading Room (5/16) RECORDING LINK:
Topic: DecisionPoint Trading Room
Start Time: May 16, 2022 08:59 AM
Meeting Recording Link.
Access Passcode: MondayMay#16
For best results, copy and paste the access code to avoid typos.
Welcome to DecisionPoint Daily Diamonds, wherein I highlight ten "Diamonds in the Rough" per week. These are selected from the results of my DecisionPoint Scans, which search for stocks that could benefit from the trend and condition of the market. Remember, these are not recommendations to buy or sell, but are the most interesting of the stocks that surfaced in my scans. My objective is to save you the work of the initial, tedious culling process, but you need to apply your own analysis to see if these stocks pique your interest as well. There are no guaranteed winners here!
"Predefined Scans Triggered" are taken from StockCharts.com using the "Symbol Summary" option instead of a "SharpChart" on the workbench.
AbbVie Inc. (ABBV)
EARNINGS: 7/29/2022 (BMO)
AbbVie, Inc. is a research-based biopharmaceutical company, which engages in the development and sale of pharmaceutical products. It focuses on treating conditions such as chronic autoimmune diseases in rheumatology, gastroenterology, and dermatology, oncology, including blood cancers, virology, hepatitis C virus (HCV) and human immunodeficiency virus (HIV), neurological disorders, such as Parkinson's, metabolic, comprising thyroid disease and complications associated with cystic fibrosis, pain associated with endometriosis, and other serious health conditions. The company was founded on October 19, 2011 and is headquartered in North Chicago, IL.
Predefined Scans Triggered: Improving Chaikin Money Flow and P&F Low Pole.
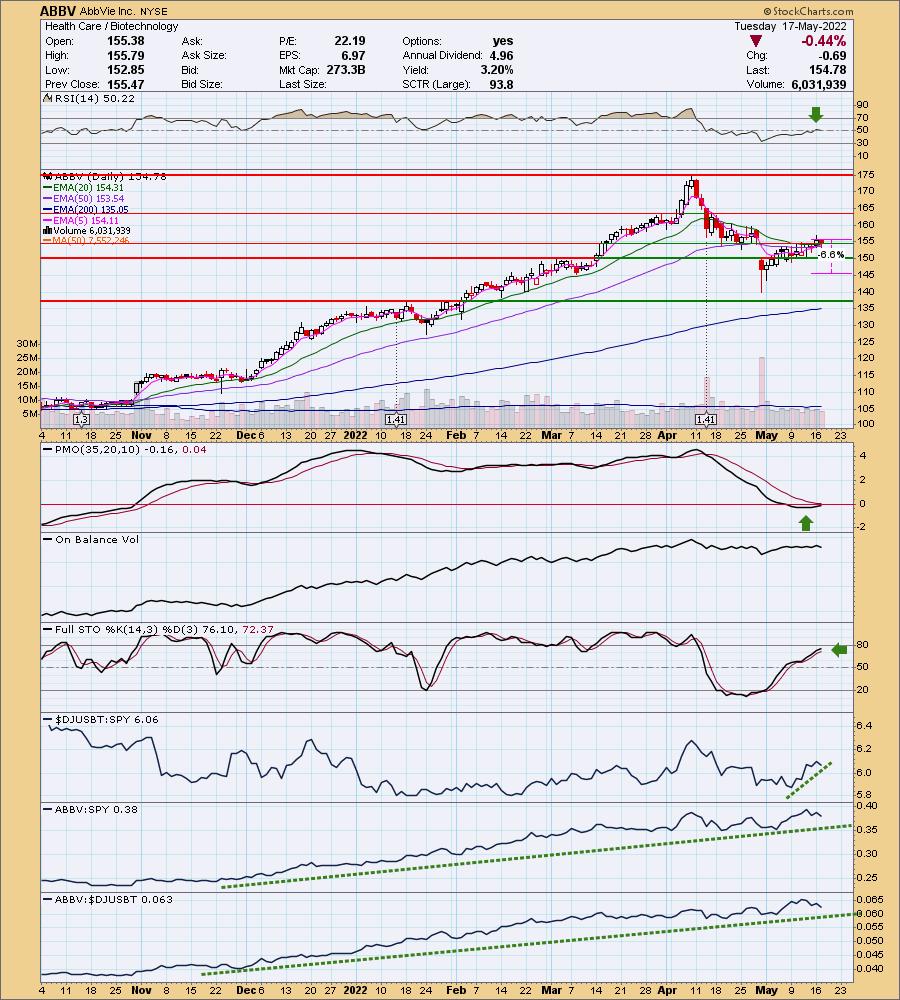
ABBV is up +0.14% in after hours trading. I presented this one for "The Pitch" after it landed in the Diamond PMO Scan yesterday. FYI, it showed up again today. I like that price is now above all key moving averages. It went into a period of distribution, but I see slow accumulation now. The RSI is positive now. The PMO has bottomed and is headed toward a crossover BUY signal above the zero line. The group is beginning to outperform. ABBV has been a solid performer since the end of last year. The stop is set below short-term support. It can be expanded depending on risk tolerance, but this one hasn't been too volatile. Note the 3.2% yield.
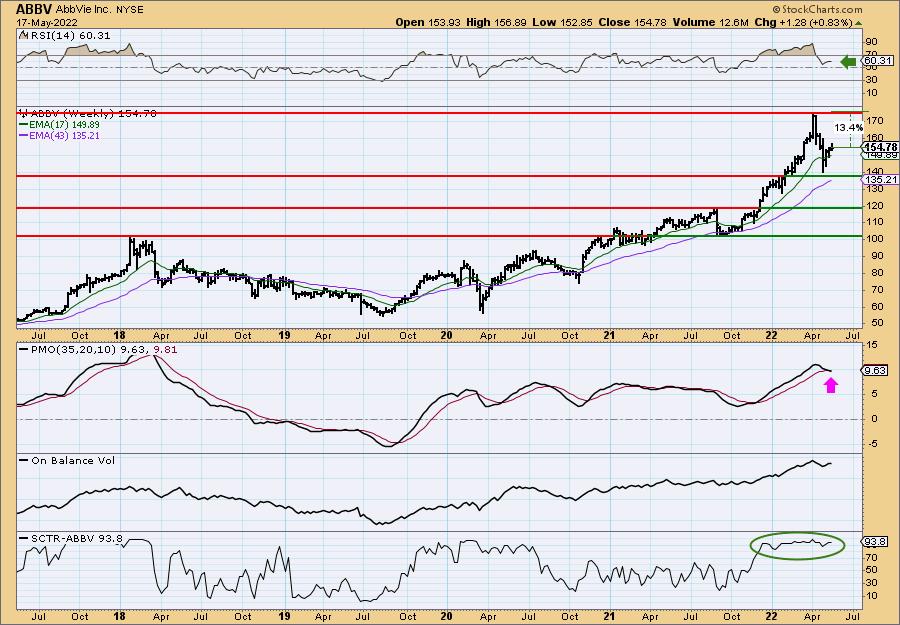
Price relative lines above suggested what we see on the SCTR. ABBV has been a top performer amongst all of its large-cap peers. The RSI is positive. The weekly PMO is a problem for me, but given the vertical drop in April, it's no surprise. It will take some time to turn it around. Upside potential is about 13%.
Acadia Healthcare Company, Inc. (ACHC)
EARNINGS: 8/1/2022 (AMC)
Acadia Healthcare Co., Inc. engages in the provision of behavioral healthcare services. It operates through the following business segments: United States (U.S.) Facilities and the United Kingdom (U.K.) Facilities. The U.S. Facilities segment is classified in the following categories: acute inpatient psychiatric facilities, specialty treatment facilities, residential treatment centers, and outpatient community-based services. The U.K. Facilities segment provides inpatient services through facilities, including mental health hospitals, clinics, care homes, schools, colleges, and children's homes. The company was founded in January 2005 and is headquartered in Franklin, TN.
Predefined Scans Triggered: New CCI Buy Signals and Parabolic SAR Buy Signals.
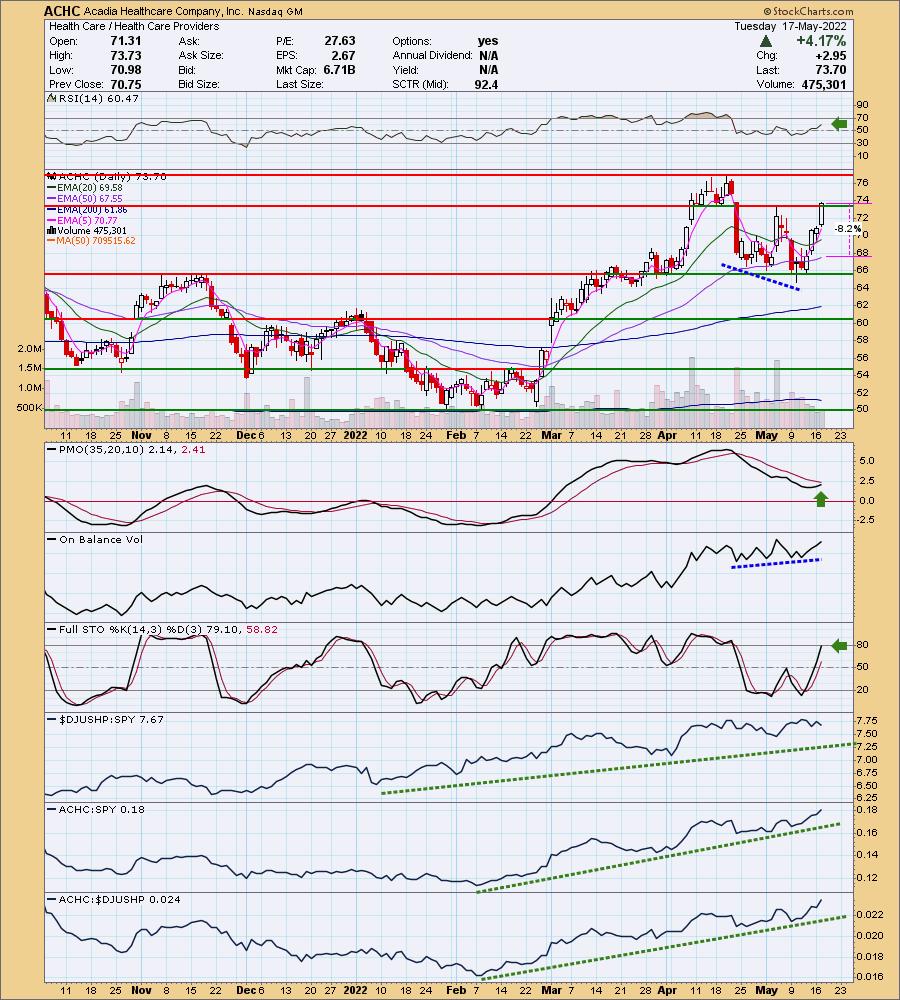
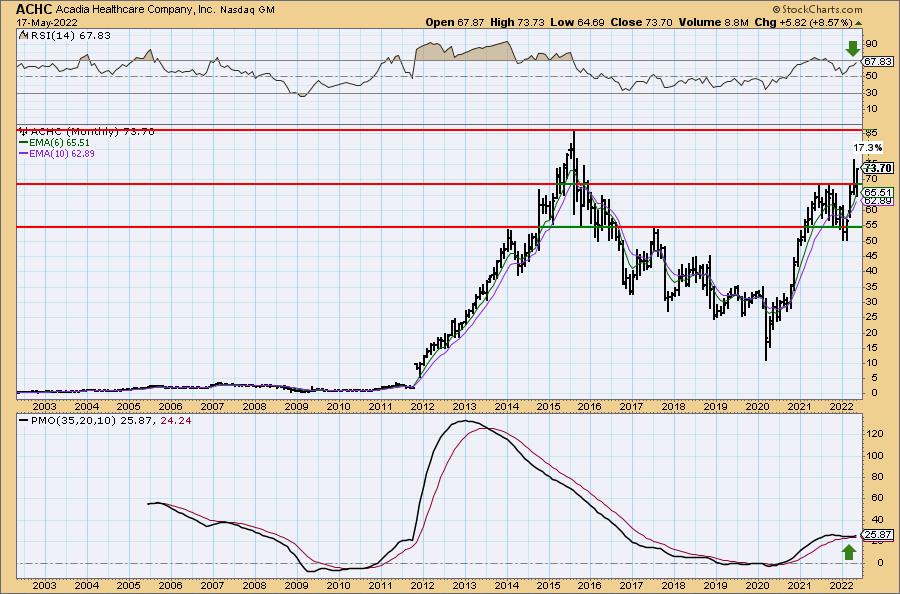
ACHC is unchanged in after hours trading. I have covered ACHC once before on February 3rd 2021. The position is still open and up 35.4%. Today's breakout from this month's high is encouraging. The RSI is positive and rising. The PMO is nearing a crossover BUY signal. We have an OBV positive divergence with price lows. Stochastics are almost above 80. Relative strength overall has been impressive since mid-February. The stop is set at the 50-day EMA.
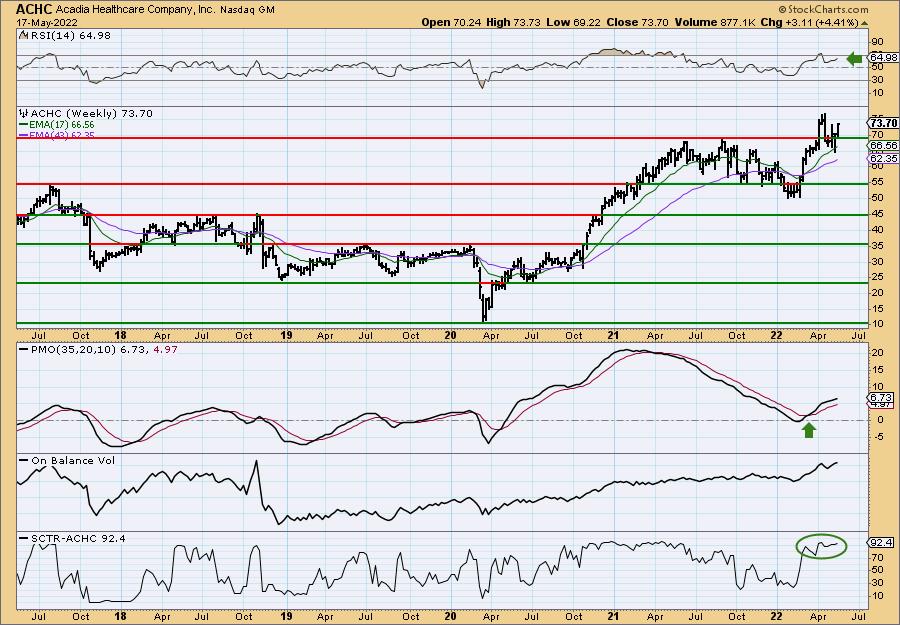
The last breakout above the 2021 highs failed to hold despite the strong weekly indicators. This week, however, price has been trading completely above overhead resistance. The weekly RSI is positive, rising and not overbought. The PMO is on a crossover BUY signal. The SCTR has been in the top 30% most of the year.
I'm including the monthly chart so you can see that if price reaches all-time highs, that would be an over 17% gain.
Amphastar Pharmaceuticals, Inc. (AMPH)
EARNINGS: 8/8/2022 (AMC)
Amphastar Pharmaceuticals, Inc. engages in developing, manufacturing, marketing, and selling technically challenging generic and proprietary injectable, inhalation, and intranasal products, and insulin active pharmaceutical ingredient. It operates through Finished Pharmaceutical Products and Active Pharmaceutical Ingredients Products segments. The Finished Pharmaceutical Products segment manufactures, markets, and distributes Primatene Mist, enoxaparin, naloxone, phytonadione, lidocaine, and other critical and non-critical care drugs. The Active Pharmaceutical Ingredients Products segment offers RHI API and porcine insulin API for external customers and internal product development. The company was founded by Zi-Ping Luo and Yong Feng Zhang on February 29, 1996 and is headquartered in Rancho Cucamonga, CA.
Predefined Scans Triggered: Bullish MACD Crossovers.
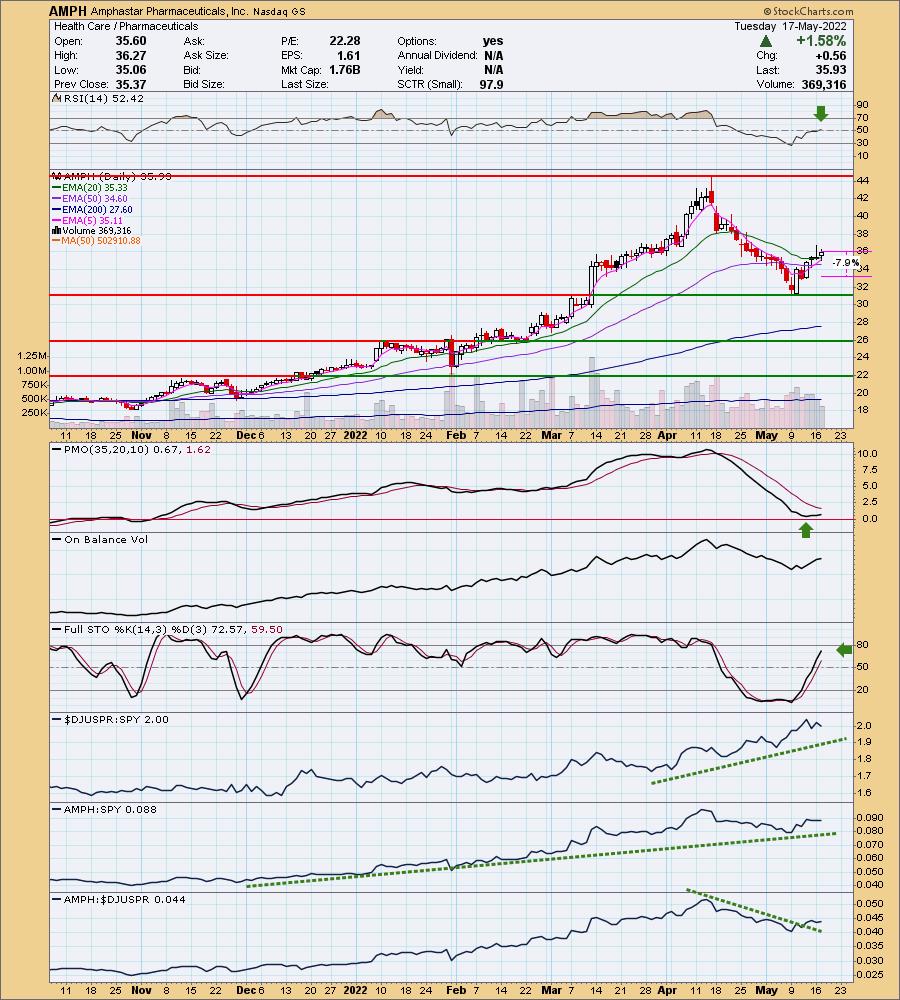
AMPH is down -0.14% in after hours trading. It appears we have a "V" bottom developing. These patterns tell us that when we have 1/3rd retracement of the left side of the "V", we can expect a rally and breakout above the top of the left side of the "V". The RSI just moved into positive territory. Price has overcome resistance at key moving averages. The PMO bottomed above the signal line and is rising toward a crossover BUY signal. Note that the MACD did have a positive crossover today based on the predefined scan that triggered today. Stochastics are rising nicely and should get above 80 soon. The group is seeing strength and AMPH is outperforming the SPY. It hasn't been the best performer among its peers in the group, but that appears to be changing. The stop can be set tighter below the 50-day EMA, but I opted to stretch it out a bit more to avoid being stopped out if we see more volatility within the market.
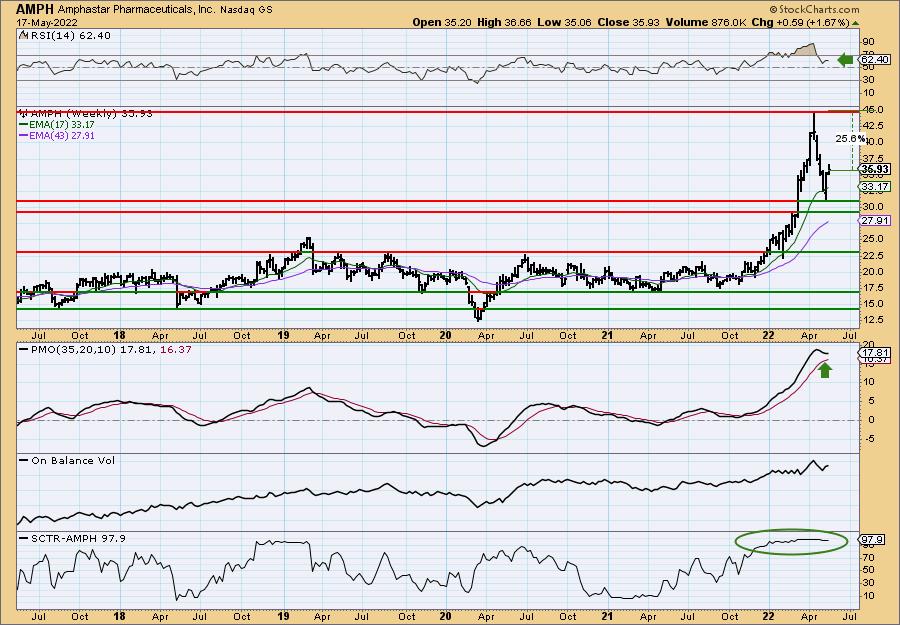
The weekly chart looks good. The weekly RSI is positive and not overbought. The weekly PMO is very overbought, but it is bottoming above the signal line. Note that this has been a strong performer amongst its small-cap peers based on the SCTR. Upside potential is excellent at over 25%. I'm considering this as an add for my portfolio.
iShares Core High Dividend ETF (HDV)
EARNINGS: N/A
HDV tracks a dividend-weighted index of 75 high-yielding US equities, screened for high earnings potential and dividend sustainability.
Predefined Scans Triggered: P&F High Pole.
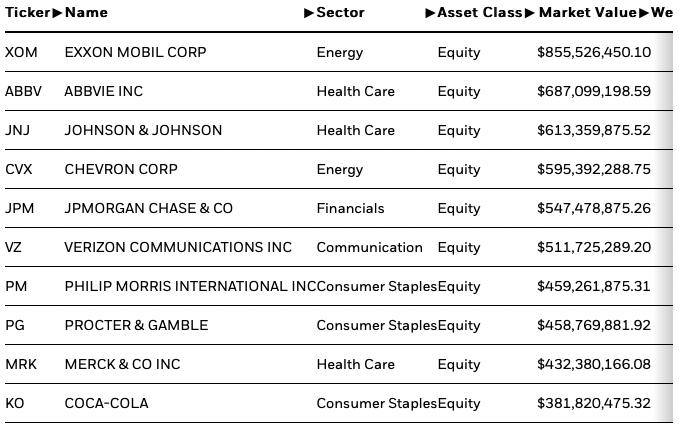
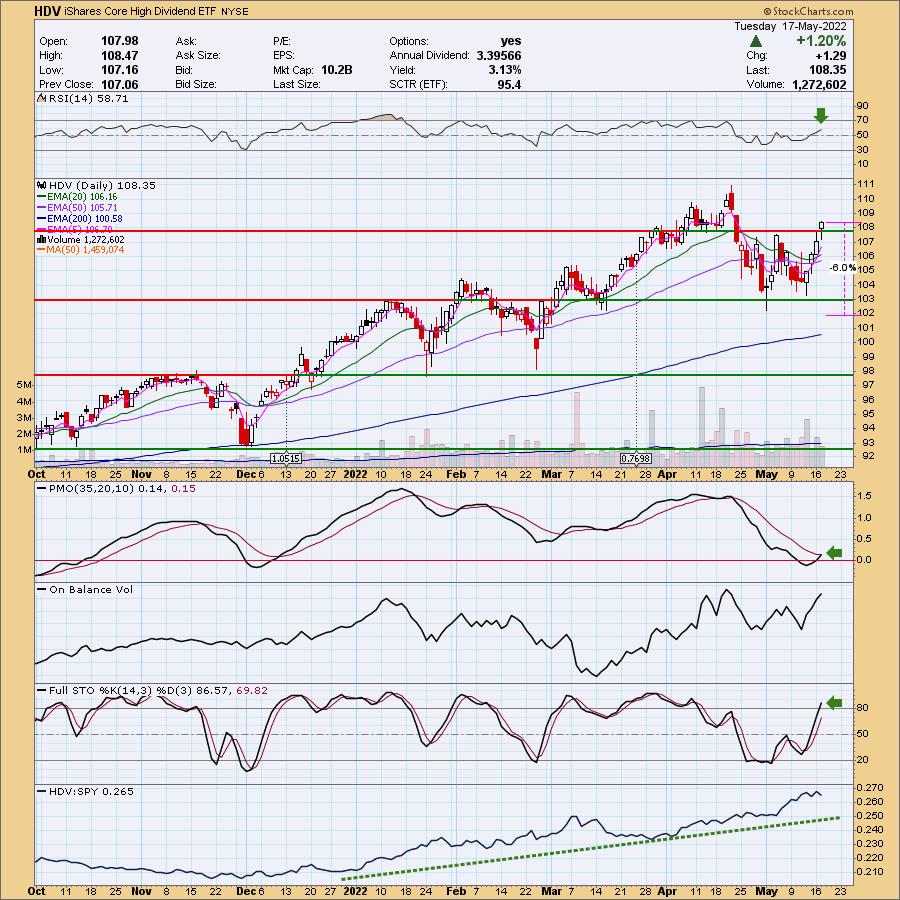
HDV is up +0.67% in after hours trading. I love the double-bottom price pattern. It caught my eye immediately as I sifted through the CandleGlance of my scan results. The pattern has been confirmed with a breakout above the confirmation line today. The RSI is positive and rising. The PMO is about to trigger a crossover BUY signal. Stochastics just moved above 80 today. The ETF is an excellent relative performer. I like that the holdings are primarily in Healthcare, Energy and Consumer Staples. The stop can be set at a tighter 6%. The minimum upside target of the pattern is about $113.
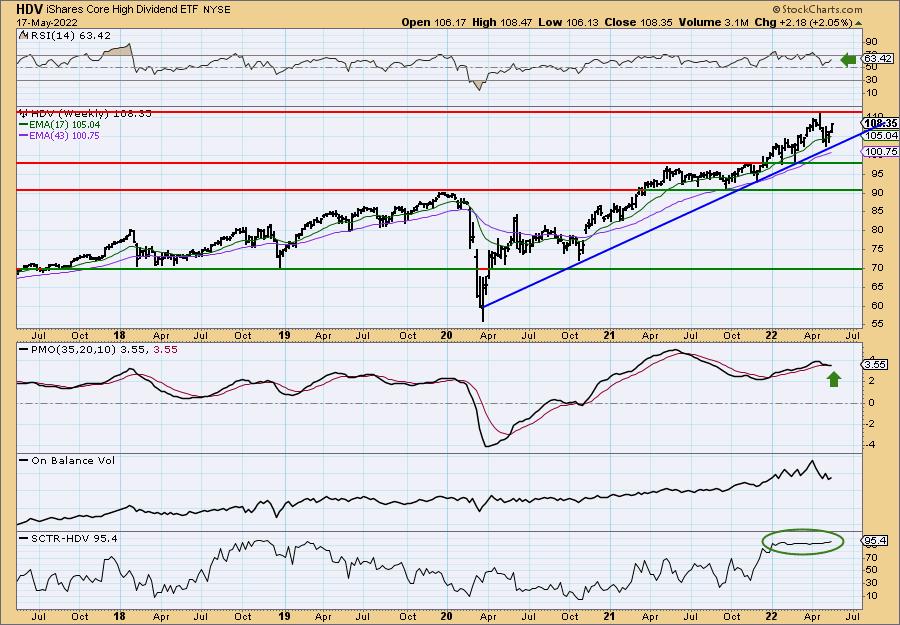
Price is maintaining a steady rising trend since the bear market low. The weekly RSI is positive and rising. The PMO looks suspect, but if you use a thumbnail (not on this chart), you'll see that it has actually turned up and is in the process of generating a whipsaw BUY signal. The SCTR tells us that this stock has been in the upper quartile or higher all year. HDV is currently at all-time highs so consider an upside target of 14% around $123.52.
Don't forget, on Thursdays I look at reader-requested symbols, click HERE to shoot me an email. I read every email I receive and try to answer them all!
Current Market Outlook:
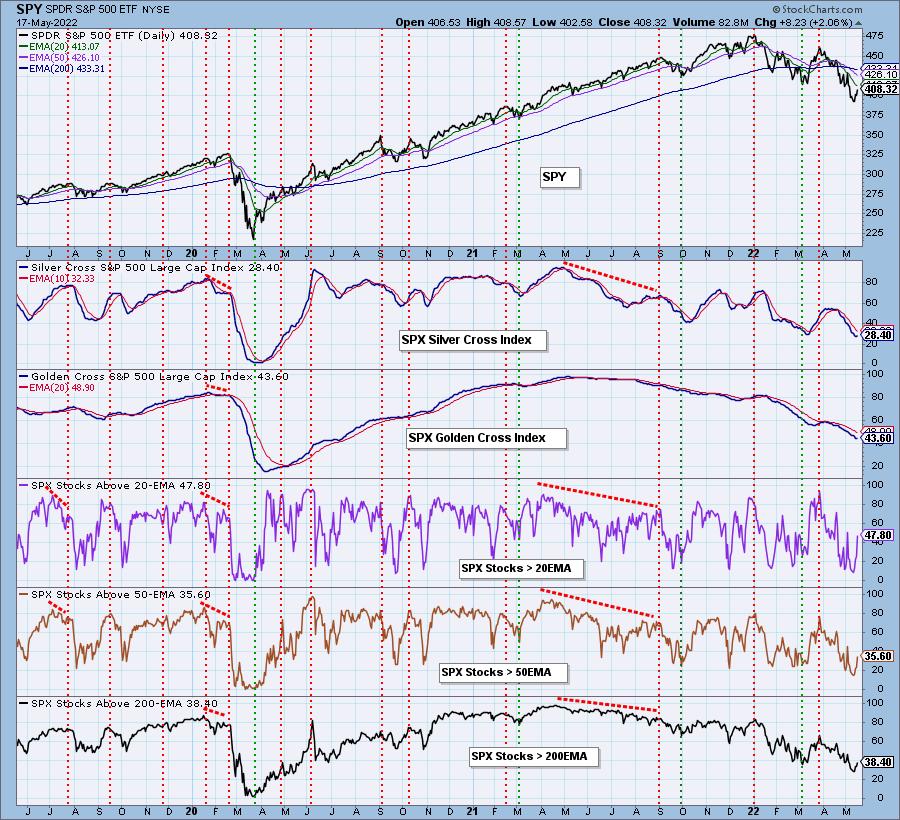
Market Environment: It is important to consider the odds for success by assessing the market tides. The following chart uses different methodologies for objectively showing the depth and trend of participation for intermediate- and long-term time frames.
- The Silver Cross Index (SCI) shows the percentage of SPX stocks on IT Trend Model BUY signals (20-EMA > 50-EMA)
- The Golden Cross Index (GCI) shows the percentage of SPX stocks on LT Trend Model BUY signals (50-EMA > 200-EMA)
Don't forget that as a "Diamonds" member, you have access to our GCI/SCI curated ChartList on DecisionPoint.com. You'll find it under "Members Only" links on the left side on the Blogs and Links Page.
Here is the current chart:
Full Disclosure: I'm 20% invested, 10% are bearish positions.
I'm required to disclose if I currently own a stock and/or may buy/short it within the next 72 hours.
"Technical Analysis is a windsock, not a crystal ball." - Carl Swenlin
(c) Copyright 2022 DecisionPoint.com
Watch the latest episode of DecisionPoint with Carl & Erin Swenlin on Mondays 7:00p EST or on the DecisionPoint playlist on the StockCharts TV YouTube channel here!
NOTE: The stocks reported herein are from mechanical trading model scans that are based upon moving average relationships, momentum and volume. DecisionPoint analysis is then applied to get five selections from the scans. The selections given should prompt readers to do a chart review using their own analysis process. This letter is not a call for a specific action to buy, sell or short any of the stocks provided. There are NO sure things or guaranteed returns on the daily selection of "Diamonds in the Rough."
Helpful DecisionPoint Links:
DecisionPoint Shared ChartList and DecisionPoint Chart Gallery
Price Momentum Oscillator (PMO)
Swenlin Trading Oscillators (STO-B and STO-V)
For more links, go to DecisionPoint.com