
The Diamond PMO Scan produced zero results again today and the Diamond Dog Scan had over 100 choices for shorts. It was a no brainer to continue to select possible shorts as "Diamonds in the Rough".
You'll note I do have one long on the "Stocks to Review" list. It didn't make the final cut mainly because I think betting on a long is too risky given the lack of bullish results today.
All of these stocks report earnings next week. That should help those short positions as earnings have continued to be disappointing this quarter on most stocks.
Tomorrow is Reader Request Day! Don't forget to email me your symbols HERE or share your StockCharts ChartList with erinh@stockcharts.com.
Good Luck & Good Trading,
Erin
What I look for in a short position:
Since two of the positions today are shorts, understand that on the daily chart I'm giving you a "stop" level that is higher than today's current price. We are shorting, so we need to determine how far we will let it rally before covering the short.
On the weekly chart the "targets" are downside targets, not upside targets as I normally do.
I consider a stock a shorting opportunity if strong support has been broken and/or price is far away from the next support level. I want bearish chart patterns if possible. I want to see volume flying out of the stock/ETF.
Today's "Diamonds in the Rough": FSLY (Short), FTDR (Short) and ITT (Short).
Stocks to Review: AAP, CRCT (Short) and SKYW (Short).

Diamond Mine RECORDING LINK (4/22/2022):
Topic: DecisionPoint Diamond Mine (4/22/2022) LIVE Trading Room
Start Time: Apr 22, 2022 09:00 AM
Meeting Recording Link.
Access Passcode: April%22
REGISTRATION FOR 4/29 Diamond Mine:
When: Apr 29, 2022 09:00 AM Pacific Time (US and Canada)
Topic: DecisionPoint Diamond Mine (4/29/2022) LIVE Trading Room
Register in advance for this webinar HERE.
** Save the registration confirmation email with login instructions in case Zoom doesn't notify you in time.**

Free DP Trading Room (4/25) RECORDING LINK:
Topic: DecisionPoint Trading Room
Start Time: Apr 25, 2022 09:00 AM
Meeting Recording Link.
Access Passcode: April@25
For best results, copy and paste the access code to avoid typos.
Welcome to DecisionPoint Daily Diamonds, wherein I highlight ten "Diamonds in the Rough" per week. These are selected from the results of my DecisionPoint Scans, which search for stocks that could benefit from the trend and condition of the market. Remember, these are not recommendations to buy or sell, but are the most interesting of the stocks that surfaced in my scans. My objective is to save you the work of the initial, tedious culling process, but you need to apply your own analysis to see if these stocks pique your interest as well. There are no guaranteed winners here!
"Predefined Scans Triggered" are taken from StockCharts.com using the "Symbol Summary" option instead of a "SharpChart" on the workbench.
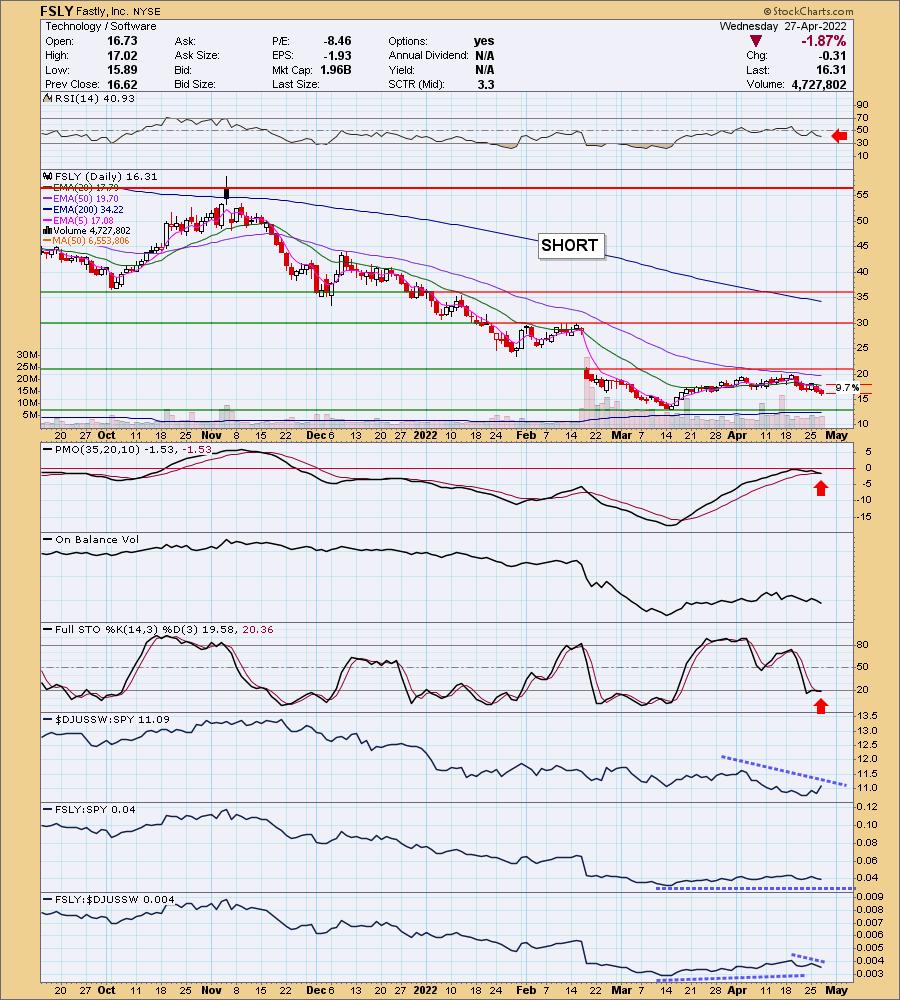
Fastly, Inc. (FSLY) - SHORT
EARNINGS: 5/4/2022 (AMC)
Fastly, Inc. provides real-time content delivery network services. It offers edge compute, edge delivery, edge security, edge applications like load balancing and image optimization, video on demand, and managed edge delivery. The company was founded by Artur Bergman, Tyler McMullen, Simon Wistow, and Gil Penchina in March 2011 and is headquartered in San Francisco, CA.
Predefined Scans Triggered: Moved Below Lower Bollinger Band, Moved Below Lower Price Channel and P&F Double Bottom Breakout.
FSLY is up +0.86% in after hours trading. Price failed at the 50-day EMA and then dropped below the 20-day EMA and support at the April lows. The RSI is negative and falling. The PMO is triggering a crossover SELL signal after it topped beneath the zero line. Stochastics are negative and flat. Relative performance is mostly in line with the SPY or slightly worse, especially the group. With the SPY in a bear market, performing as well as the SPY is not good for a stock; therefore this makes a good short position. It was hard to line up the "stop" level (remember it is higher than price on a short), so just consider covering the position if it gets above the 20-day EMA.
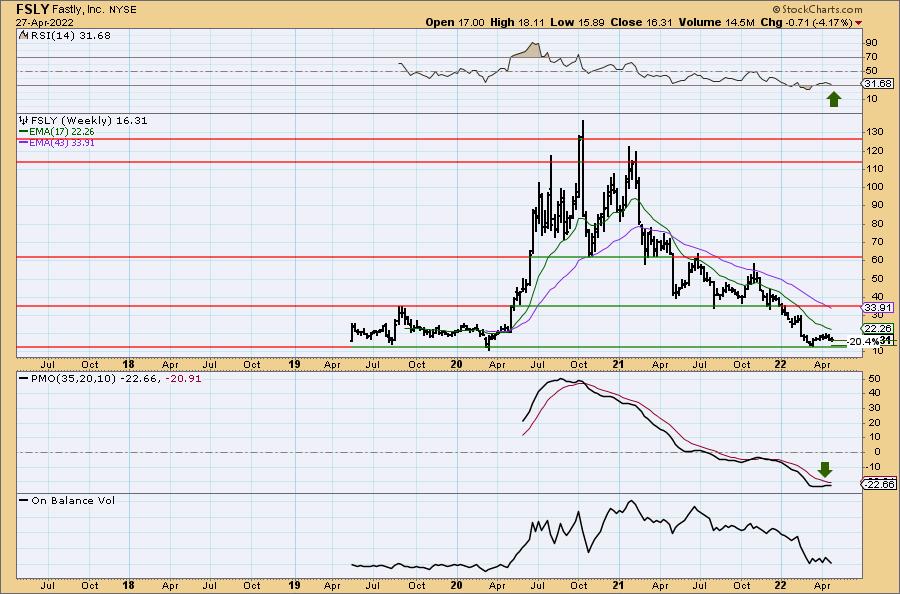
The weekly PMO is turning down beneath its signal line and the weekly RSI is negative and falling further. It may not look like there is downside potential on this short with support being so close, but even if it just challenges that support level it would be a more than 20% gain.
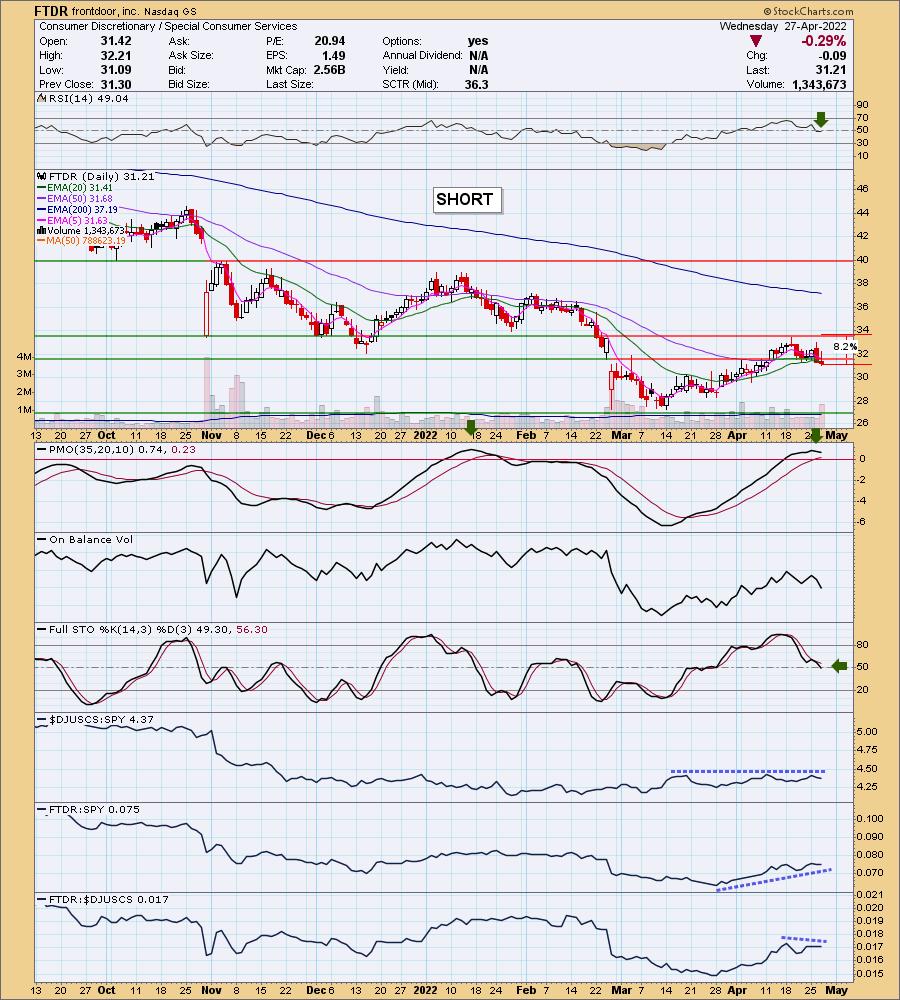
frontdoor, inc. (FTDR) - SHORT
EARNINGS: 5/5/2022 (AMC)
Frontdoor, Inc. engages in the provision of home service plans. Its home service plans cover the repair or replacement of major home's systems and appliances. The firm's service focuses on water heaters, garbage disposals, doorbells, smoke detectors, ceiling fans, central vacuums, refrigerators, dishwashers and trash compactors. Its brands include American Home Shield, HSA, OneGuard and Landmark. The company was founded on January 2, 2018, and is headquartered in Memphis, TN.
Predefined Scans Triggered: Bearish MACD Crossovers and P&F Double Top Breakout.
FTDR is unchanged in after hours trading. It's an ugly chart which is perfect for a short position. The RSI just moved into negative territory and is falling. The PMO is topping just slightly above the zero line. Volume was very high to the downside today so the OBV is confirming this recent decline. Price just dropped below the 20-day EMA which has caused it to also drop below the December low. Relative strength of the group is in line with the SPY, so the group is in a bear market. FTDR has been outperforming the market slightly, but it is now starting to underperform the group which will lead to underperformance against the SPY. The stop set above the April high.
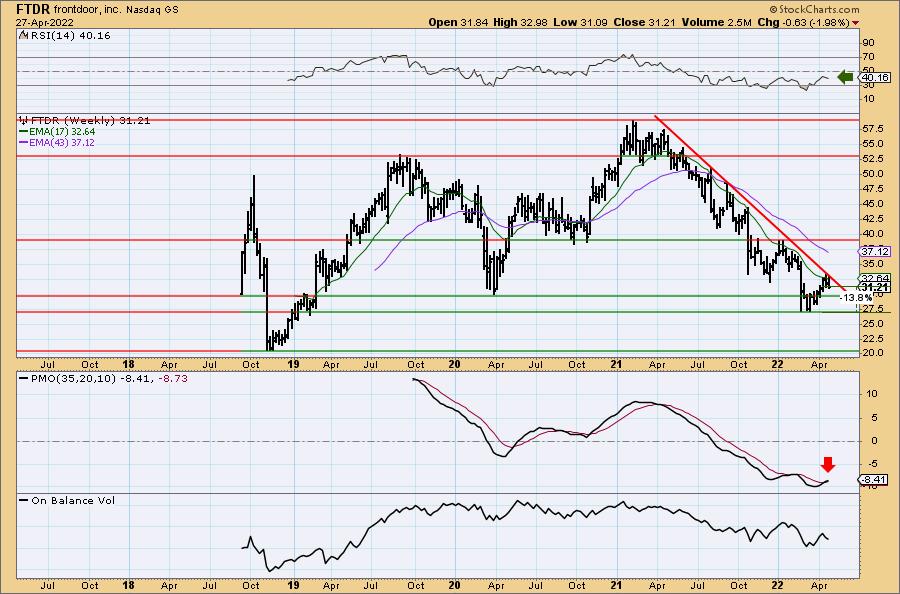
FTDR is in a long-term declining trend. It continues to fail at the 17-week EMA. The weekly RSI is negative and falling. The one detractor is that the weekly PMO has just triggered a crossover BUY signal. I doubt that will stick around. Downside potential is almost 14%, but if it loses that level of support the short could become very lucrative.
ITT Inc. (ITT) - SHORT
EARNINGS: 5/3/2022 (BMO)
ITT, Inc. engages in the manufacture and sale of engineered components and customized technology solutions primarily for the transportation, industrial, and energy markets. It operates through the following segments: Motion Technologies, Industrial Process, Connect and Control Technologies, and Corporate and Other. The Motion Technologies segment manufactures brake pads, shims, shock absorbers, energy absorption components, and sealing technologies primarily for the transportation industry, including passenger cars and trucks, light- and heavy-duty commercial and military vehicles, buses, and trains. The Industrial Process segment includes engineered fluid process equipment in areas such as chemical, oil and gas, mining, and other industrial process markets as well as providing plant optimization and efficiency solutions and aftermarket services and parts. The Connect and Control Technologies segment offers harsh-environment connector solutions and critical energy absorption and flow control components for the aerospace and defense, general industrial, medical, and oil and gas markets. The Corporate and Other segment is composed of corporate office expenses including compensation, benefits, occupancy, depreciation, and other administrative costs, as well as charges related to certain matters, such as asbestos and environmental liabilities, that are managed at a corporate level and are not included in segment results when evaluating performance or allocating resources. The company was founded in 1920 and is headquartered in White Plains, NY.
Predefined Scans Triggered: Improving Chaikin Money Flow, New CCI Buy Signals and P&F Double Bottom Breakout.
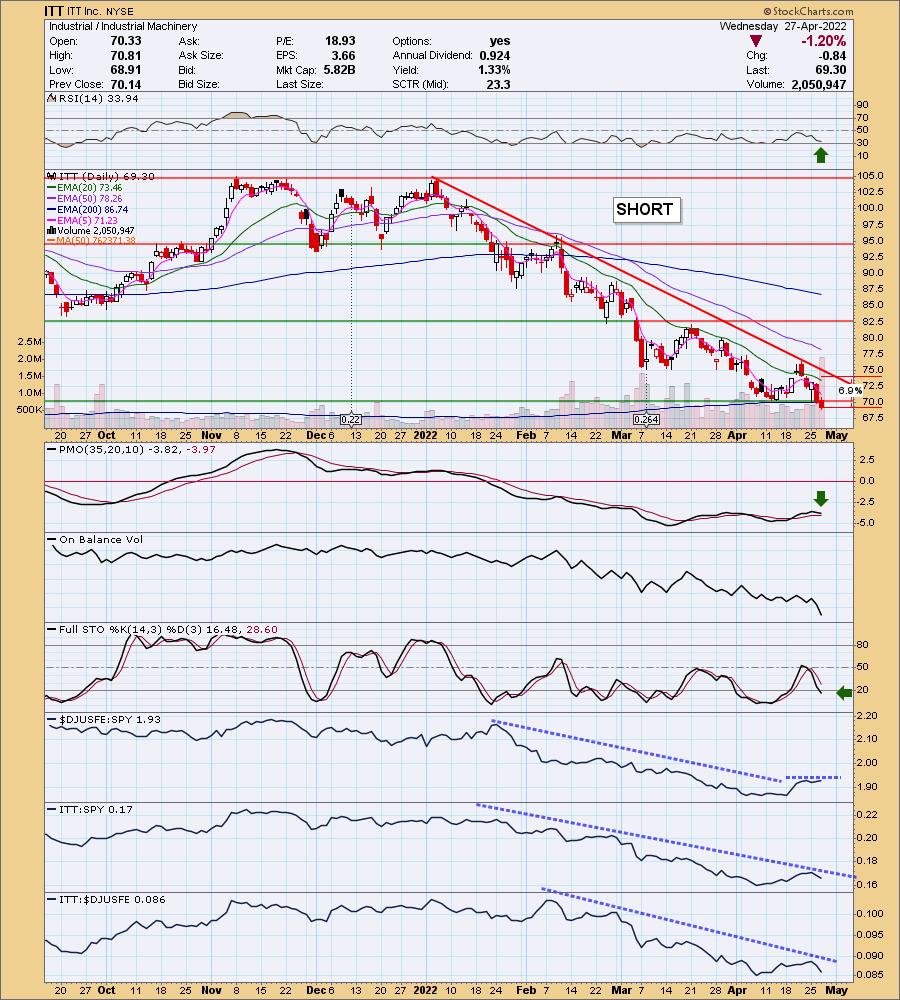
ITT is unchanged in after hours trading. Price has been in a strong declining trend since the beginning of the year. Price is currently at New Lows for the year and recently broke below the April low. The RSI is negative and falling. The PMO has topped well-beneath the zero line. We're seeing very high volume on the selling, particularly this week. Stochastics are negative and falling. Relative strength is poor across the board. The upside stop would be determined on a breakout from the declining trend and consequently a move above the 20-day EMA.
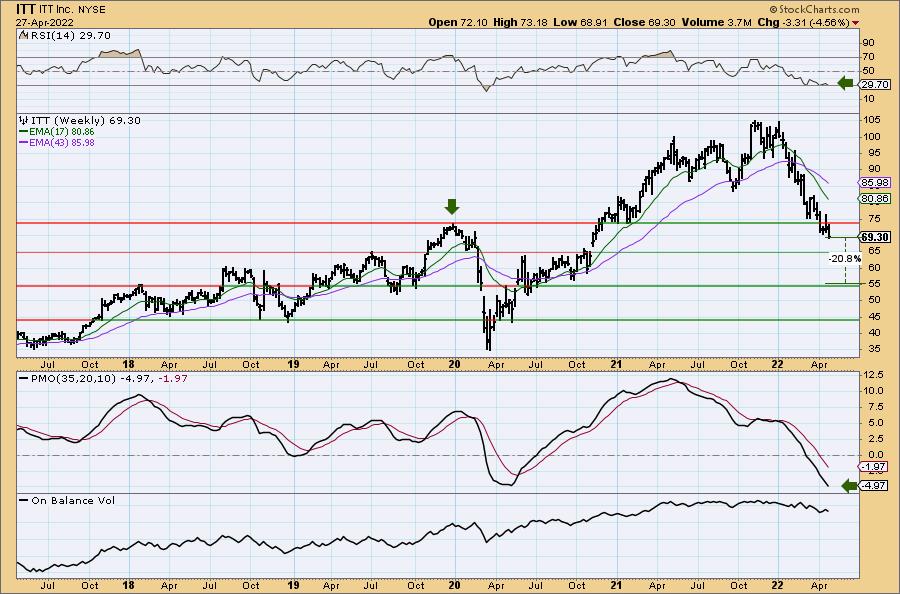
The weekly chart displays a negative weekly RSI and a free falling weekly PMO. There is support available at $65, but given the negative charts, I believe we could see a decline of over 20%, particularly if $65 support level is broken.
Don't forget, on Thursdays I look at reader-requested symbols, click HERE to shoot me an email. I read every email I receive and try to answer them all!
Current Market Outlook:
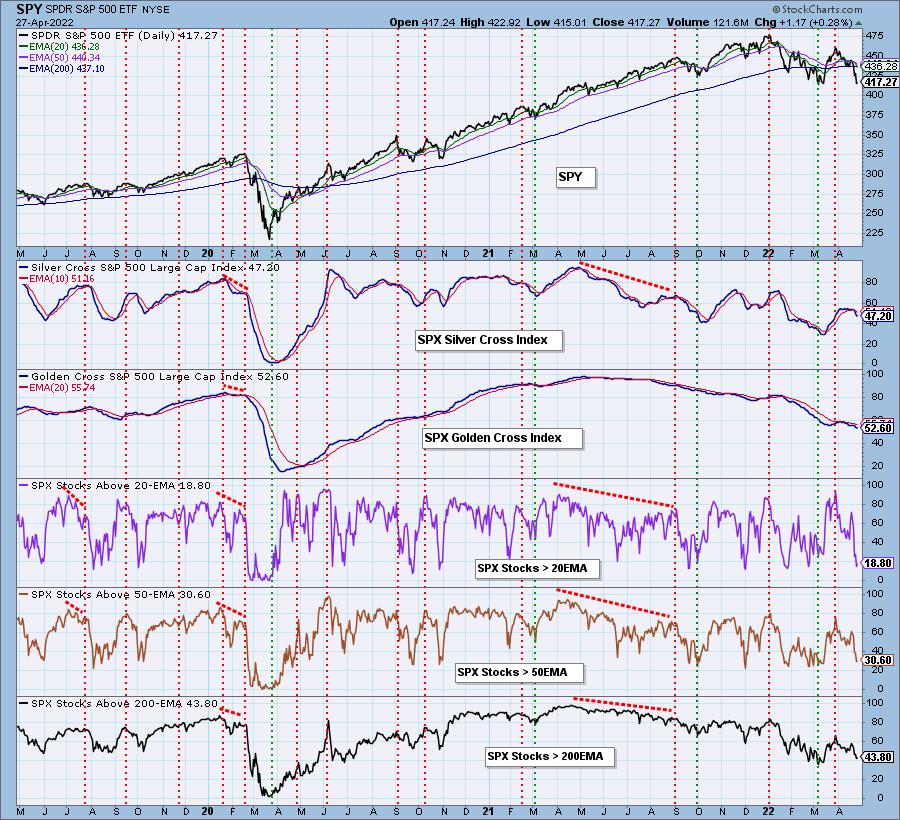
Market Environment: It is important to consider the odds for success by assessing the market tides. The following chart uses different methodologies for objectively showing the depth and trend of participation for intermediate- and long-term time frames.
- The Silver Cross Index (SCI) shows the percentage of SPX stocks on IT Trend Model BUY signals (20-EMA > 50-EMA)
- The Golden Cross Index (GCI) shows the percentage of SPX stocks on LT Trend Model BUY signals (50-EMA > 200-EMA)
Don't forget that as a "Diamonds" member, you have access to our GCI/SCI curated ChartList on DecisionPoint.com. You'll find it under "Members Only" links on the left side on the Blogs and Links Page.
Here is the current chart:
Full Disclosure: I'm 15% invested and 85% is in 'cash', meaning in money markets and readily available to trade with. d
I'm required to disclose if I currently own a stock and/or may buy it within the next 72 hours.
"Technical Analysis is a windsock, not a crystal ball." - Carl Swenlin
(c) Copyright 2022 DecisionPoint.com
Watch the latest episode of DecisionPoint with Carl & Erin Swenlin on Mondays 7:00p EST or on the DecisionPoint playlist on the StockCharts TV YouTube channel here!
NOTE: The stocks reported herein are from mechanical trading model scans that are based upon moving average relationships, momentum and volume. DecisionPoint analysis is then applied to get five selections from the scans. The selections given should prompt readers to do a chart review using their own analysis process. This letter is not a call for a specific action to buy, sell or short any of the stocks provided. There are NO sure things or guaranteed returns on the daily selection of "Diamonds in the Rough."
Helpful DecisionPoint Links:
DecisionPoint Shared ChartList and DecisionPoint Chart Gallery
Price Momentum Oscillator (PMO)
Swenlin Trading Oscillators (STO-B and STO-V)
For more links, go to DecisionPoint.com