
Today's Diamonds Report took awhile to prepare for. I went from having zero scan results to hundreds! The "Diamond PMO Scan" returned 32 results which is less than the overall average. My favorite scan "Momentum Sleepers" returned 352 results! My eyes are blurring. I can't NOT look at a chart that comes through on that scan! Thank goodness for CandleGlance!
Given so many results, I wasn't able to find one "theme" except to say that growth stocks are back. The most results came from the Technology sector with a healthy representation of Computer Services and Software industry groups. I had planned on presenting PayPal (PYPL), but they reported earnings and are down over 17% in after hours trading! Specialty Finance was also well represented in today's results. I was given a Trucker, Daseke (DSKE) in the trading room yesterday which looks great on the breakout, but I found another Trucker in my scan results that hasn't broken out yet.
There is a possibility that I may add exposure tomorrow to take advantage of short-term strength, but any trade will be just that, a "trade", very short-term in nature. I'm not sure which of the "Diamonds in the Rough" I'll select, as it will require a good look at the 5-minute charts in the morning and an assessment of market internals.
Today's "Diamonds in the Rough": CARG, KKR, PERI, SAIA and XLNX.
Stocks to Review (No order): ABC, BAK, APO, ISEE, NTLA, PERI, VWTR, MSCI, CG, CALX, PUBM, CHPT, RRC and ULTA.

RECORDING LINK (1/28/2022):
Topic: DecisionPoint Diamond Mine (1/28/2022) LIVE Trading Room
Start Time: Jan 28, 2022 09:00 AM PT
Meeting Recording Link.
Access Passcode: January#28
REGISTRATION FOR THURSDAY 2/3 Diamond Mine:
When: Feb 3, 2022 09:00 AM Pacific Time (US and Canada)
Topic: DecisionPoint Diamond Mine (THURSDAY 2/3) LIVE Trading Room
Register in advance for this webinar HERE.
Save the registration confirmation email with login instructions in case Zoom doesn't notify you in time.

Topic: DecisionPoint Trading Room
Start Time: Jan 31, 2022 09:00 AM PT
Meeting Recording Link.
Access Passcode: January#31
For best results, copy and paste the access code to avoid typos.
Welcome to DecisionPoint Daily Diamonds, wherein I highlight ten "Diamonds in the Rough" per week. These are selected from the results of my DecisionPoint Scans, which search for stocks that could benefit from the trend and condition of the market. Remember, these are not recommendations to buy or sell, but are the most interesting of the stocks that surfaced in my scans. My objective is to save you the work of the initial, tedious culling process, but you need to apply your own analysis to see if these stocks pique your interest as well. There are no guaranteed winners here!
"Predefined Scans Triggered" are taken from the StockCharts.com using the "Symbol Summary" option instead of a "SharpChart" on the workbench.
CarGurus, Inc. (CARG)
EARNINGS: 2/24/2022 (AMC)
Cargurus, Inc. engages in the provision of online auto shopping. The firm offers proprietary technology, search algorithms and data analytics to analyze new and used car listings. It operates through the following segments: United States and International. The United States segment derives revenues from marketplace subscriptions, advertising services and other revenues from customers within the United States. The International segment includes the revenues from marketplace subscriptions, advertising services and other revenues from customers outside of the United States. The company was founded by Langley Steinert on November 10, 2005 and is headquartered in Cambridge, MA.
Predefined Scans Triggered: P&F Low Pole.
CARG is up +1.33% in after hours trading. I covered CARG on November 11th 2021 (the stop was hit on the break below the 50-day EMA). We are seeing heavy volume coming in on CARG and today it pushed past the 50-day EMA. This was also a breakout from a bullish falling wedge pattern. The RSI just hit positive territory. The PMO has a crossover BUY signal in oversold territory. Stochastics are rising and have just reached positive territory. The group is mildly outperforming the SPY, but we can see CARG turning it on now. The stop is set below the December low.
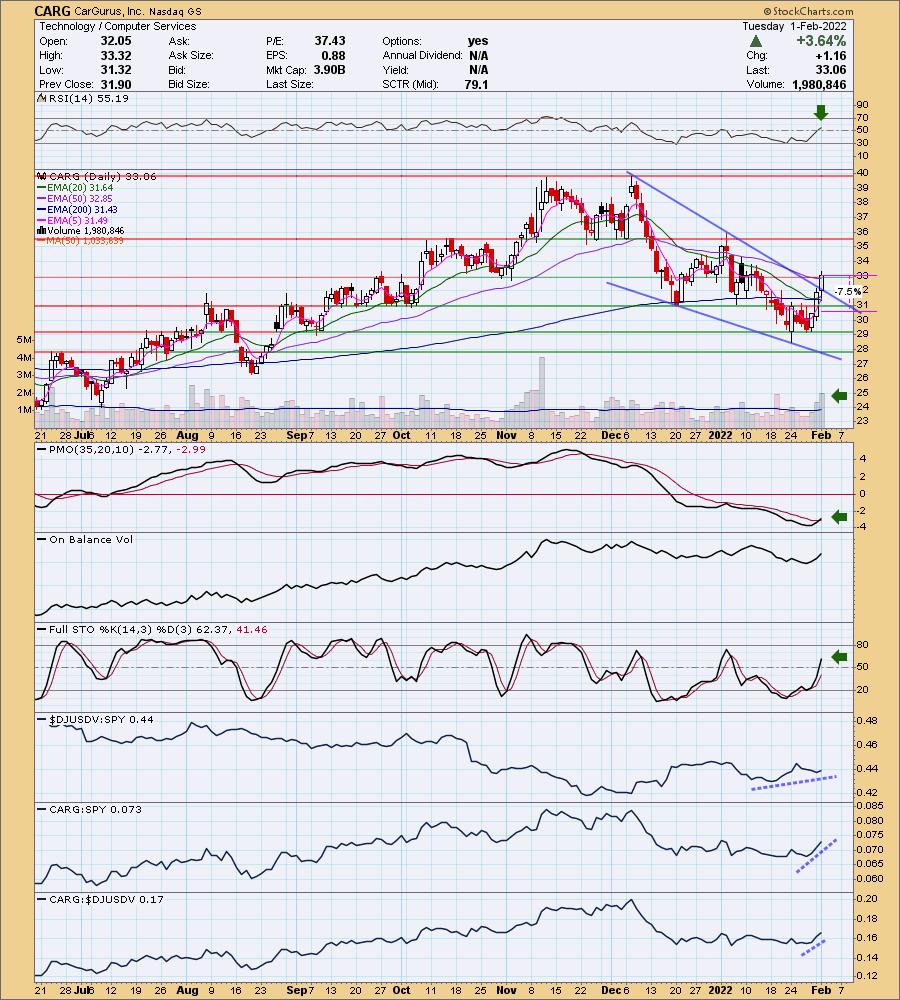
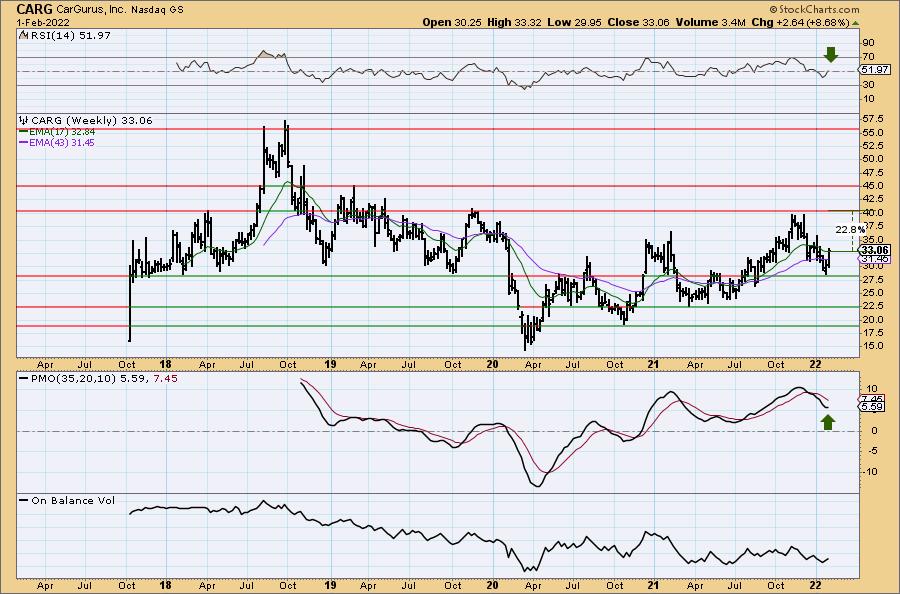
We could see strong overhead resistance at $35, but the strongest resistance is at $40 which is where I set the upside target. The weekly RSI is rising and positive. The weekly PMO is turning back up.
KKR & Co Inc (KKR)
EARNINGS: 2/8/2022 (BMO)
KKR & Co., Inc. engages in the provision of investment and private equity asset management services. It manages investments across multiple asset classes including private equity, energy, infrastructure, real estate, credit, and hedge funds. The firm operates through four business lines: Private Markets, Public Markets, Capital Markets, and Principal Activities. The Private Markets line manages and sponsors a group of private equity funds that invest capital for long-term appreciation, either through controlling ownership of a company or strategic minority positions. The Public Markets line operates combined credit and hedge funds platforms. The Capital Markets line consists of the global capital markets business. It implements traditional and non-traditional capital solutions for investments or companies seeking financing. The Principal Activities line manages the firm's assets and deploys capital to support and grow the businesses. The company was founded by Henry R. Kravis and George R. Roberts in 1976 and is headquartered in New York, NY.
Predefined Scans Triggered: P&F Low Pole.
KKR is up +2.11% in after hours trading. I covered KKR on June 21st 2021. The stop has never hit so it is currently up +25.1%. Price broke out above the 50-day EMA and today saw a ST Trend Model BUY signal as the 5-day EMA crossed above the 20-day EMA. The PMO triggered a crossover BUY signal today. The RSI is rising and positive. Stochastics are positive and should reach above 80 soon indicating internal strength. Relative strength studies are strongly positive. Three others in this group I liked were CG, MSCI and VWTR. It appears the group is really outperforming the SPY right now. The stop is set below support at the August/September tops.
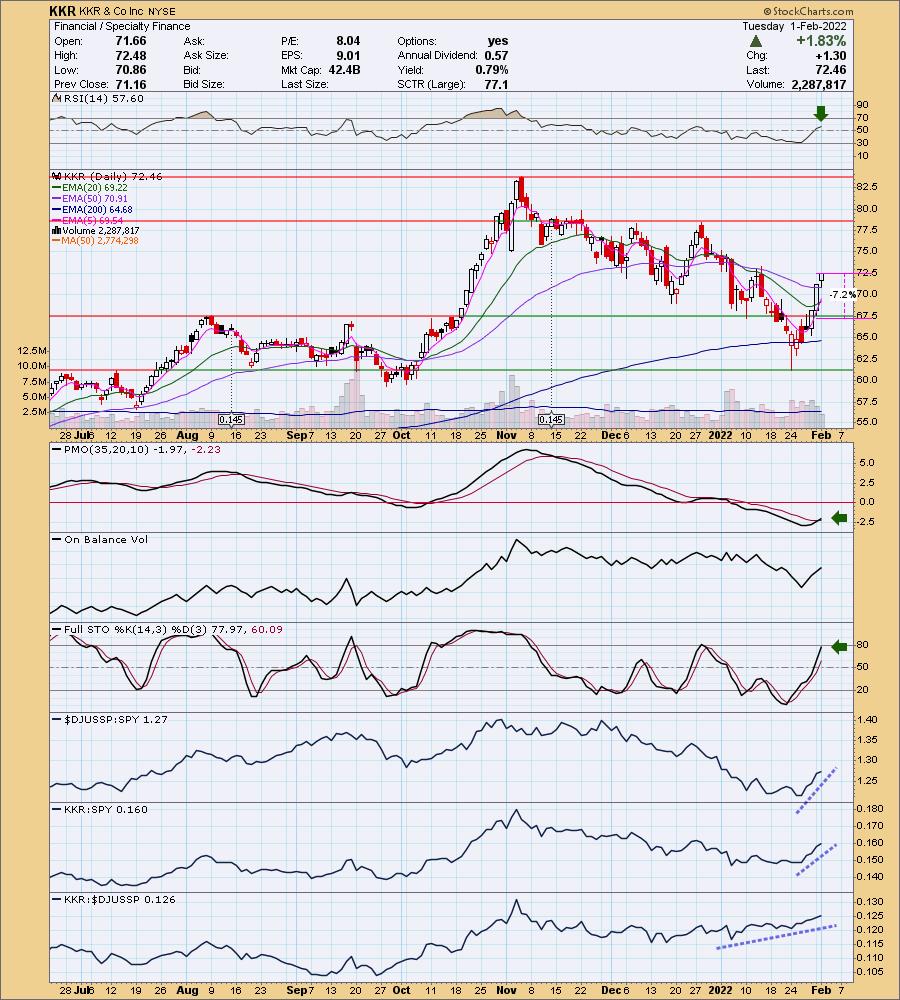
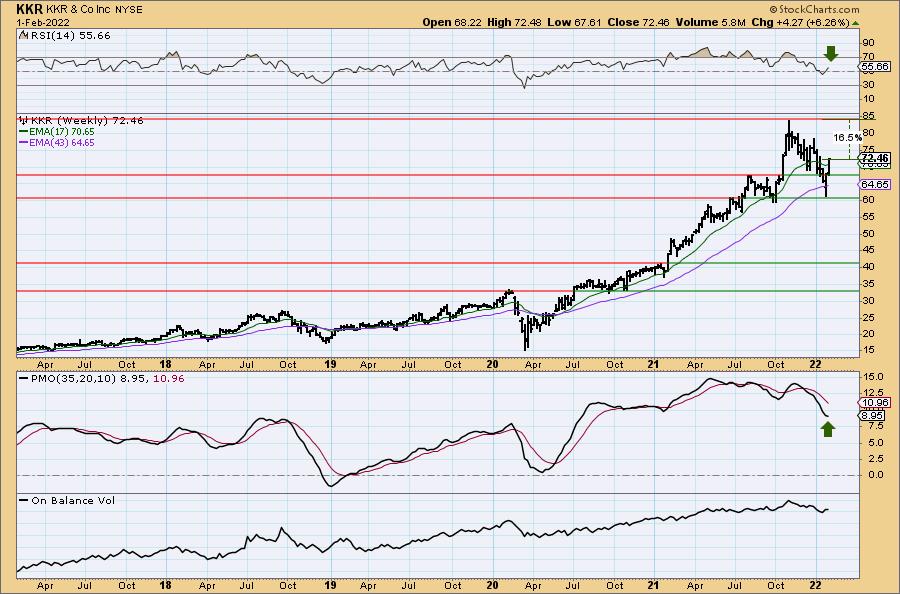
After testing support at the 43-week EMA, price closed above it and is headed higher. The weekly RSI is positive and rising and the PMO is beginning to turn back up. If it can reach prior all-time highs, that would be an over 16% gain.
Perion Network Ltd. (PERI)
EARNINGS: 2/9/2022 (BMO)
Perion Network Ltd. is a global technology company, which engages in the provision of advertising solutions to brands and publishers through innovative platforms. It is committed to providing data-driven execution, from high-impact ad formats to branded search and a unified social and mobile programmatic platform. It offers the following business solutions: Undertone, which connects brands to consumers using engaging creatives; Code Fuel, which enables developers to optimize search traffic and generate incremental revenue; MakeMeReach, an automated social management platform that help ad performance across Facebook, Twitter, Instagram, and Snapchat; and Smilebox, a desktop and mobile applications. The company was founded by Ofer Adler and Yaron Adler in November 1999 and is headquartered in Holon, Israel.
Predefined Scans Triggered: P&F Double Top Breakout.
PERI is up +1.25% in after hours trading. I like the double-bottom confirmation on yesterday's breakout. Today we saw a great follow-through day. While it didn't quite close above the 50-day EMA, it looks favorable. The RSI is now positive, the PMO had a crossover BUY signal today and volume is coming in. Stochastics just hit positive territory and are rising strongly. Relative strength is positive across the board. The stop is set below the 200-day EMA and the December low.
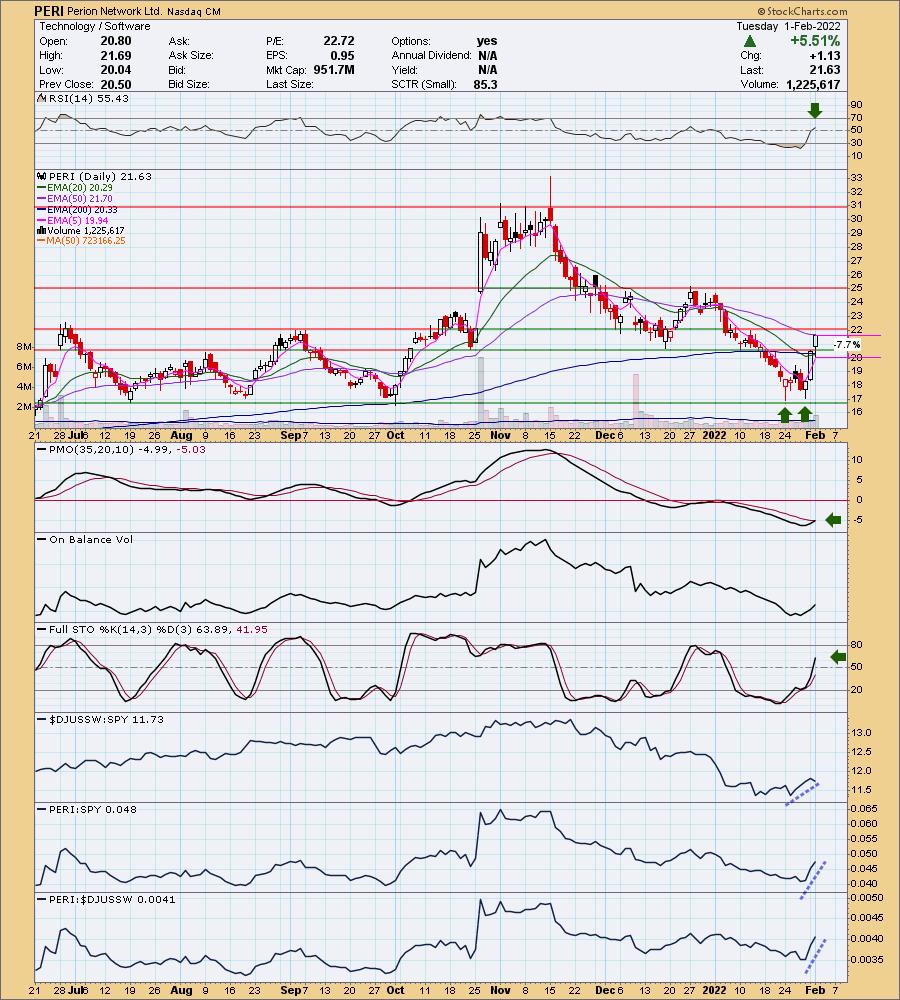
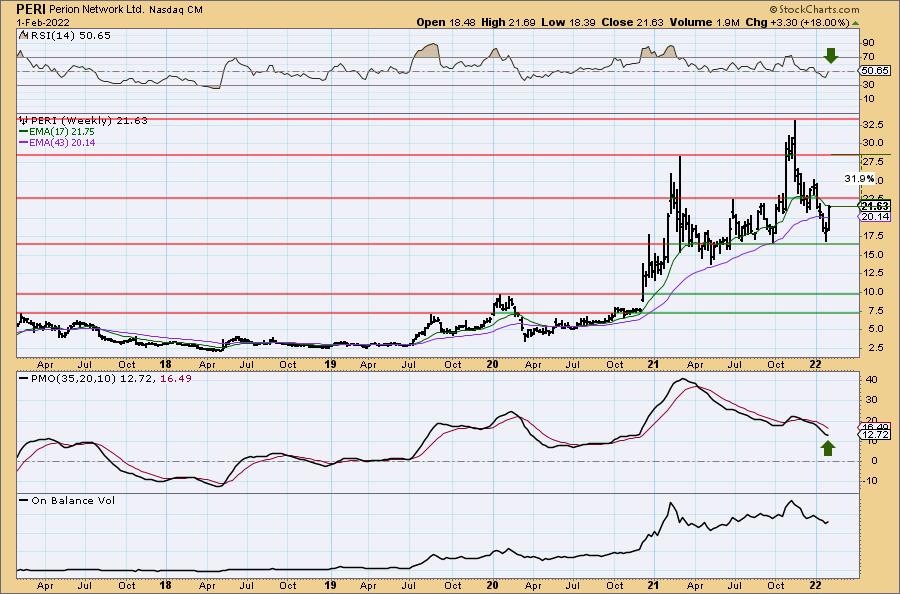
There is overhead resistance arriving very soon at the June top. If it can overcome, we could see a move to $25 which would be an over 15% gain, or if it can push higher, an almost 32% gain at the early 2021 top.
SAIA Inc. (SAIA)
EARNINGS: 2/2/2022 (BMO) ** REPORTS TOMORROW **
Saia, Inc. operates as a transportation holding company. The firm through its wholly-owned subsidiaries provides regional and interregional less-than-truckload (LTL) services through a single integrated organization. The firm also offers other value-added services, including non-asset truckload, expedited and logistics services across North America. The company was founded by Louis Saia, Sr. in 1924 and is headquartered in Johns Creek, GA.
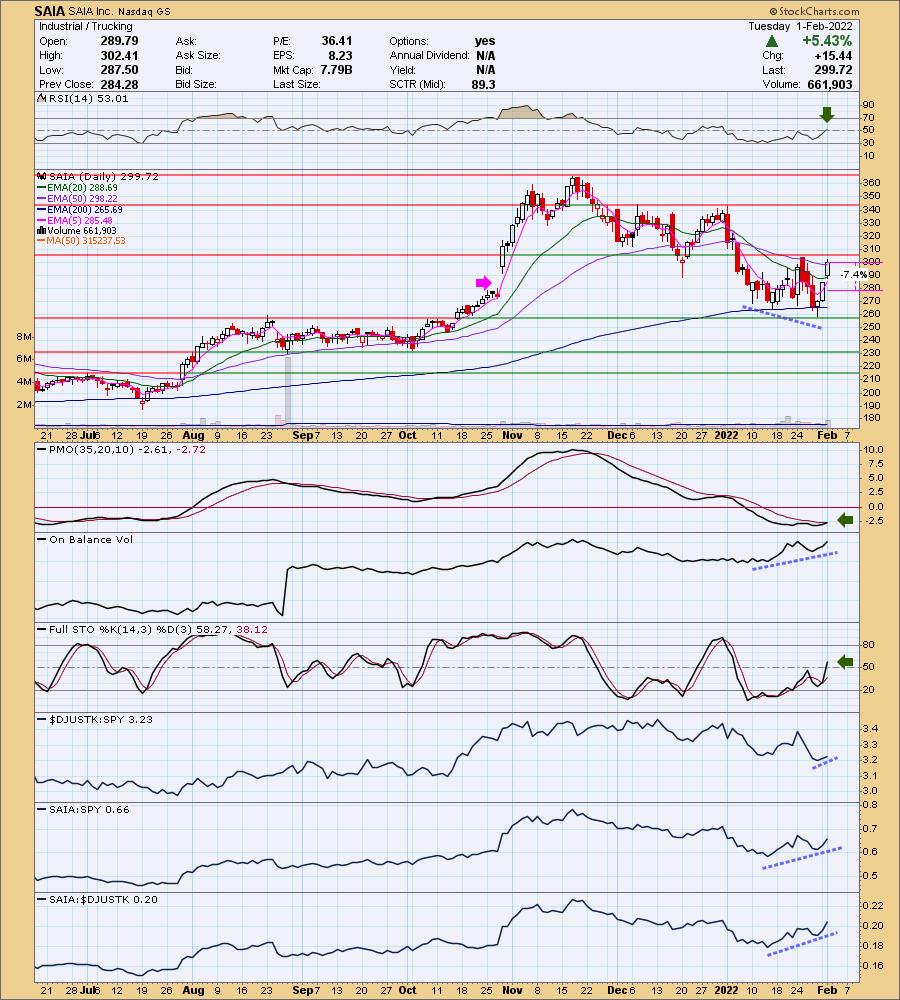
Predefined Scans Triggered: Parabolic SAR Buy Signals.
SAIA is up +0.37% in after hours trading. I covered SAIA on August 12th 2020. The position is still open (it nearly triggered the stop about four times, but never closed below it) so it is up +128.0%. It does report tomorrow so we may or may not see follow-through on the current rally. The indicators tell me we will see higher prices. The RSI just hit positive territory and the PMO triggered a crossover BUY signal today. There is a strong OBV positive divergence with price lows. Stochastics just hit positive territory above net neutral (50). Relative strength is improving across the board. The stop is set below gap support from late October.
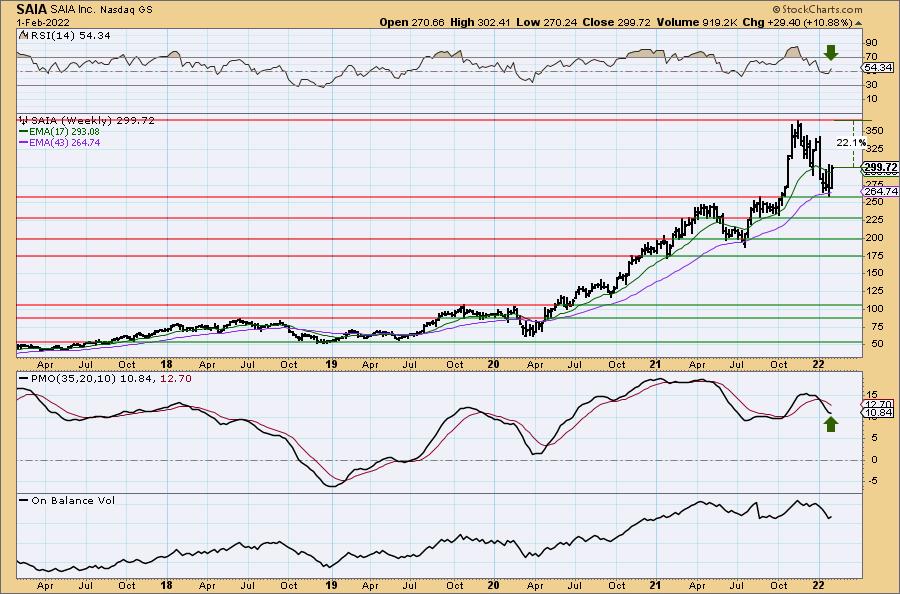
Price held important support at the earlier 2021 highs and 43-week EMA. The weekly RSI is back in positive territory and the weekly PMO is turning up. If it can reach all-time highs again it would be an over 22% gain.
Xilinx, Inc. (XLNX)
EARNINGS: 4/27/2022 (AMC)
Xilinx, Inc. engages in the design and development of programmable logic semiconductor devices and the related software design tools. It also provides design services, customer training, field engineering, and technical support. The company was founded by Ross Freeman, Bernard Vonderschmitt, and James V. Barnett in February 1984 and is headquartered in San Jose, CA.
Predefined Scans Triggered: Bullish MACD Crossovers, Entered Ichimoku Cloud and P&F Double Top Breakout.
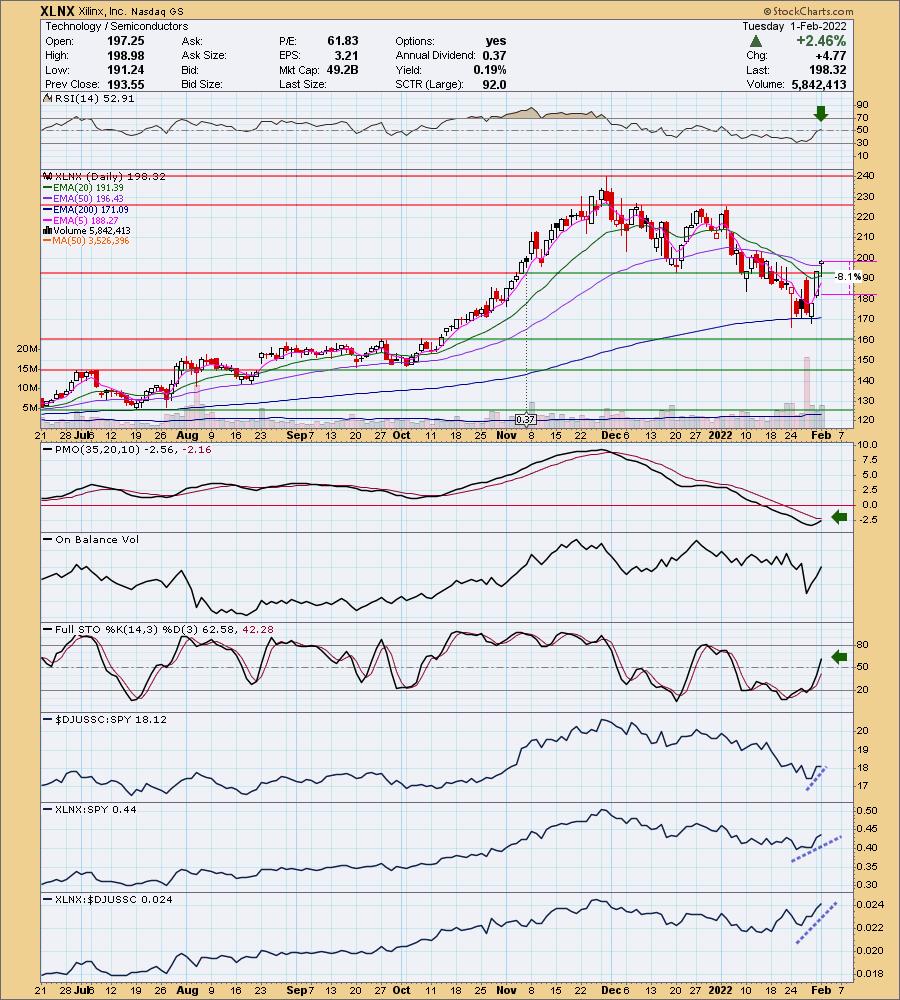
XLNX is up a whopping +9.92% in after hours trading so entry tomorrow could be tricky given a likely gap up on the open. This is one on my shopping list but could prove to be too expensive. We'll see. The chart is very bullish with the RSI popping back above net neutral (50). The PMO is nearing an oversold crossover BUY signal. Price closed above the 50-day EMA today. Stochastics are rising and just hit positive territory. The group is starting to see a little love as rotation moves back into growth. It is a leader in the group based on relative strength. The stop is set below the intraday low in early January.
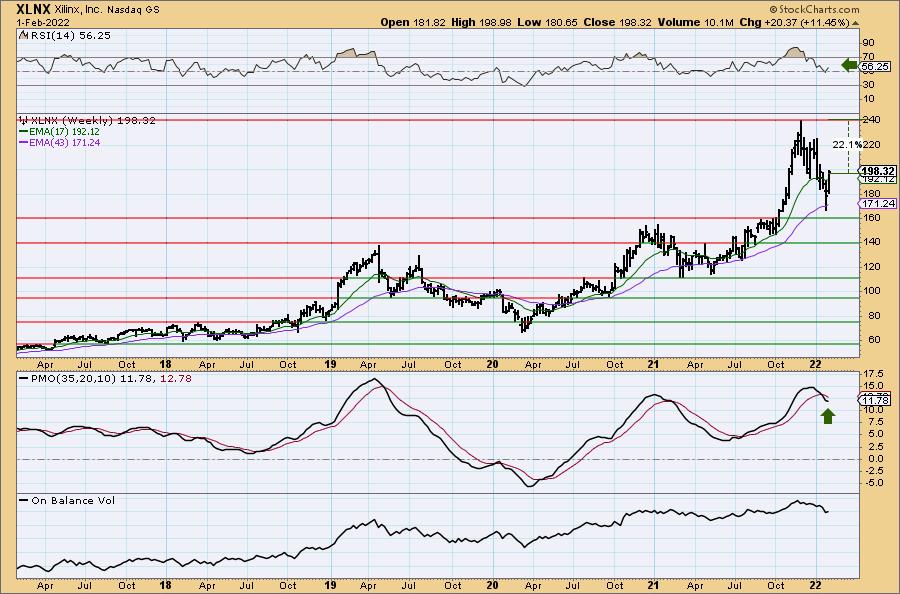
Now that price is back above the 17-week EMA, I don't see any overhead resistance until we hit the all-time high. The weekly RSI is positive and the weekly PMO just turned back up. If it can reach the all-time high, that would be an over 22% gain. Seems it is on its way based on after hours trading.
Don't forget, on Thursdays I look at reader-requested symbols, click HERE to shoot me an email. I read every email I receive and try to answer them all!
Current Market Outlook:
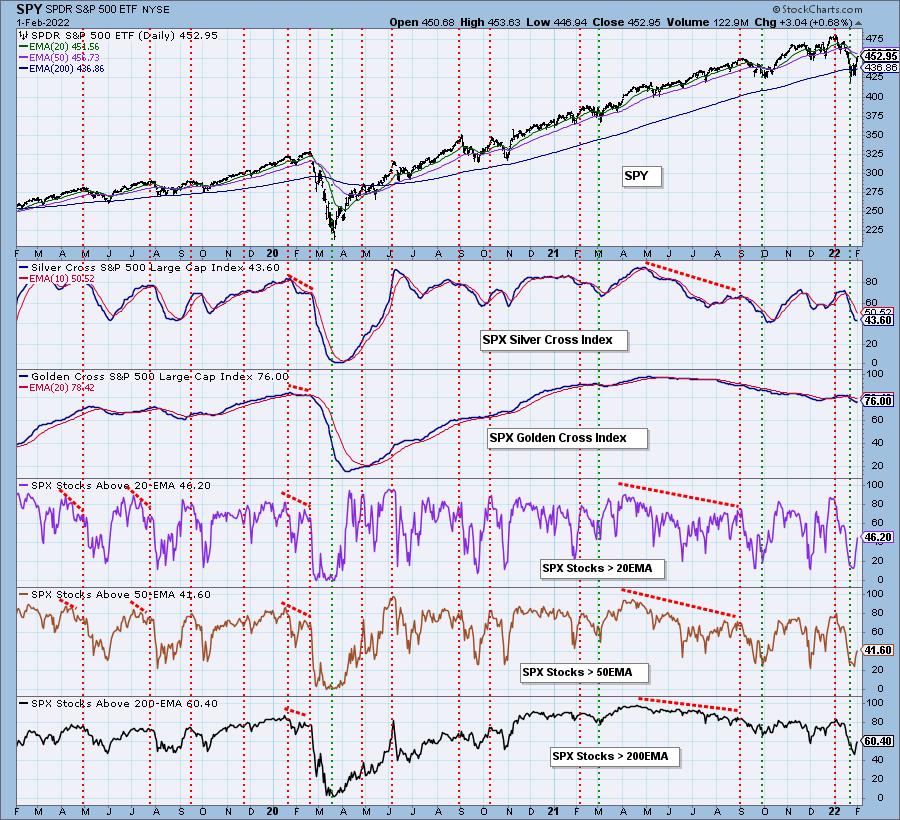
Market Environment: It is important to consider the odds for success by assessing the market tides. The following chart uses different methodologies for objectively showing the depth and trend of participation for intermediate- and long-term time frames.
- The Silver Cross Index (SCI) shows the percentage of SPX stocks on IT Trend Model BUY signals (20-EMA > 50-EMA)
- The Golden Cross Index (GCI) shows the percentage of SPX stocks on LT Trend Model BUY signals (50-EMA > 200-EMA)
Don't forget that as a "Diamonds" member, you have access to our GCI/SCI curated ChartList on DecisionPoint.com. You'll find it under "Members Only" links on the left side on the Blogs and Links Page.
Here is the current chart:
Full Disclosure: I'm 8% invested and 92% is in 'cash', meaning in money markets and readily available to trade with. There is a possibility that I may purchase one or more of today's "Diamonds in the Rough". I'm leaning toward CARG and XLNX, but the other three are very enticing as well. If I do purchase, I will only expand my exposure to at most 25%.
I'm required to disclose if I currently own a stock and/or may buy it within the next 72 hours.
Happy Charting!
- Erin
"Technical Analysis is a windsock, not a crystal ball." - Carl Swenlin
(c) Copyright 2022 DecisionPoint.com
Watch the latest episode of DecisionPoint with Carl & Erin Swenlin on Mondays 7:00p EST or on the DecisionPoint playlist on the StockCharts TV YouTube channel here!
NOTE: The stocks reported herein are from mechanical trading model scans that are based upon moving average relationships, momentum and volume. DecisionPoint analysis is then applied to get five selections from the scans. The selections given should prompt readers to do a chart review using their own analysis process. This letter is not a call for a specific action to buy, sell or short any of the stocks provided. There are NO sure things or guaranteed returns on the daily selection of "Diamonds in the Rough."
Helpful DecisionPoint Links:
DecisionPoint Shared ChartList and DecisionPoint Chart Gallery
Price Momentum Oscillator (PMO)
Swenlin Trading Oscillators (STO-B and STO-V)
For more links, go to DecisionPoint.com