
Two sectors tied for the "Sector to Watch". They both had merit with only tiny differences that I'll point out. Consequently, I picked two "Industry Groups to Watch" instead of one.
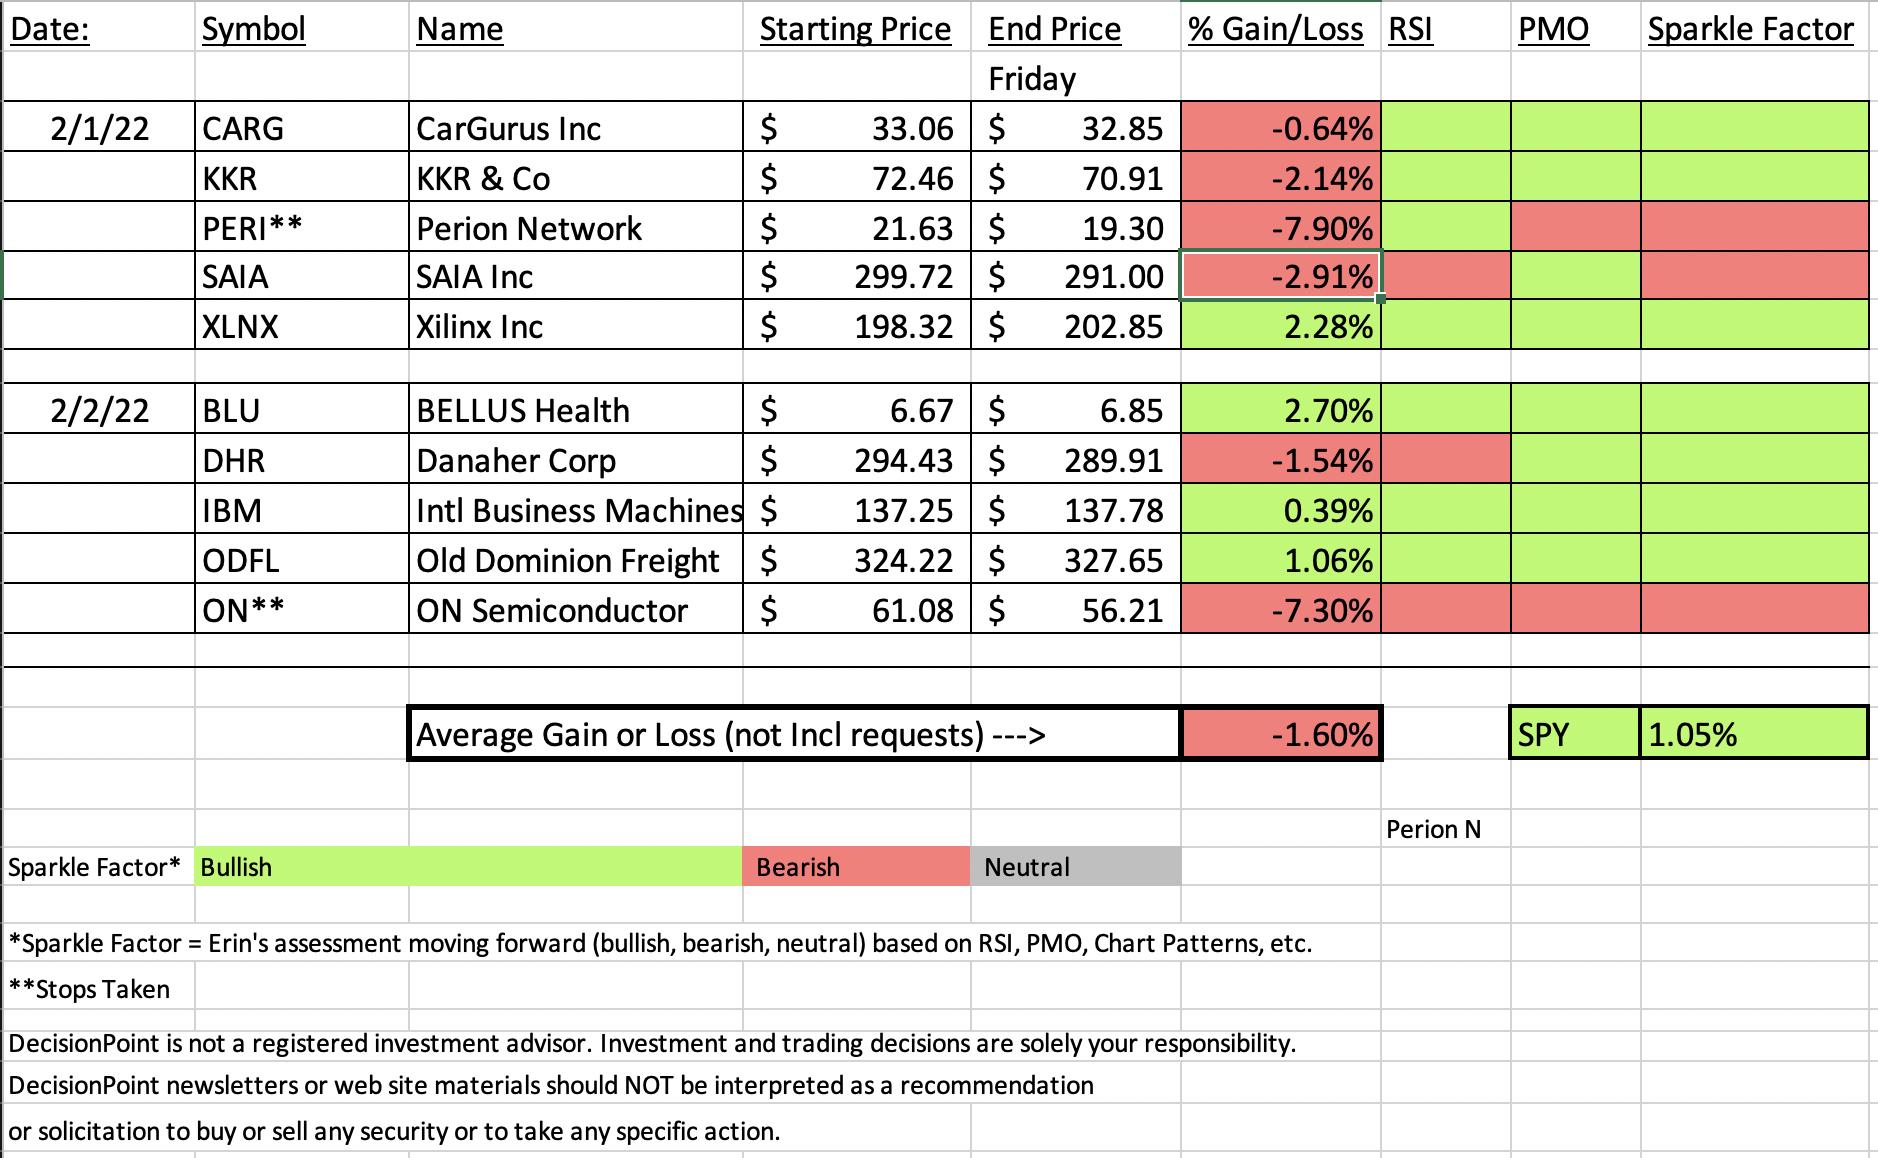
It's a short week for "Diamonds in the Rough" since we only had ten picks on Tuesday and Wednesday. Picks on Tuesday benefitted from the market rally on Wednesday, but shaved any gains with the decline in the market today. Yesterday's picks only had today to 'mature' and given it was a down day, they didn't do well.
Overall, 7 out of the 10 picks still look fairly positive moving forward. The biggest loser this week would technically be Perion Networks (PERI) which was down over 10% since Tuesday. On the spreadsheet I took the 7.9% stop. ON Semiconductor (ON) was down almost 8% and triggered its stop of 7.3%. We will look at the "Dud", PERI below.
Below you'll find the latest Diamond Mine recording link as well as the registration link for next week. Next week's schedule goes back to normal.
I'm still planning on doing the free DP Trading Room on Monday from Vegas before I check out. However, there is a chance it will be canceled if the bandwidth doesn't cooperate or rescheduled to Tuesday. I'll notify everyone via email.
Have a great weekend!

RECORDING LINK (2/3/2022):
Topic: DecisionPoint Diamond Mine (THURSDAY 2/3) LIVE Trading Room
Start Time: Feb 3, 2022 09:00 AM
Meeting Recording Link.
Access Passcode: February@3rd
REGISTRATION FOR Friday 2/11 Diamond Mine:
When: Feb 11, 2022 09:00 AM Pacific Time (US and Canada)
Topic: DecisionPoint Diamond Mine (2/11/2022) LIVE Trading Room
Register in advance for this webinar HERE.
Save the registration confirmation email with login instructions in case Zoom doesn't notify you in time.

Free DP Trading Room (1/31) RECORDING LINK:
Topic: DecisionPoint Trading Room
Start Time: Jan 31, 2022 08:58 AM
Meeting Recording Link.
Access Passcode: January#31
For best results, copy and paste the access code to avoid typos.
A few items about the spreadsheet: I've put on the spreadsheet whether the RSI is positive (green) or negative (red). The PMO column tells you if it is rising (green) or falling (red). Finally I've added my own "Sparkle Factor" that gives you my assessment going forward, bullish (green), bearish (red) or neutral (gray). The Sparkle Factor is basically my thoughts on whether I expect it to rise or fall. A neutral means it could really go either way so it could be added to a watch list. If you're in a stock I consider "neutral" going forward, the ball is in your court.
Darling:
BELLUS Health, Inc. (BLU)
EARNINGS: 2/23/2022 (AMC)
BELLUS Health, Inc. is a clinical-stage biopharmaceutical company developing novel therapeutics for the treatment of cough hypersensitivity and other hypersensitization disorders. Its product BLU-5937, is being developed for the treatment of chronic cough and chronic pruritus, or chronic itch. The company was founded on June 17, 1993 and is headquartered in Laval, Canada.
Predefined Scans Triggered: Improving Chaikin Money Flow.
Below are the commentary and chart from yesterday (2/2):
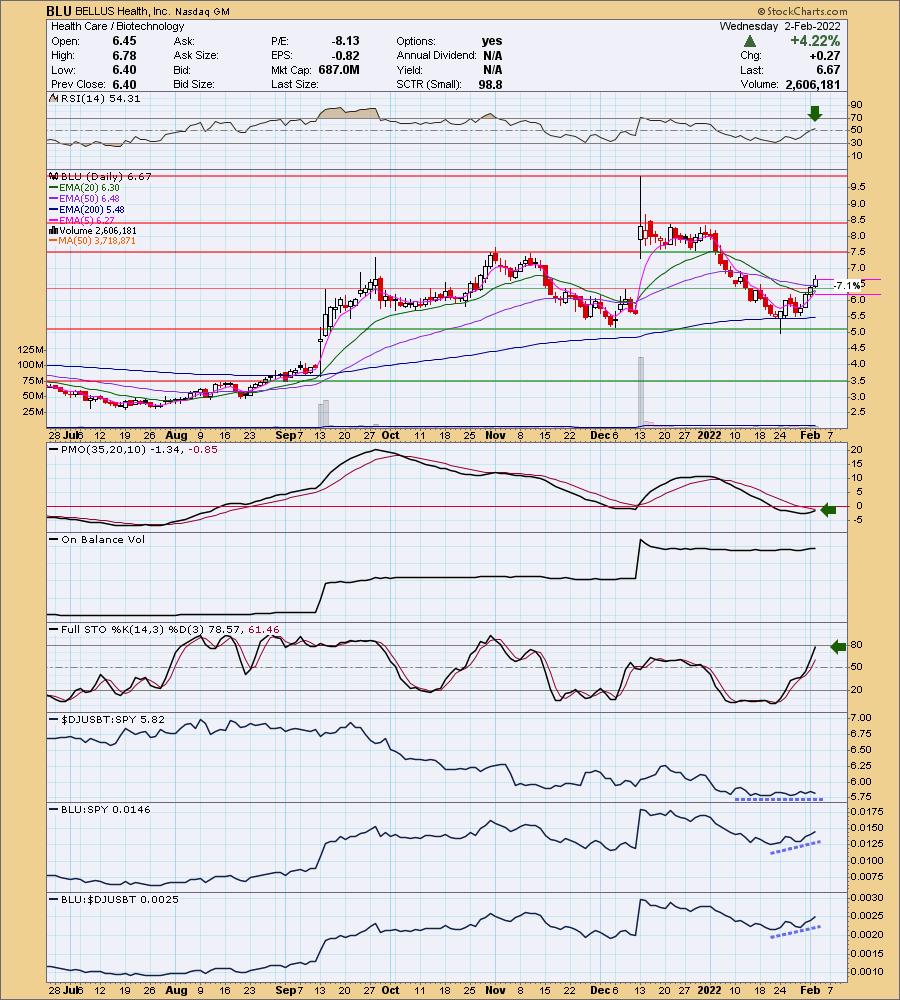
"BLU is down -0.15% in after hours trading. I like this bottoming formation on the 200-day EMA. Today price tackled and closed above the 50-day EMA. The RSI just hit positive territory and the PMO is working toward a crossover BUY signal. Stochastics are strong and should reach above 80 shortly. Biotechs as a group are performing in line with the market, but BLU is outperforming them both. Just be careful here, Biotechs are volatile. The stop is set below the 20-day EMA."
Here is today's chart:
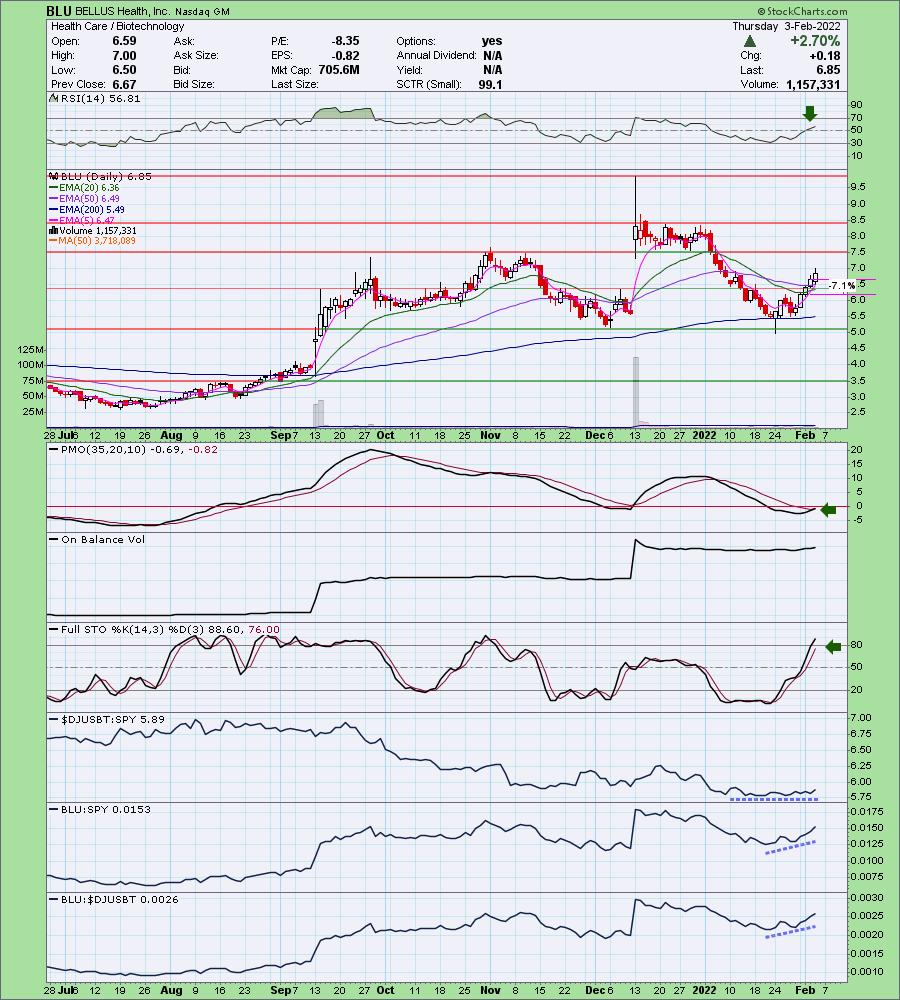
Biotechs haven't broken out relatively speaking, but there are pockets of strength within the group and BLU is inside that pocket in Biotechs. Indicators are still positive. Even if it stops its rally at overhead resistance at $7.50 that would still be an over 8% gain from here. Just remember it is low-priced and volatile so position size so that you can sleep at night.
Don't forget, on Thursdays I look at reader-requested symbols, so shoot me an email at erin@decisionpoint.com. I read every email I receive and try to answer them all!
Dud:
Perion Network Ltd. (PERI)
EARNINGS: 2/9/2022 (BMO)
Perion Network Ltd. is a global technology company, which engages in the provision of advertising solutions to brands and publishers through innovative platforms. It is committed to providing data-driven execution, from high-impact ad formats to branded search and a unified social and mobile programmatic platform. It offers the following business solutions: Undertone, which connects brands to consumers using engaging creatives; Code Fuel, which enables developers to optimize search traffic and generate incremental revenue; MakeMeReach, an automated social management platform that help ad performance across Facebook, Twitter, Instagram, and Snapchat; and Smilebox, a desktop and mobile applications. The company was founded by Ofer Adler and Yaron Adler in November 1999 and is headquartered in Holon, Israel.
Predefined Scans Triggered: P&F Double Top Breakout.
Below are the commentary and chart from Tuesday (2/1):
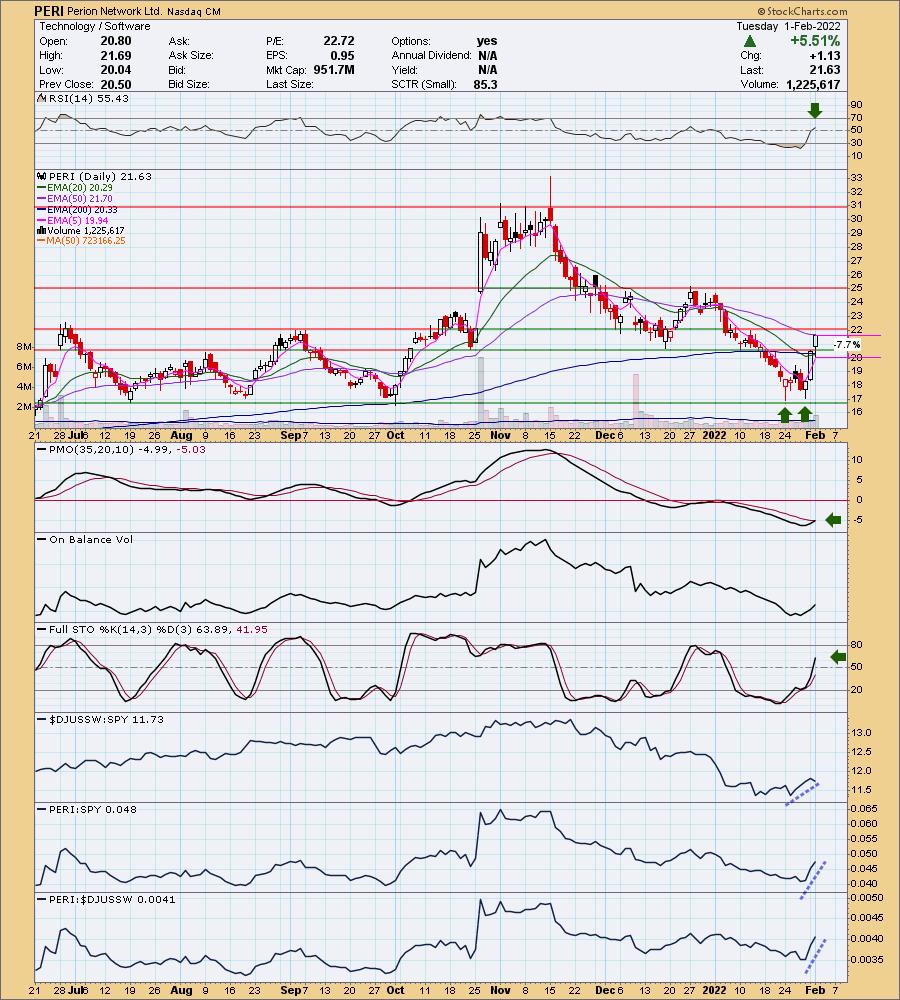
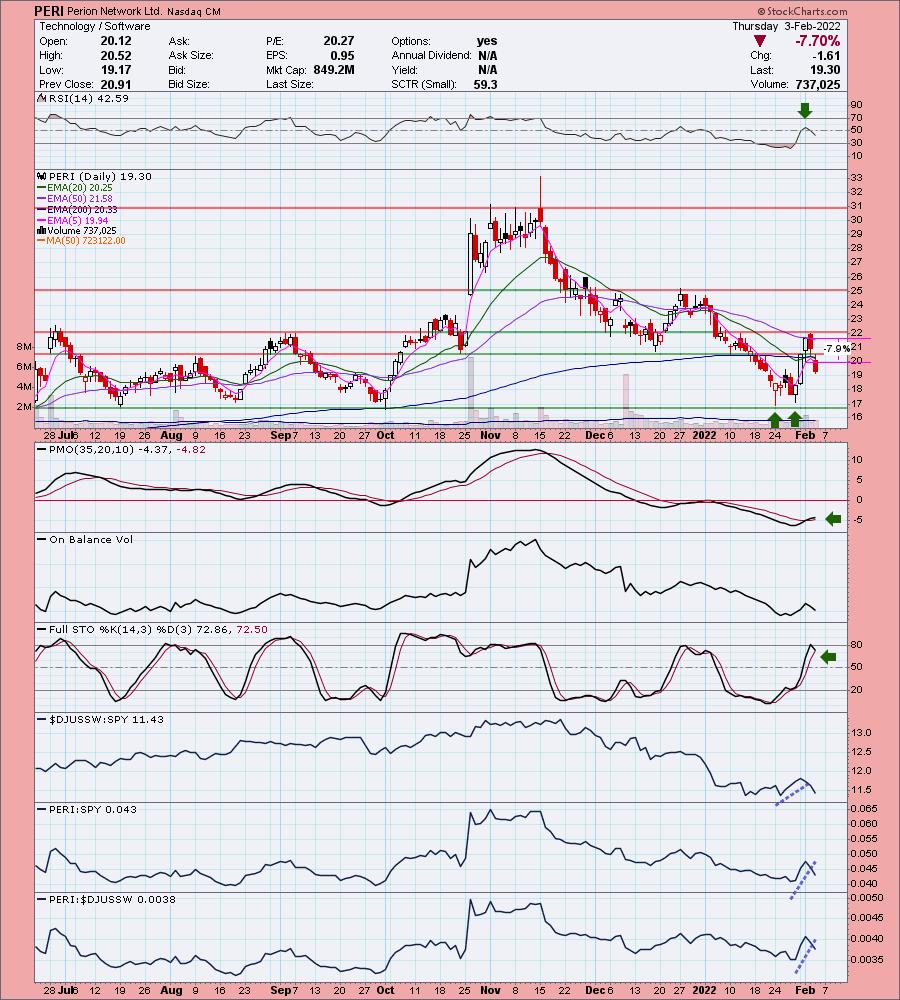
"PERI is up +1.25% in after hours trading. I like the double-bottom confirmation on yesterday's breakout. Today we saw a great follow-through day. While it didn't quite close above the 50-day EMA, it looks favorable. The RSI is now positive, the PMO had a crossover BUY signal today and volume is coming in. Stochastics just hit positive territory and are rising strongly. Relative strength is positive across the board. The stop is set below the 200-day EMA and the December low."
Below is today's chart:
Technology led the charge out of last month's low, but it has fizzled out quickly. The group has lost relative strength so PERI is now underperforming. The RSI moved into negative territory and Stochastics topped as soon as they made it above 80. Selling volume isn't outrageously high, but the loss of support levels triggered the stop. I suggest avoiding this industry group until we get follow-through on any rotation into this group.
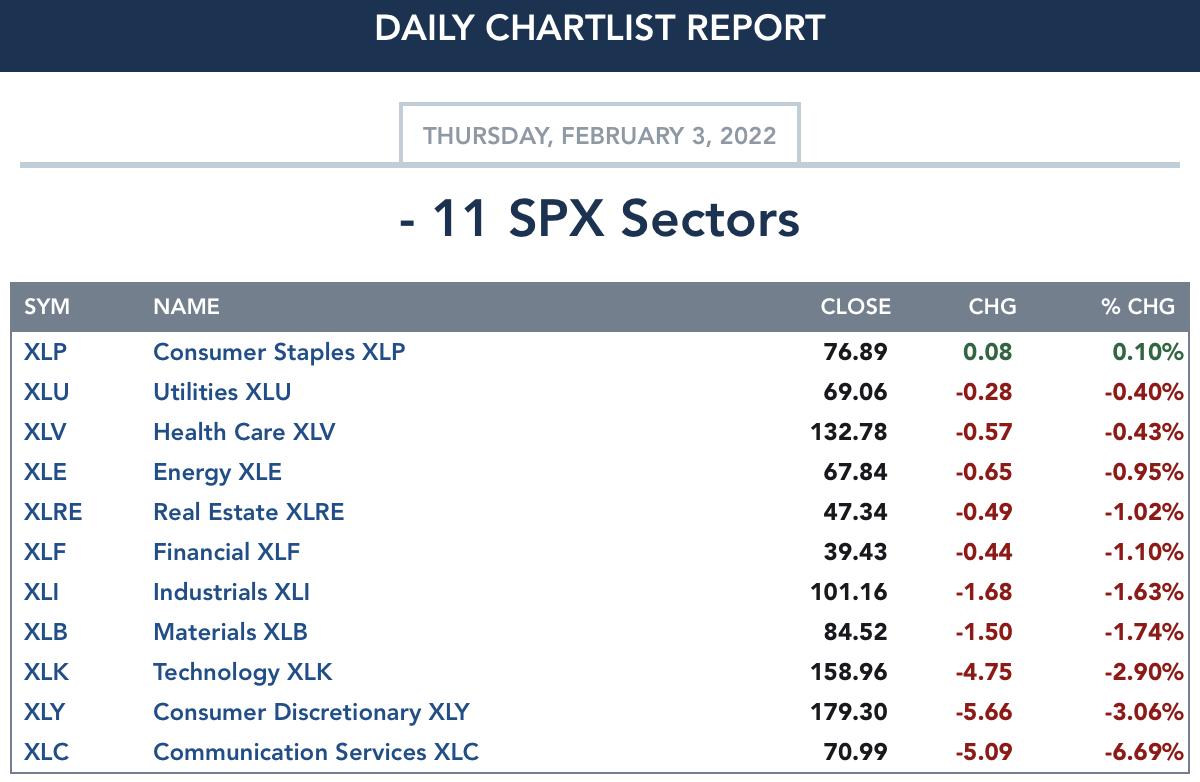
TODAY'S Sector Performance:
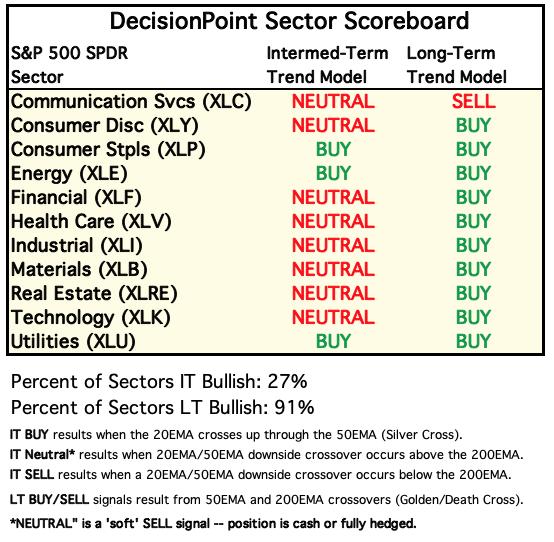
DecisionPoint Sector Scoreboard (Mechanical Trend Model Signals): We lost four IT Trend Model "Silver Cross" BUY signals, XLI, XLRE, XLB and XLF this week.
Click Here to view Carl's annotated Sector ChartList!
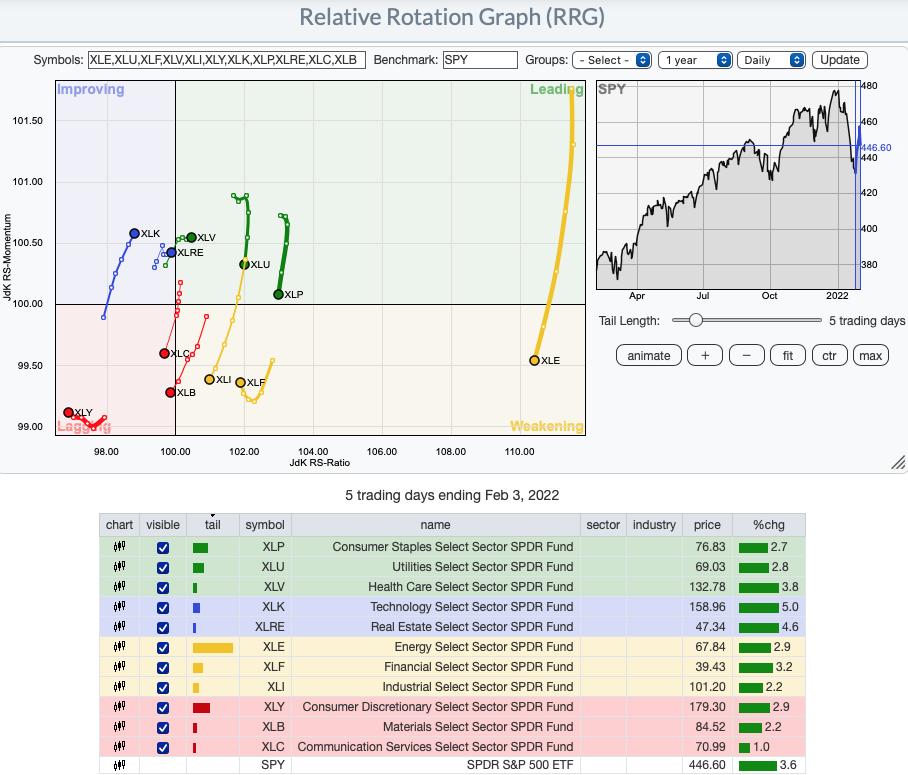
Short-term (Daily) RRG: The most bullish sectors based on the RRG would be XLK, XLV, XLRE and XLF. XLK and XLRE are heading in the bullish northeast direction out of Improving. XLV has the same direction but is within Leading. XLF is on the list of the most bullish sectors due to it hooking back around in Weakening toward Leading. Julius de Kempenaer says that is usually one of the more bullish signs on an RRG. XLC, XLB and XLY are Lagging and getting weaker as they travel in the bearish southwest direction. XLE and XLI are in Weakening with XLU and XLP on their way to join them.
Intermediate-Term (Weekly) RRG: It's not the finish of the week, but here is the long-term RRG or weekly version. In the longer term, defensive areas of the market are looking the best (XLU, XLP, XLRE and XLE). Aggressive sectors like XLK and XLY are Weakening with XLY nearing Lagging. XLC appears to be showing some improvement in the longer term, but it is still Lagging. Up and coming sectors in the longer term are XLI, XLV and XLF. XLB is looking weak as it heads toward Weakening out of Leading.
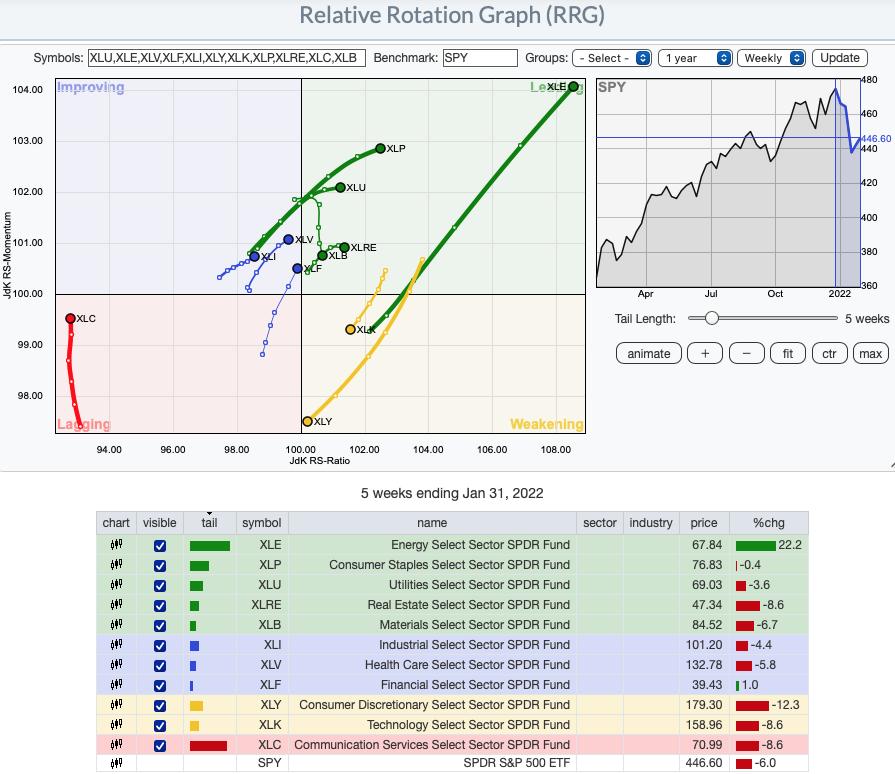
RRG® charts show you the relative strength and momentum for a group of stocks. Stocks with strong relative strength and momentum appear in the green Leading quadrant. As relative momentum fades, they typically move into the yellow Weakening quadrant. If relative strength then fades, they move into the red Lagging quadrant. Finally, when momentum starts to pick up again, they shift into the blue Improving quadrant.
CLICK HERE for an animated version of the RRG charts.
Sector #1 to Watch: Health Care (XLV)
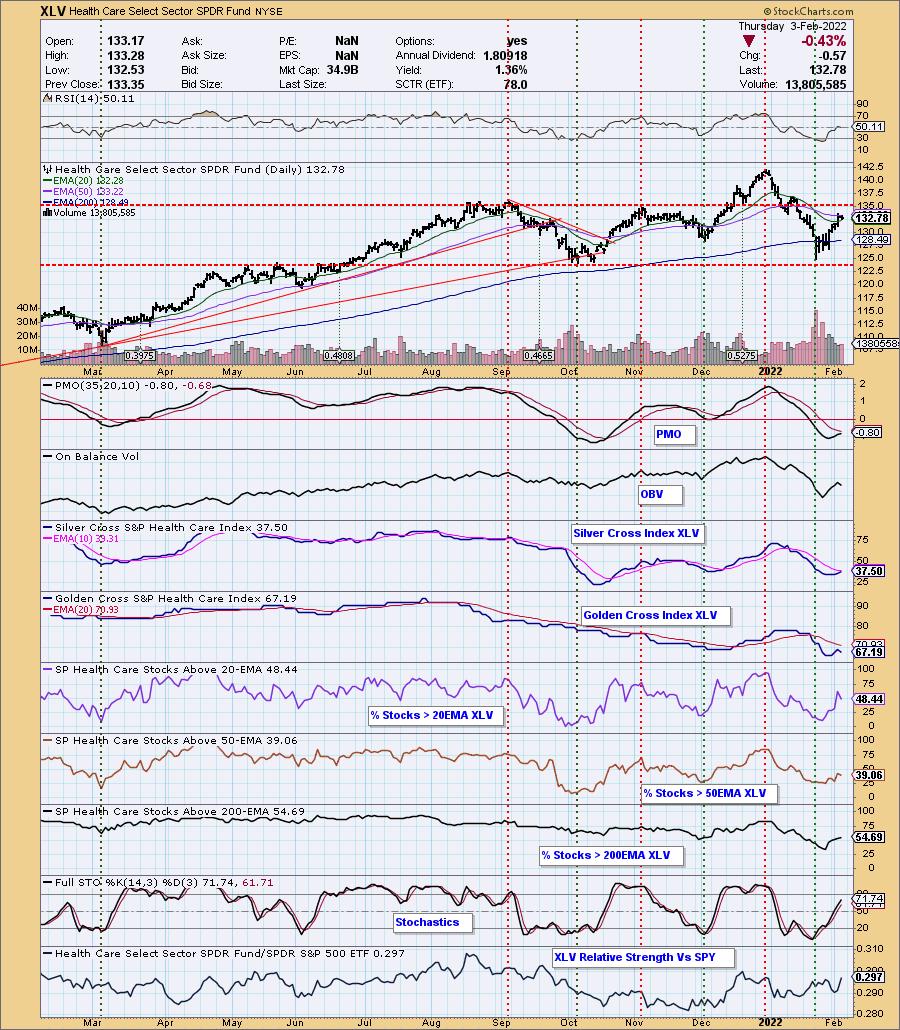
There really are two sectors to watch moving forward. It truly was a tie. I like the participation on XLV. %Stocks > 20/50-day EMAs are higher than the Silver Cross Index (SCI). They saw a tiny bit of deterioration. Relative strength is higher than the previous top and the relative strength line isn't overbought. The problem I have with XLV is it hasn't broken above resistance which is why I'm also including XLP.
Sector #2 to Watch: Consumer Staples (XLP)
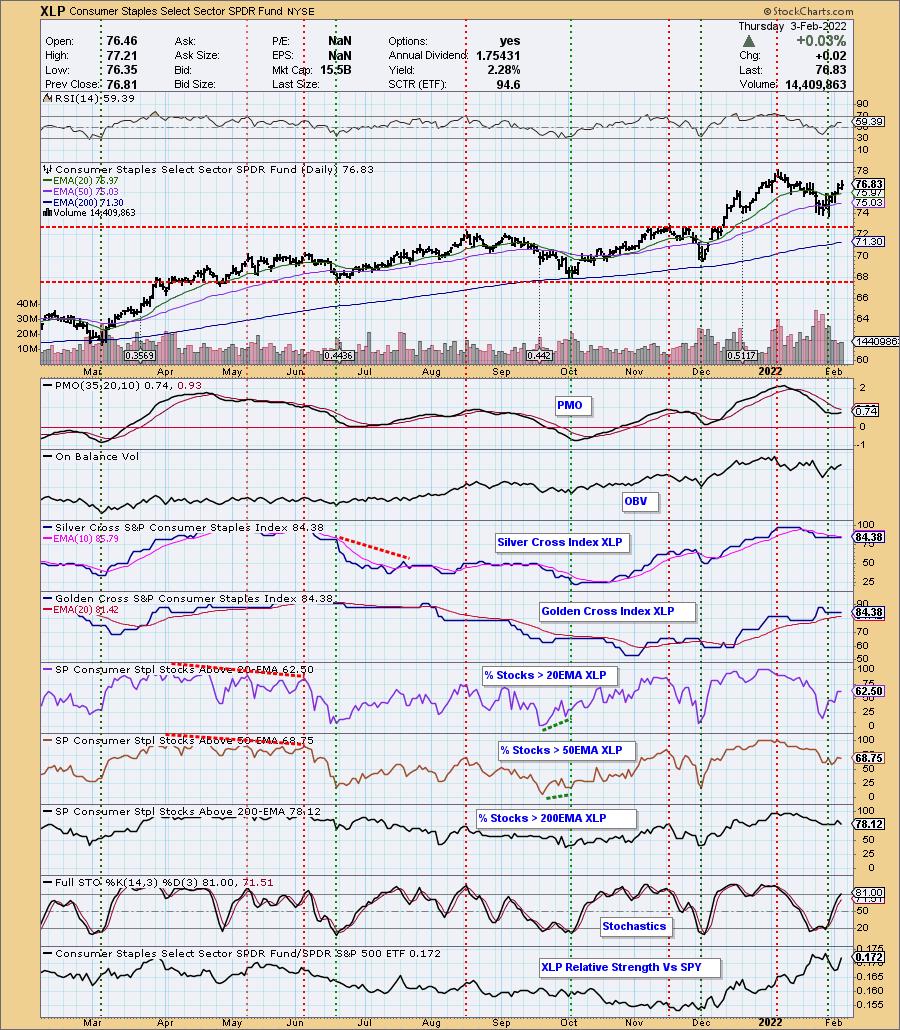
XLP is above support at the August/November highs and it has moved well above the 20/50-day EMAs. Indicators are almost identical to XLV, but participation of stocks > 20/50-day EMAs is less than the SCI. It is at relative strength highs which can be considered "overbought" relative to the SPY. So it comes down to participation (XLV) and price support/resistance (XLP).
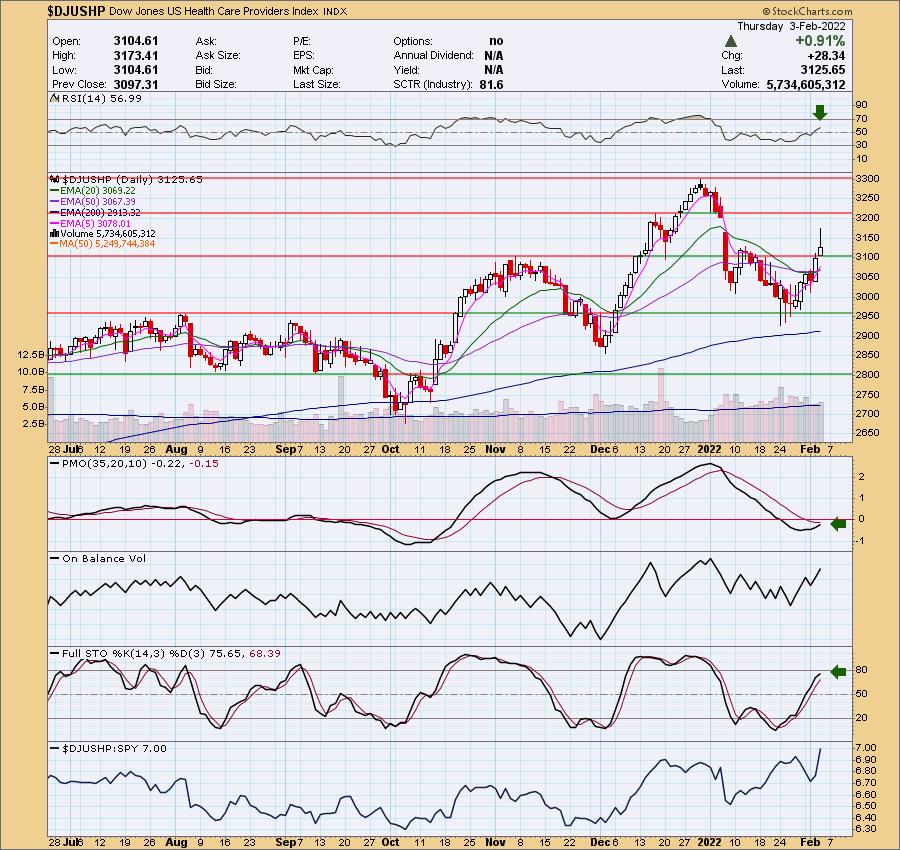
Industry Group to Watch: Food Retailers & Wholesalers ($DJUSFD) & Healthcare Providers ($DJUSHP)
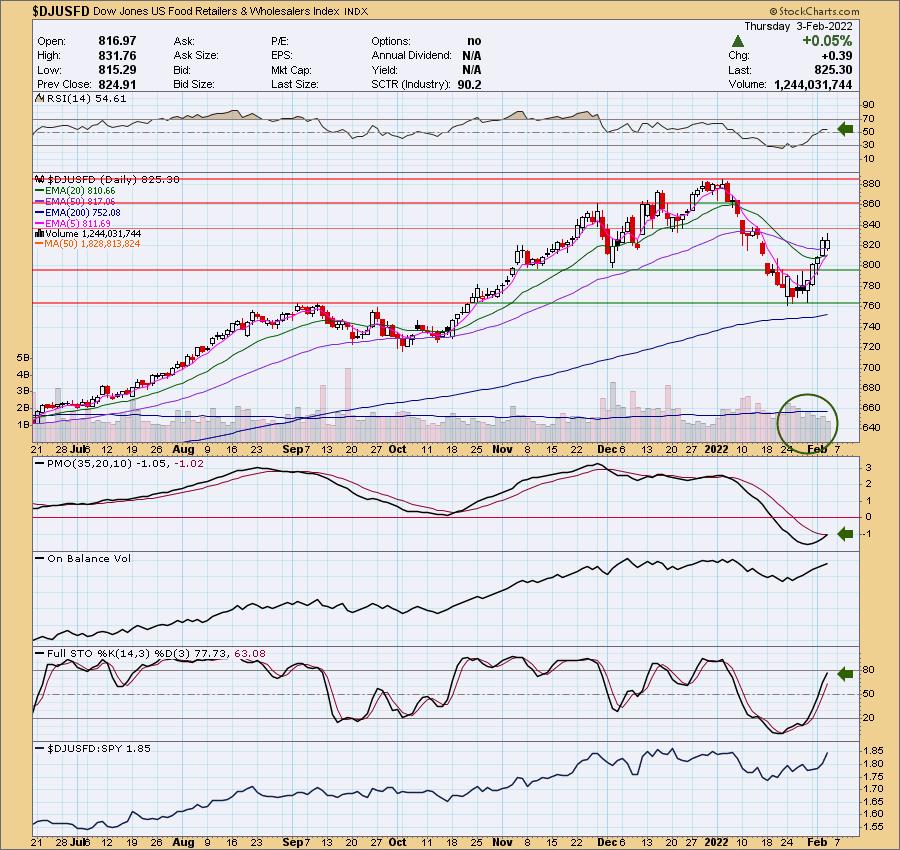
Since I picked two sectors to watch, I'm picking an industry group within each. For Staples, I like the chart for Food Retailers and Wholesalers. Lots of great volume is coming in, the PMO is about to trigger a crossover BUY signal and the RSI is positive. Stochastics also look positive.
In Healthcare sector, I like the Health Care Providers. It's another nice rounded price bottom with breakouts above the key moving averages. Admittedly today's long wick on the candlestick is problematic, it did stay above the November high. Indicators are healthy.
Go to our Sector ChartList on DecisionPoint.com to get an in depth view of all the sectors.
Have a great weekend! The next Diamonds Report is TUESDAY 2/8.
- Erin
erin@decisionpoint.com
Full Disclosure: I'm about 20% exposed to the market.
Watch the latest episode of DecisionPoint with Carl & Erin Swenlin on Mondays 7:00p EST or on the DecisionPoint playlist on the StockCharts TV YouTube channel here!
Technical Analysis is a windsock, not a crystal ball. --Carl Swenlin
NOTE: The stocks reported herein are from mechanical trading model scans that are based upon moving average relationships, momentum and volume. DecisionPoint analysis is then applied to get five selections from the scans. The selections given should prompt readers to do a chart review using their own analysis process. This letter is not a call for a specific action to buy, sell or short any of the stocks provided. There are NO sure things or guaranteed returns on the daily selection of "diamonds in the rough."
Helpful DecisionPoint Links:
DecisionPoint Shared ChartList and DecisionPoint Chart Gallery
Price Momentum Oscillator (PMO)
Swenlin Trading Oscillators (STO-B and STO-V)
(c) Copyright 2021 DecisionPoint.comf