
Yesterday I began presenting high yield stocks which are "value" plays versus "growth". Growth stocks typically reside in aggressive sectors like Technology and Consumer Discretionary. With the NDX losing its PMO BUY signal and the OEX following suit today, growth stocks are very risky right now.
Not surprisingly, reader requests came in heavy on Energy stocks. It was hard to choose from the Energy selections that were sent in, but I was able to narrow it down to four (I included an Auto Parts stock that really is set up nicely).
Yesterday's "Stocks to Review" had some excellent ideas in the Energy sector. I had a few repeats from yesterday's stocks to review as my list narrowed down and it included some of yesterday's stocks. I still think yesterday's stocks look good moving forward as well as the "Stocks to Review" for today.
** IMPORTANT NOTE: I have changed my ChartStyle. It's pretty much the same as always, but I've moved to our "DP GOLD" color (tired of the lavendar/pink) and have added candlesticks to the daily charts since I find I'm following those short-term signals more closely. **
Tomorrow is the Diamond Mine trading room! Register HERE or below. Looking forward to seeing some new faces who joined DecisionPoint.com during our holiday special. If you are able to come in live, I encourage you to use the chat room to bounce ideas and information off each other. It's a unique benefit of the Diamonds community, but it only works if you aren't shy!
If you cannot join us live in the Diamond Mine, the links to recordings are always below. Additionally, feel free to send in your symbol requests and questions via email if you can't be there live. I go through them right before we enter the room and will be sure to cover them.
I was away from my desk this morning. I had planned on adding some Energy stocks to my portfolio, but I didn't have the time to watch my 5-minute candlestick charts for entry. The market is still weak, but I would say Financials and Energy sectors should continue to outperform. I don't know which stocks I will add, but they will very likely come from this week's "Diamonds in the Rough" OR from the week or two before when I emphasized Crude Oil beneficiaries.
Today's "Diamonds in the Rough": AXL, HEP, MUR, PBF and SM.
"Stocks to Review": ENB, UMI, HES, CDEV, RES, KMF, RIO, SHLX, LBRT, HAL and MAC.

RECORDING LINK Thursday (12/30):
Topic: DecisionPoint Diamond Mine THURSDAY (12/30/2021) LIVE Trading Room
Start Time: Dec 30, 2021 09:00 AM
Meeting Recording Link.
Access Passcode: Diamond#30
REGISTRATION FOR 1/7 Diamond Mine:
When: Jan 7, 2022 09:00 AM Pacific Time (US and Canada)
Topic: DecisionPoint Diamond Mine (1/7/2022) LIVE Trading Room
Register in advance for this webinar HERE.
Save the registration confirmation email with login instructions in case Zoom doesn't notify you in time.

Free DP Trading Room (12/27) RECORDING LINK:
Topic: DecisionPoint Trading Room
Start Time: Dec 27, 2021 09:00 AM
Meeting Recording Link.
Access Passcode: Holiday@2
For best results, copy and paste the access code to avoid typos.
Welcome to DecisionPoint Daily Diamonds, wherein I highlight ten "Diamonds in the Rough" per week. These are selected from the results of my DecisionPoint Scans, which search for stocks that could benefit from the trend and condition of the market. Remember, these are not recommendations to buy or sell, but are the most interesting of the stocks that surfaced in my scans. My objective is to save you the work of the initial, tedious culling process, but you need to apply your own analysis to see if these stocks pique your interest as well. There are no guaranteed winners here!
Predefined Scan Results are taken from the StockCharts.com Scan List.
American Axle & Manufac. (AXL)
EARNINGS: 2/11/2022 (BMO)
American Axle & Manufacturing Holdings, Inc. engages in the manufacture, engineering, design, and validation of driveline systems and related components. It operates through the following segments: Driveline and Metal Forming. The Driveline segment consists of axles, drive shafts, power transfer units, rear drive modules, and electric and hybrid driveline products and systems for light trucks, service utility vehicles, crossover vehicles, passenger cars, and commercial vehicles. The Metal Forming segment manufactures axle shafts, ring and pinion gears, differential gears, transmission gears, and shafts and suspension components for original equipment manufacturers (OEMs), and Tier 1 automotive suppliers. The company was founded by Richard E. Dauch on March 1, 1994 and is headquartered in Detroit, MI.
Predefined Scans Triggered: Moved Above Upper Bollinger Band.
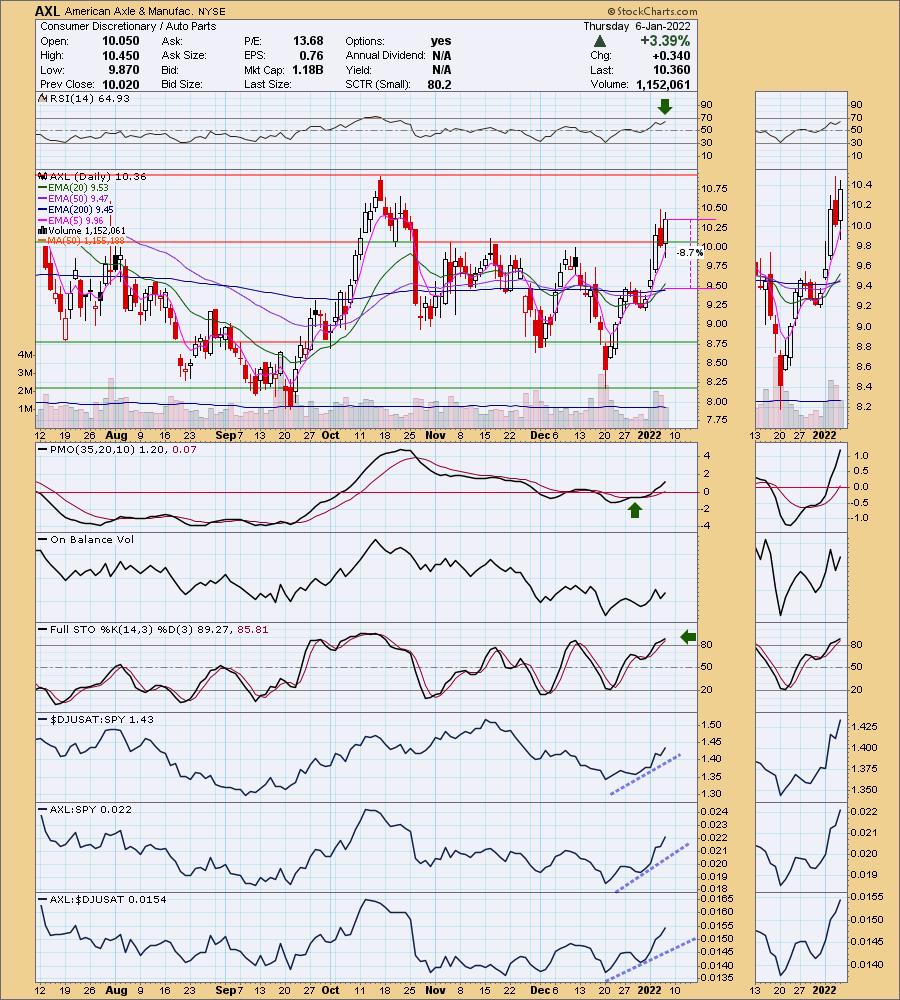
AXL is down -0.10% in after hours trading. This is the only stock not within Energy today. It is in the aggressive Discretionary sector, but the chart was too good to resist and the group itself is outperforming by a mile. On Tuesday AXL broke out above strong overhead resistance. It pulled back in textbook fashion to the breakout point. Today it is resuming its rally. Granted overhead resistance in the short term is arriving soon, but the indicators suggest it won't pose a problem. The RSI is positive and the PMO is now rising above zero on a crossover BUY signal. Stochastics are rising above 80. AXL is a leader within this group right now as it is outperforming its group which is already flying high. The stop is really deep, but lines up below the 20-day EMA.
The weekly chart is showing new momentum as the weekly PMO is now rising toward a crossover BUY signal. The weekly RSI is positive and rising. I would just note that the stock is already up over 11% this week, so it may require another pullback. I've set an upside target at the 2021 highs.

Holly Energy Partners LP (HEP)
EARNINGS: 2/22/2022 (BMO)
Holly Energy Partners LP engages in the business of operating a system of petroleum product and crude pipelines, storage tanks, distribution terminals, loading rack facilities and refinery processing units. It operates through Pipelines & Terminals and Refinery Processing Unit segments. The company was founded in 2004 and is headquartered in Dallas, TX.
Predefined Scans Triggered: Moved Above Upper Keltner Channel, Moved Above Ichimoku Cloud and P&F Low Pole.
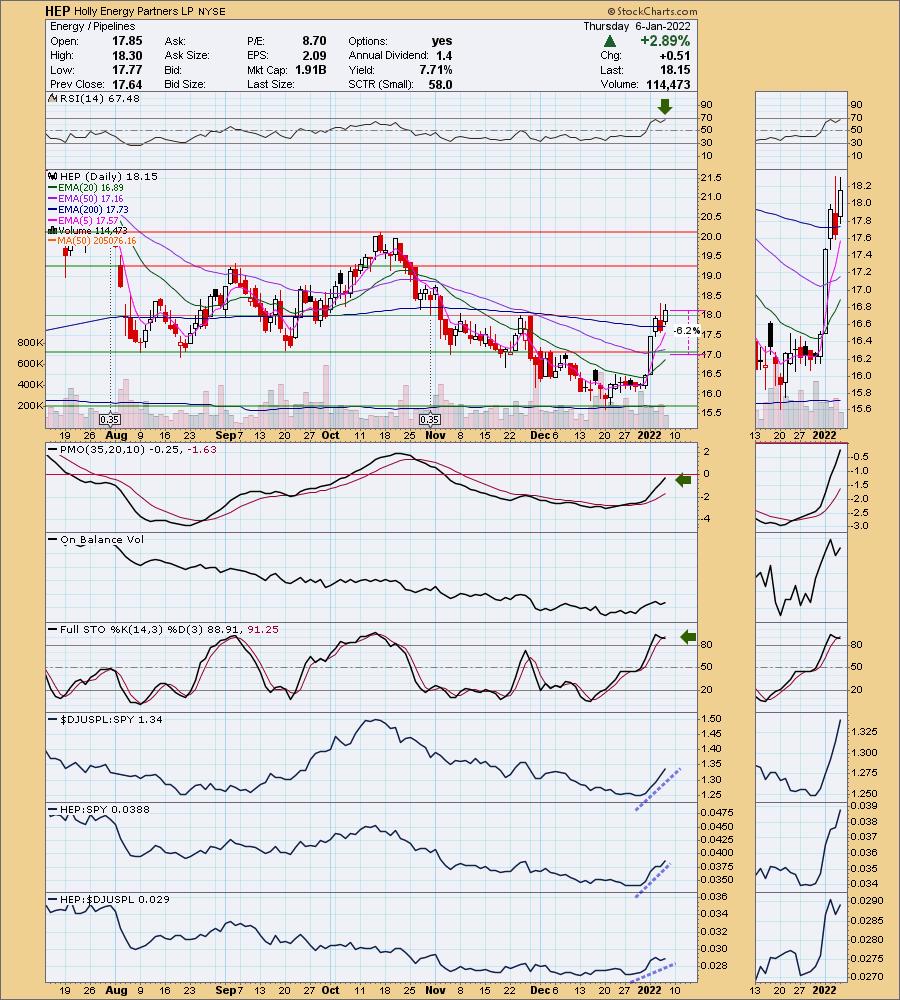
HEP is up +2.75% in after hours trading. I am partial to the Pipelines industry group and this one is on my list of possibles for my portfolio. Price has broken above the 200-day EMA this week, as well as overhead resistance at the late November top. The indicators are very bullish. The RSI is positive and rising, the PMO is rising on an oversold crossover BUY signal and Stochastics are oscillating above 80. Relative strength for this industry group is taking off and HEP is one of the leaders in the group based on the rising relative strength line against the industry group. The stop doesn't have to be set deep (something that really attracts me right now). There's an obvious support level at the August/September lows, so I set it just below.
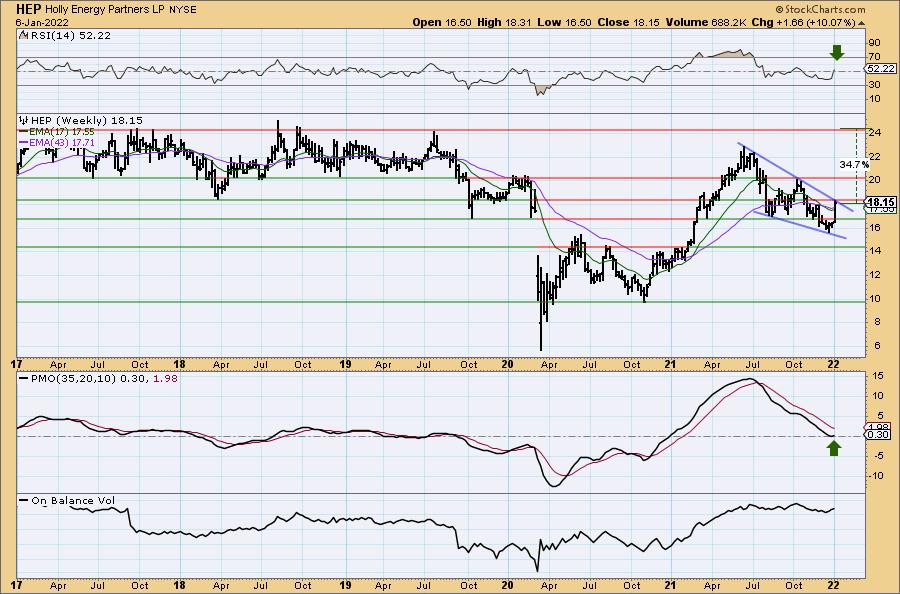
There is a bullish falling wedge on the weekly chart. Price hasn't confirmed the pattern with a breakout yet, but based on the very bullish weekly indicators, it should. The weekly RSI just hit positive territory and the weekly PMO has turned up just above the zero line.
Murphy Oil Corp. Holding Co. (MUR)
EARNINGS: 1/27/2022 (BMO)
Murphy Oil Corp. is a holding company, which engages in the exploration and production of oil and natural gas. It operates through the Exploration and Production and Corporate and Other segment. The Exploration and Production segment includes the United States, Canada, and all other countries. The Corporate and Other segment focuses on interest income, other gains and losses, interest expense, and unallocated overhead. The company was founded by Charles H. Murphy Jr. in 1950 and is headquartered in Houston, TX.
Predefined Scans Triggered: P&F Spread Triple Top Breakout, Moved Above Upper Bollinger Band, P&F Double Top Breakout, Filled Black Candles and Moved Above Upper Keltner Channel.
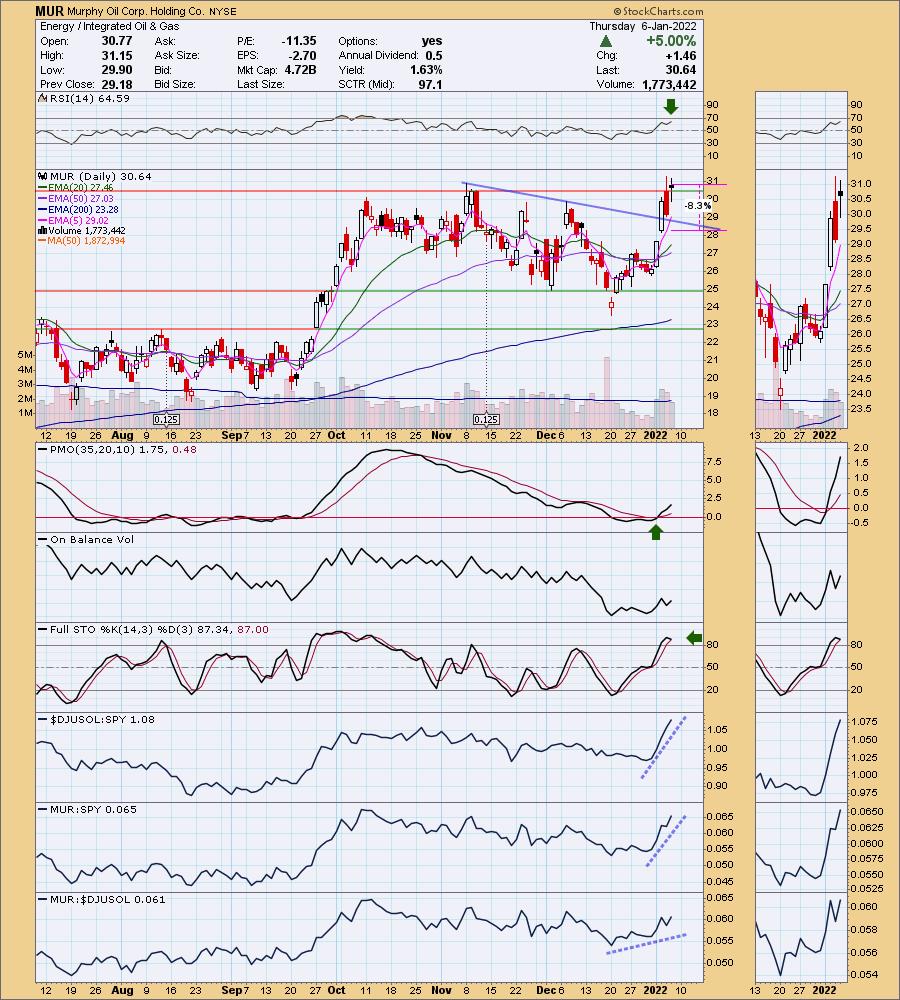
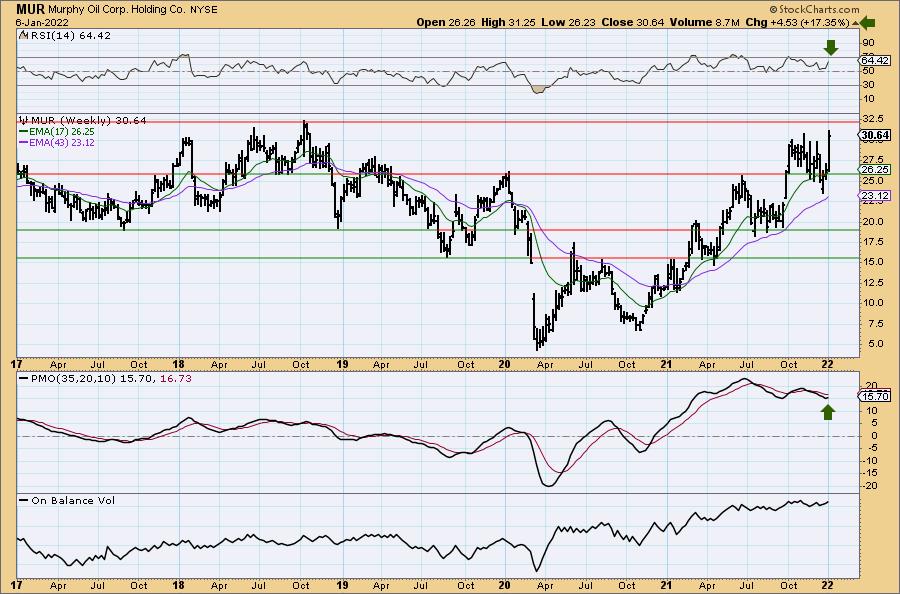
MUR is down -1.11% in after hours trading, shaving some of today's 5% gain. Hopefully it won't negate today's breakout, but we do have a filled black candlestick and those are bearish for the next day. I covered MUR on February 23rd 2021. The position is still open as the stop never hit and is up +88.8%. The RSI is positive and rising, the PMO is rising after a crossover BUY signal triggered at the zero line and Stochastics are above 80 (although tipping over a little). Relative performance attracted me to this chart as I am impressed with MUR's rising relative strength against the group and particularly the SPY. The stop unfortunately needs to be set deep due to the price rise this week. I set it at gap support.
We have another strong weekly chart with a positive and rising RSI and a newly rising weekly PMO. I used a monthly chart to determine the upside target just above $45.

PBF Energy Inc. (PBF)
EARNINGS: 2/10/2022 (BMO)
PBF Energy, Inc. engages in the operation of a petroleum refiner and supplies unbranded transportation fuels, heating oil, petrochemical feed stocks, lubricants, and other petroleum products in the United States. It operates through the following segments: Refining and Logistics. The Refining segment refines crude oil and other feed stocks into petroleum products. The Logistics segment owns, leases, operates, develops, and acquires crude oil and refined petroleum products terminals, pipelines, storage facilities, and logistics assets. The company was founded on March 1, 2008 and is headquartered in Parsippany, NJ.
Predefined Scans Triggered: Elder Bar Turned Green, Moved Above Upper Keltner Channel, Moved Above Upper Bollinger Band, Moved Above Upper Price Channel, P&F Double Top Breakout and P&F Bearish Signal Reversal.
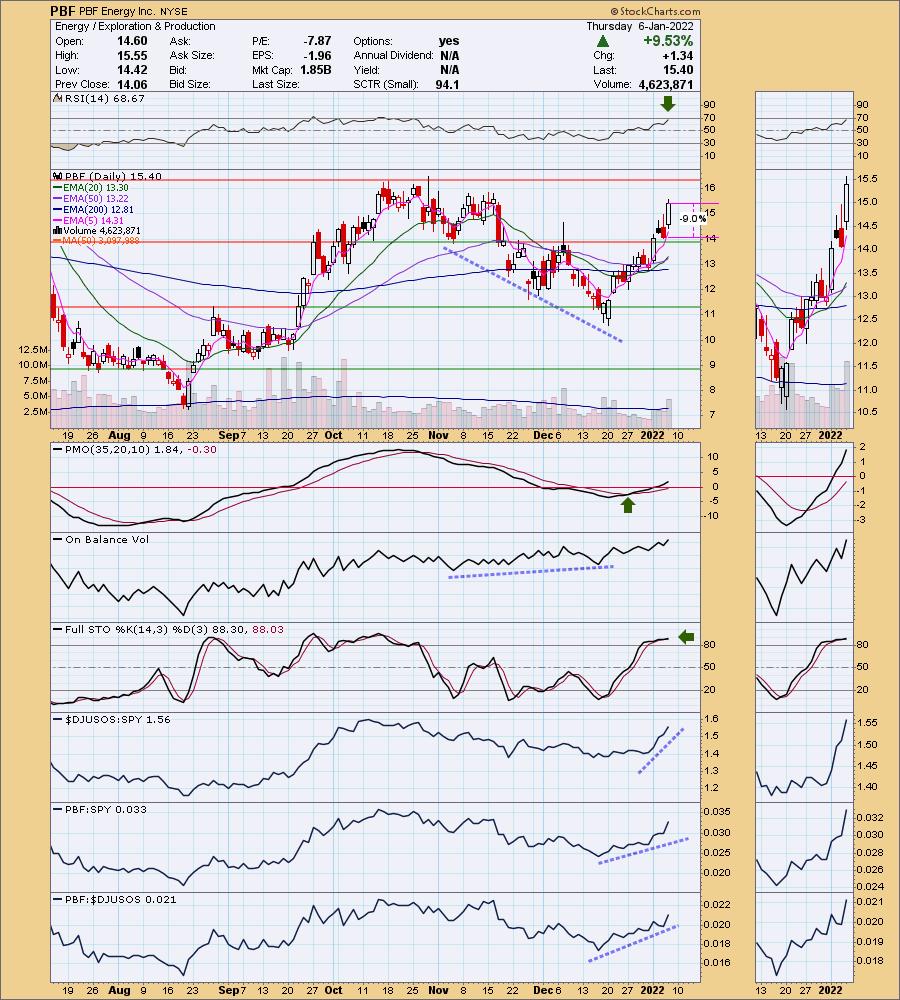
PBF is up +0.65% in after hours trading. I covered PBF on May 6th 2021. The position was stopped out on the correction that began in late June 2021. We see a strong OBV positive divergence that led into this rally which suggests to me that it will continue past overhead resistance at the October top. Today saw an IT Trend Model "Silver Cross" BUY signal as the 20-day EMA crossed above the 50-day EMA. The PMO is on an oversold crossover BUY signal. The RSI is positive and Stochastics are rising above 80.
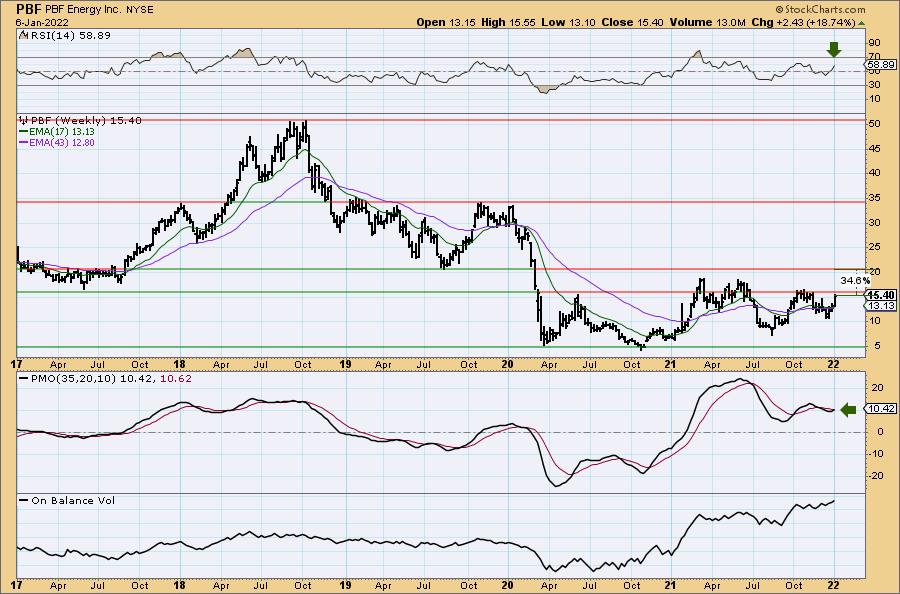
The weekly chart is favorable with a newly positive weekly RSI and a nearing weekly PMO crossover BUY signal. If I had to complain, I don't like that we are seeing rising OBV tops and declining price tops. That's a "reverse" divergence which is bearish. It tells us that lots and lots of volume came in, but price didn't make new highs. Price should follow volume and when it doesn't we have to be careful. The upside target is at the 2019 low.
SM Energy Co. (SM)
EARNINGS: 2/16/2022 (AMC)
SM Energy Co. is an independent energy company, which is engages in the acquisition, exploration, development, and production of crude oil, natural gas and natural gas liquids. Its operations are located in Midland Basin and South Texas. The company was founded in 1908 and is headquartered in Denver, CO.
Predefined Scans Triggered: P&F Double Top Breakout.
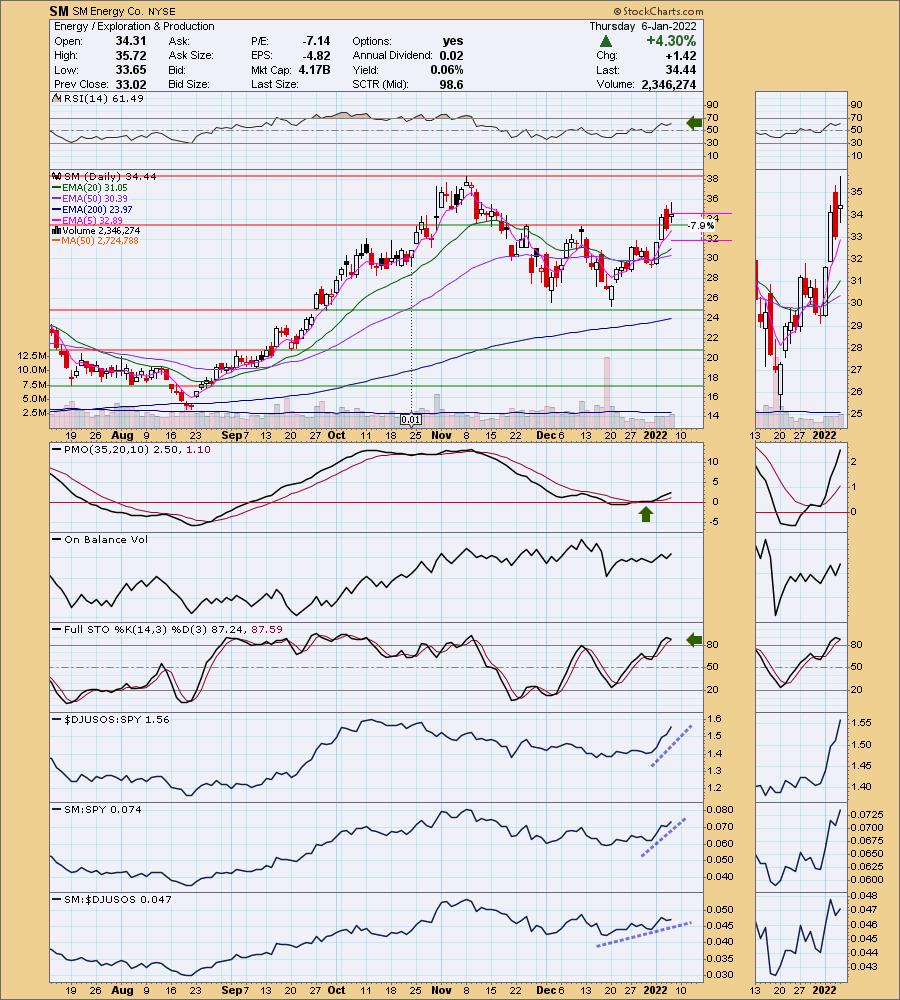
SM is up +0.81% in after hours trading. We have a bullish double-bottom and price has now confirmed the pattern with a breakout above the December high or confirmation line. The RSI is positive and not overbought. The PMO is rising on an oversold BUY signal that occurred just above the zero line. Stochastics are above 80. Relative strength studies are bullish with SM rising against both the group and the SPY. The stop is set at the late December top.
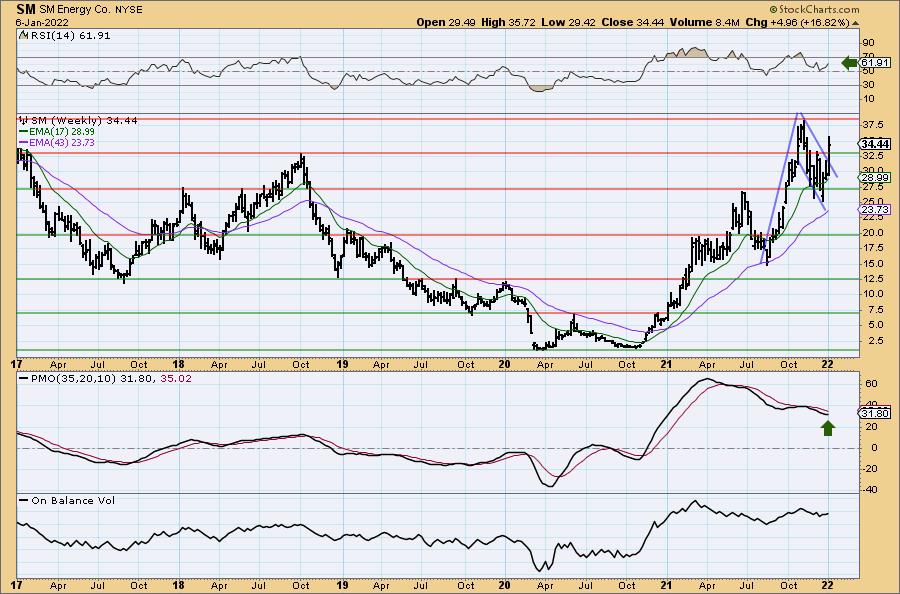
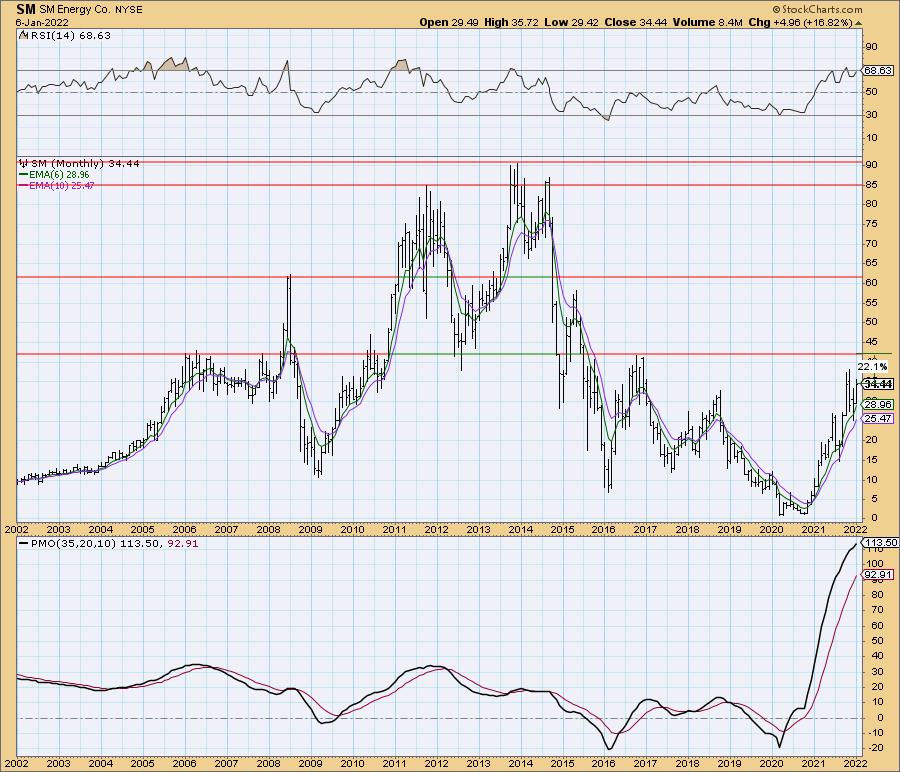
We have very large bull flag on the weekly chart. I love that price has not only confirmed the pattern with a breakout, but it has broken above resistance at the 2018 high. The weekly RSI is positive and rising and the weekly PMO has bottomed. Using the monthly chart I've set an upside target at about $42.50.
Don't forget, on Thursdays I look at reader-requested symbols, click HERE to shoot me an email. I read every email I receive and try to answer them all!
Current Market Outlook:
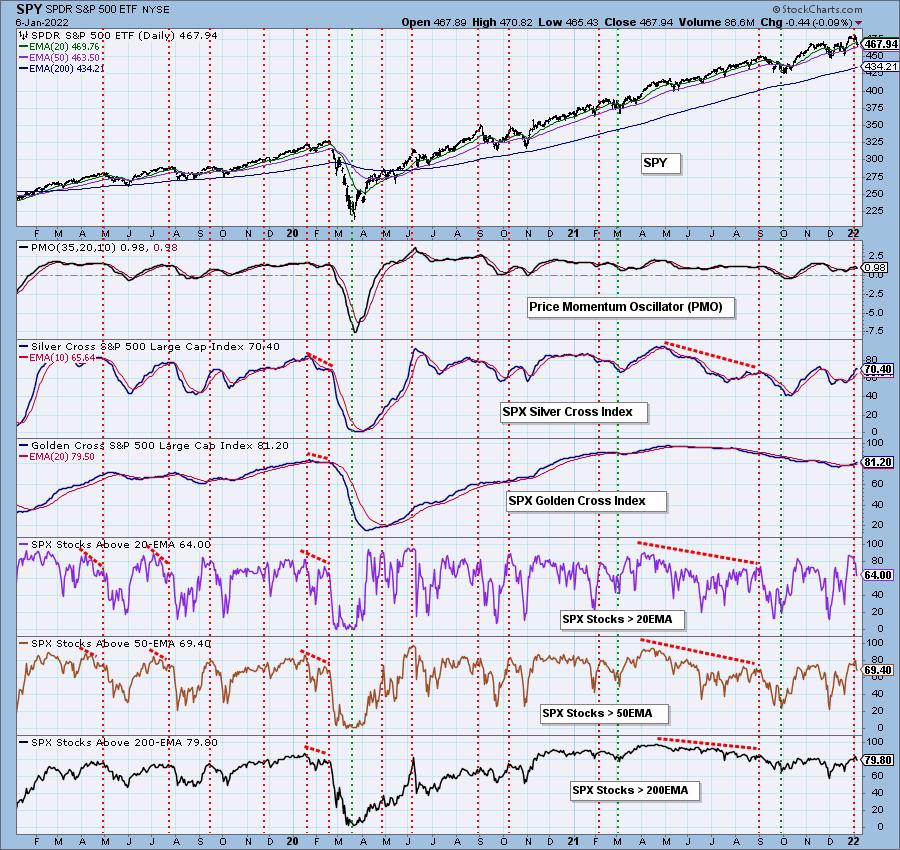
Market Environment: It is important to consider the odds for success by assessing the market tides. The following chart uses different methodologies for objectively showing the depth and trend of participation for intermediate- and long-term time frames.
- The Silver Cross Index (SCI) shows the percentage of SPX stocks on IT Trend Model BUY signals (20-EMA > 50-EMA)
- The Golden Cross Index (GCI) shows the percentage of SPX stocks on LT Trend Model BUY signals (50-EMA > 200-EMA)
Don't forget that as a "Diamonds" member, you have access to our GCI/SCI curated ChartList on DecisionPoint.com. You'll find it under "Members Only" links on the left side on the Blogs and Links Page.
Here is the current chart:
Full Disclosure: I'm 10% invested and 90% is in 'cash', meaning in money markets and readily available to trade with. As noted in the intro, I am looking to expand my exposure in Energy and Financials. I will likely buy from this week's "Diamonds in the Rough" or the Crude Oil beneficiary stocks I presented a few weeks ago.
I'm required to disclose if I currently own a stock and/or may buy it within the next 72 hours.
Happy Charting!
- Erin
"Technical Analysis is a windsock, not a crystal ball." - Carl Swenlin
(c) Copyright 2022 DecisionPoint.com
Watch the latest episode of DecisionPoint with Carl & Erin Swenlin on Mondays 7:00p EST or on the DecisionPoint playlist on the StockCharts TV YouTube channel here!
NOTE: The stocks reported herein are from mechanical trading model scans that are based upon moving average relationships, momentum and volume. DecisionPoint analysis is then applied to get five selections from the scans. The selections given should prompt readers to do a chart review using their own analysis process. This letter is not a call for a specific action to buy, sell or short any of the stocks provided. There are NO sure things or guaranteed returns on the daily selection of "Diamonds in the Rough."
Helpful DecisionPoint Links:
DecisionPoint Shared ChartList and DecisionPoint Chart Gallery
Price Momentum Oscillator (PMO)
Swenlin Trading Oscillators (STO-B and STO-V)
For more links, go to DecisionPoint.com