
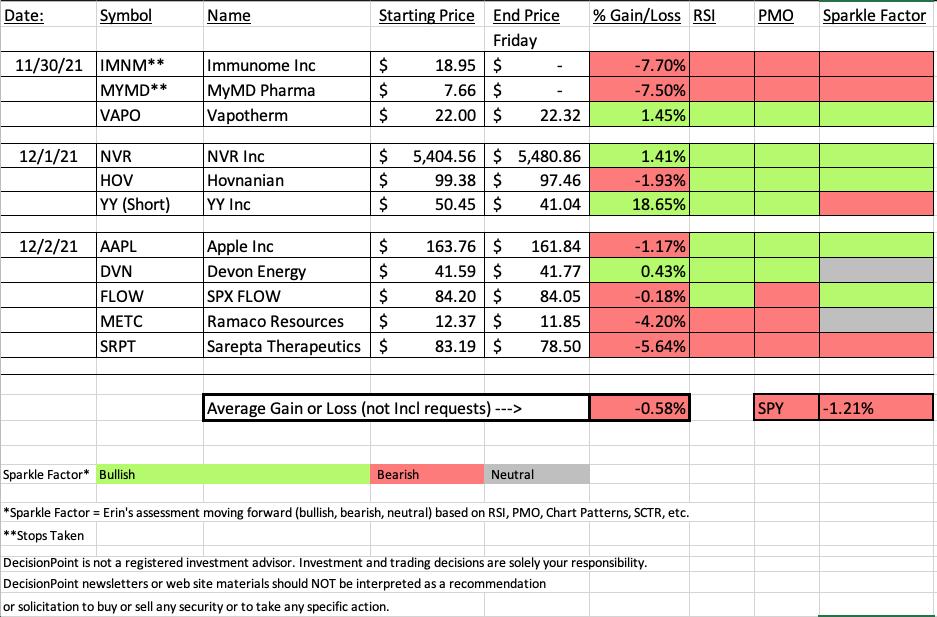
Rough week for the market. Even though the Diamonds finished down (-0.58%), the SPY had a worse week (-1.21%). The big winner this week was the only short presented. It turned out to be spectacular. I picked it on Wednesday and as of today this short position was profitable at 18.65%.
You will notice that I have a bearish "Sparkle Factor" on this short (YY). Don't be confused. I'll talk more about it below, but ultimately I see a possible 6%+ gain available on this short position moving forward given very strong support near all-time lows that are about to be reached.
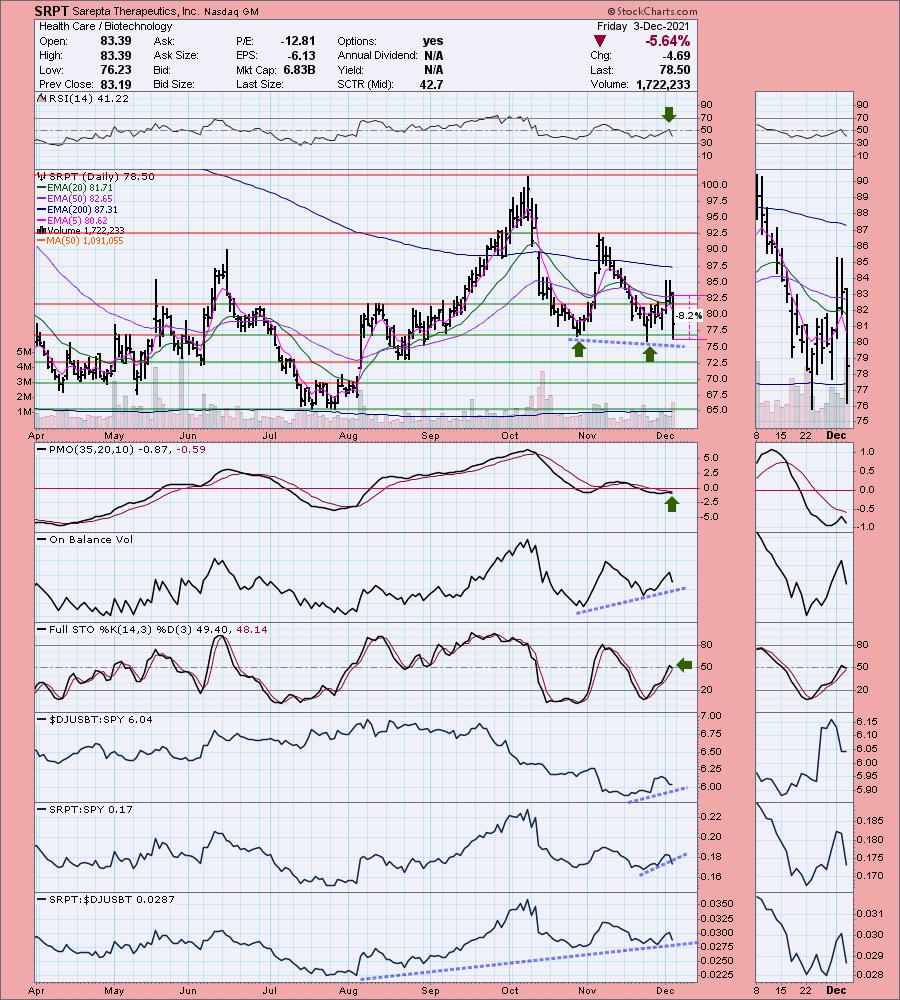
The biggest loser (not counting the two positions that were stopped out) is SRPT... the one chart this week that I loved... I presented it yesterday and today it dropped -5.64%. The stop wasn't hit, but I'm not liking how this one reversed so strongly. I'll talk more about it below.
Limiting exposure is still smart right now. I am at 10% exposure and will likely remain there given the positions I still have open are mostly defensive buy/hold type investments. Play defense. Don't ride a losing position down further. I would also avoid adding to losing positions. The market is still very vulnerable, especially in the intermediate term.
Hope everyone has great weekend! Get your rest, next week promises to be just as volatile. The next Diamonds report will be on Tuesday of next week.

RECORDING LINK Wednesday (12/3):
Topic: DecisionPoint Diamond Mine (12/3/2021) LIVE Trading Room
Start Time: Dec 3, 2021 09:00 AM
Meeting Recording Link.
Access Passcode: December*3
REGISTRATION FOR Friday 12/10 Diamond Mine:
When: Dec 10, 2021 09:00 AM Pacific Time (US and Canada)
Topic: DecisionPoint Diamond Mine (12/10/2021) LIVE Trading Room
Register in advance for this webinar HERE.
Save the registration confirmation email with login instructions in case Zoom doesn't notify you in time.

Free DP Trading Room (11/22) RECORDING LINK:
Topic: DecisionPoint Trading Room
Start Time: Nov 29, 2021 08:59 AM
Meeting Recording Link.
Access Passcode: November#29
For best results, copy and paste the access code to avoid typos.
A few items about the spreadsheet: I've put on the spreadsheet whether the RSI is positive (green) or negative (red). The PMO column tells you if it is rising (green) or falling (red). Finally I've added my own "Sparkle Factor" that gives you my assessment going forward, bullish (green), bearish (red) or neutral (gray). The Sparkle Factor is basically my thoughts on whether I expect it to rise or fall. A neutral means it could really go either way so it could be added to a watch list. If you're in a stock I consider "neutral" going forward, the ball is in your court.
Darling:
YY Inc. (YY) - Short
EARNINGS: 3/24/2022 (AMC)
JOYY, Inc. engages in managing a communication social platform, which enables users to join real-time online group activities through voice, text, and video. Its services include music and entertainment, online games, online dating, live game broadcasting, online education, and advertising. It operates through following segments: Live Streaming, Online Games, Membership and Others. The Live Streaming segment engages in the sales of in-channel virtual items used on live streaming platforms, including YY Live platform and Huya platform. The Online Games segment engages in the sales of in-game virtual items used for games. The Membership segment engages in the collection of membership subscription fees. The Others segment engages in the online education platform and online advertising and promotion. The company was founded by Xueling Li and Jun Lei in April 2005 and is headquartered in Singapore.
Predefined Scans Triggered: None.
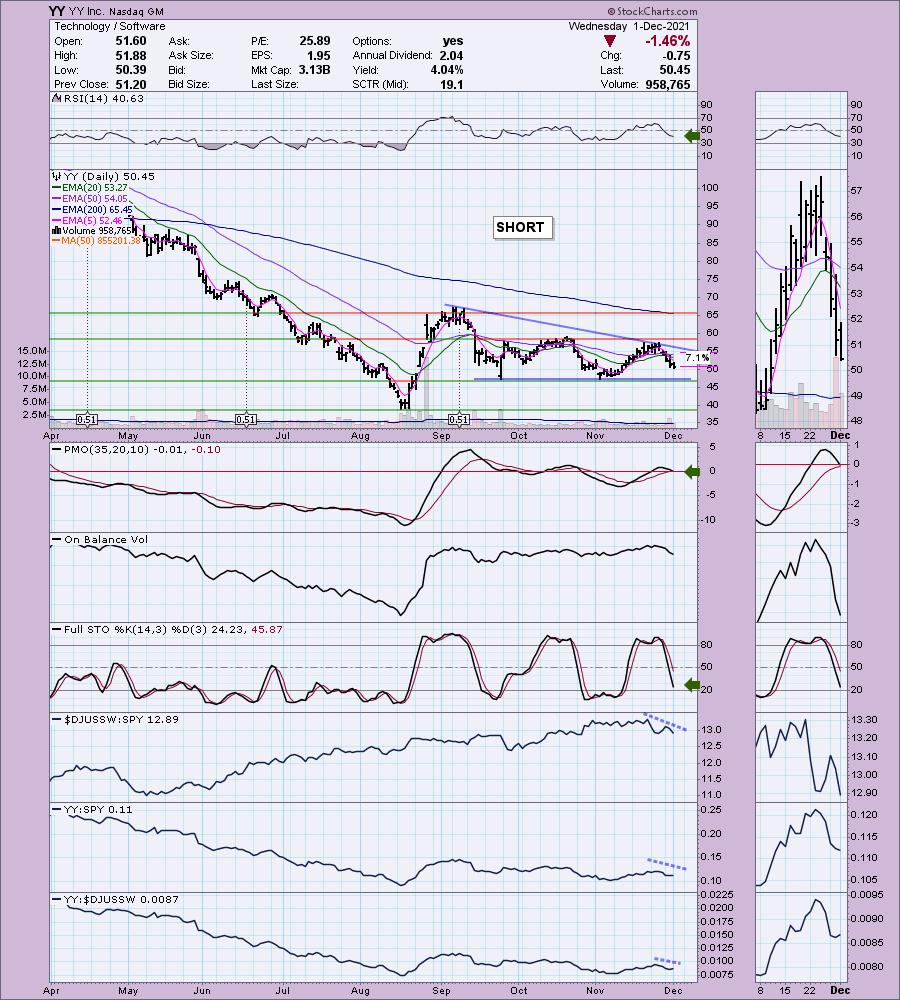
Below are the commentary and chart from Wednesday 12/1:
"YY is up +0.30% in after hours trading. There are a few reasons I opted to present this as a shorting opportunity. First, there is a bearish descending triangle formation that looks textbook. The EMAs are configured negatively with the fastest EMA on the bottom and the slowest on the top. The 20-EMA failed to cross above the 50-EMA. The PMO is about to trigger a SELL signal below the zero line. The RSI is negative and falling. Stochastics are pointed downward and are in negative territory. Relative strength has been trending lower overall for the group and the stock. The stop is set moving upward since this is a short. If it gets past the 50-EMA, it's probably wise to let it go."
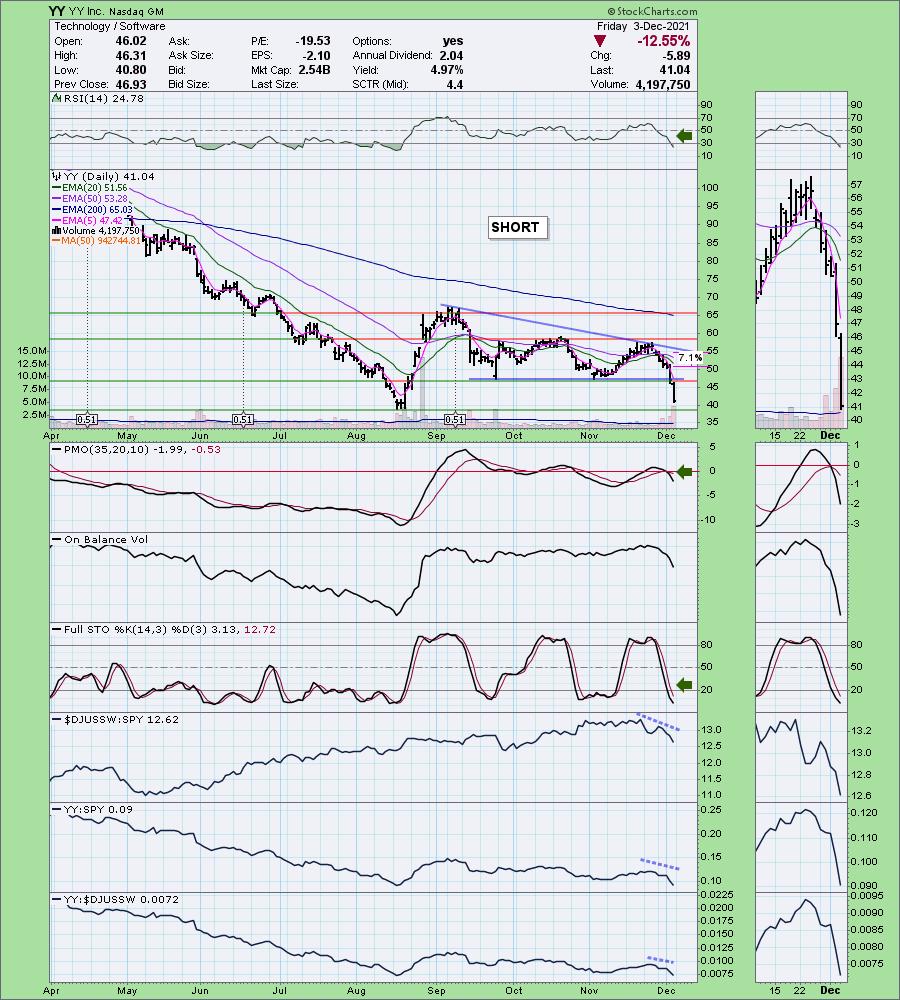
Here is today's chart:
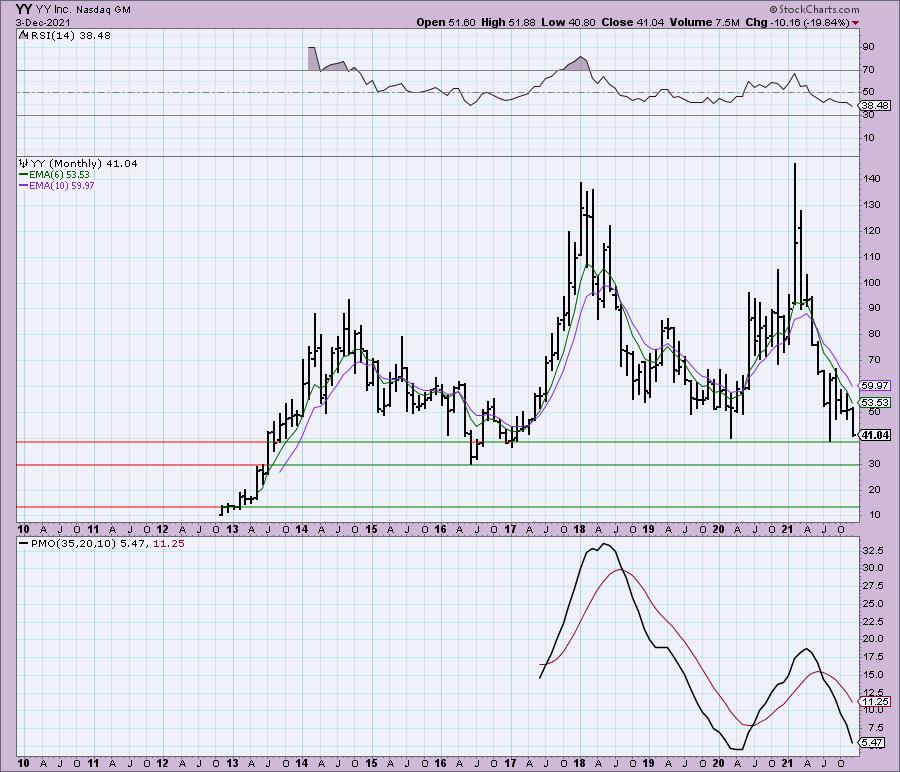
This performed better than expected... almost too well. At this point it is nearing the 2020 lows and that looks like a sturdy level of support. I've put the monthly chart below the daily chart. It has seen lower prices, but I wouldn't count on it hitting them before it rebounds. I suspect the August low will hold and that is only 6% away from the current price. That limits the potential of this investment.
Don't forget, on Thursdays I look at reader-requested symbols, so shoot me an email at erin@decisionpoint.com. I read every email I receive and try to answer them all!
Dud:
Sarepta Therapeutics, Inc. (SRPT)
EARNINGS: 2/28/2022 (AMC)
Sarepta Therapeutics, Inc. is a commercial-stage biopharmaceutical company, which is engaged in the discovery and development of therapeutics for the treatment of rare diseases. The company was founded on July 22, 1980 and is headquartered in Cambridge, MA.
Predefined Scans Triggered: Bullish MACD crossovers.
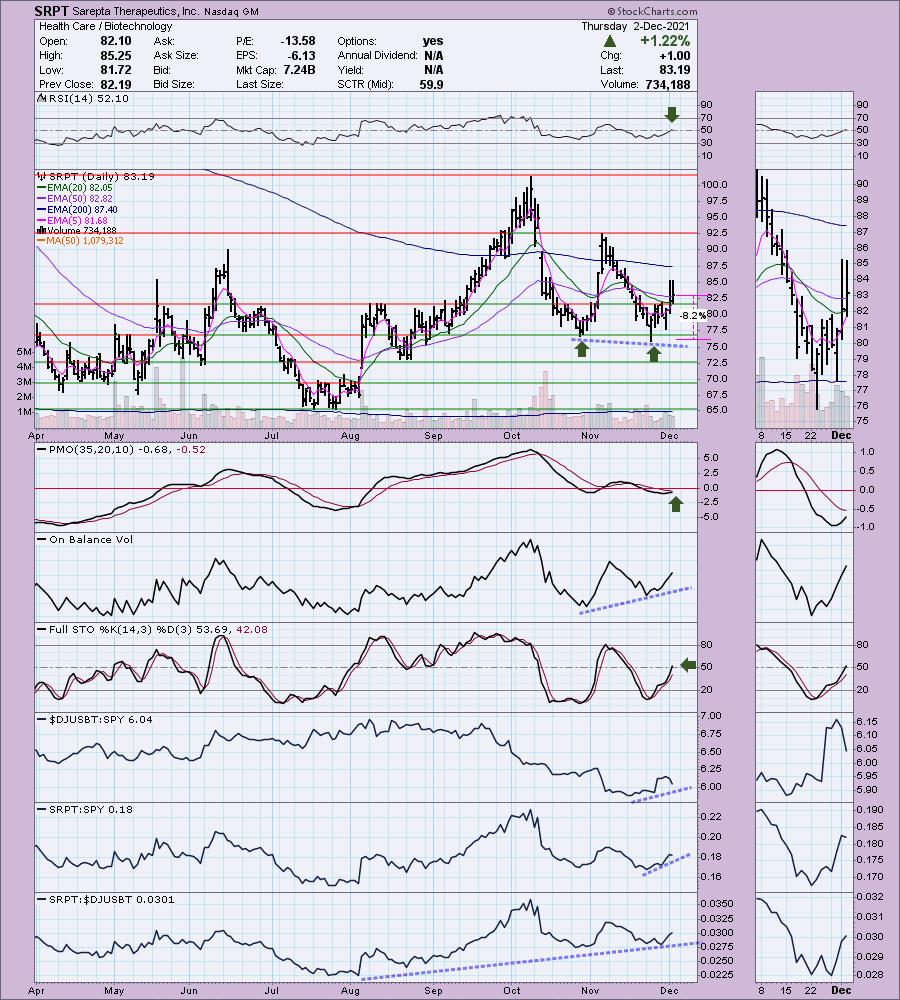
Below are the commentary and chart from yesterday (12/2):
"SRPT is up +0.91% in after hours trading. This is my pick for the day. I really like this chart. It's very tempting, but I'm sticking with not expanding my exposure just yet. Every element I look for on a chart is here. We have a beautiful double-bottom pattern developing. The RSI and Stochastics just entered positive territory. There is a positive OBV divergence. Relative strength studies look pretty good, although the group itself is beginning to deteriorate. Biotechs are volatile and sometimes risky so when the market is weak, investors usually leave. The stop is set below the October low."
Below is today's chart:
You can tell from my commentary above that I really liked this one. The chart was beautiful, then today happened. I no longer like it. Certainly it could find support where it is, but that was some pretty heavy selling we saw today. The RSI is now back in negative territory and the PMO topped below its signal line which is especially bearish. I don't see it as a shorting opportunity because it could bounce here. I just question the upside potential right now.
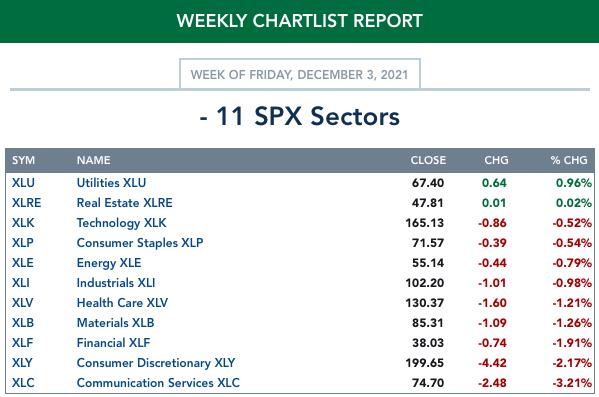
THIS WEEK's Sector Performance:
Since it is not technically the end of the week for trading, I don't have the weekly sector performance report. Below is today's results and performance.
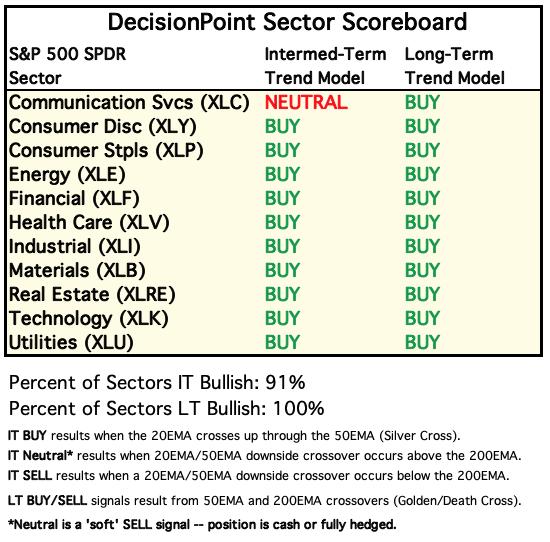
DecisionPoint Sector Scoreboard (Mechanical Trend Model Signals):
Click Here to view Carl's annotated Sector ChartList!
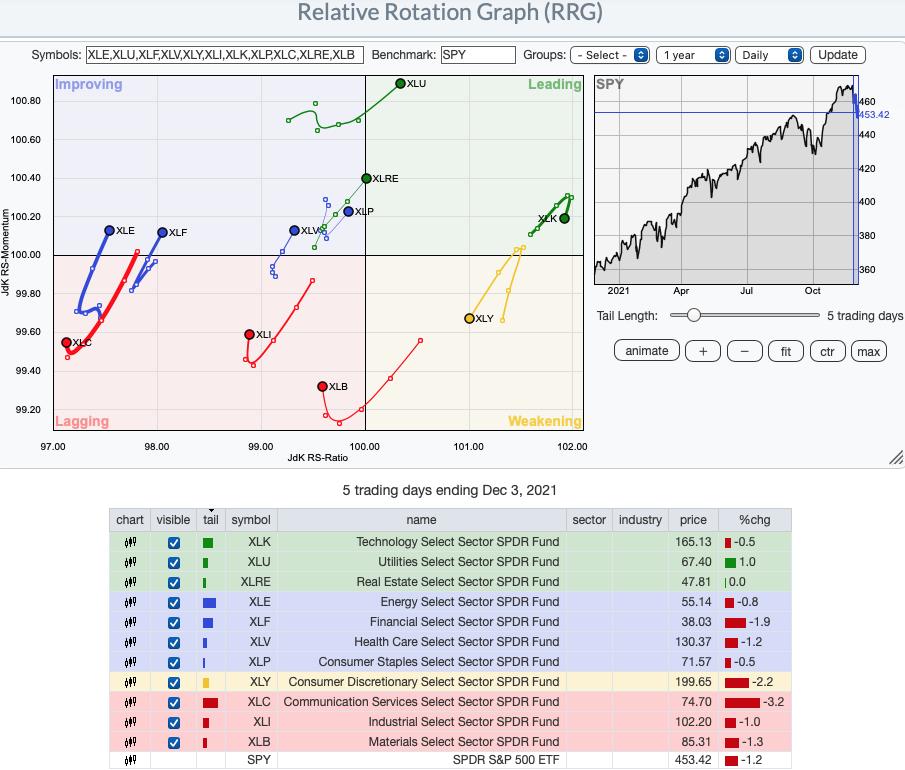
Short-term RRG: Short-term, XLU and XLRE look the healthiest. XLK is still in Leading, but its now moving in the bearish southwest heading along with XLY. XLP should hit leading soon and XLV looks alright as well. XLE and XLF returned to the Improving category. The other sectors are in Lagging, but all of them are hooking around.
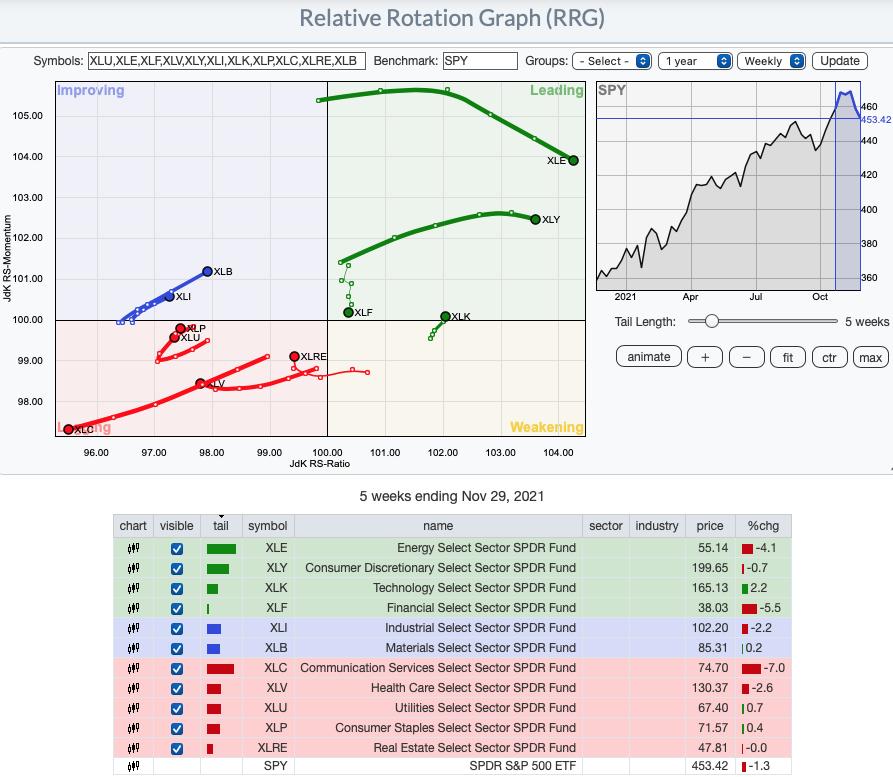
Intermediate-Term RRG: XLK, XLI and XLB look the most interesting on the intermediate-term RRG as they are traveling in the bullish northeast direction and are either in Leading or Improving. XLC is the laggard and is getting worse. Definitely would avoid this sector. XLU and XLP look interesting--they should enter Improving soon. XLV is attempting to turn it around, but is still traveling west. XLRE is headed toward Improving, but still has some ground to cover to get there.
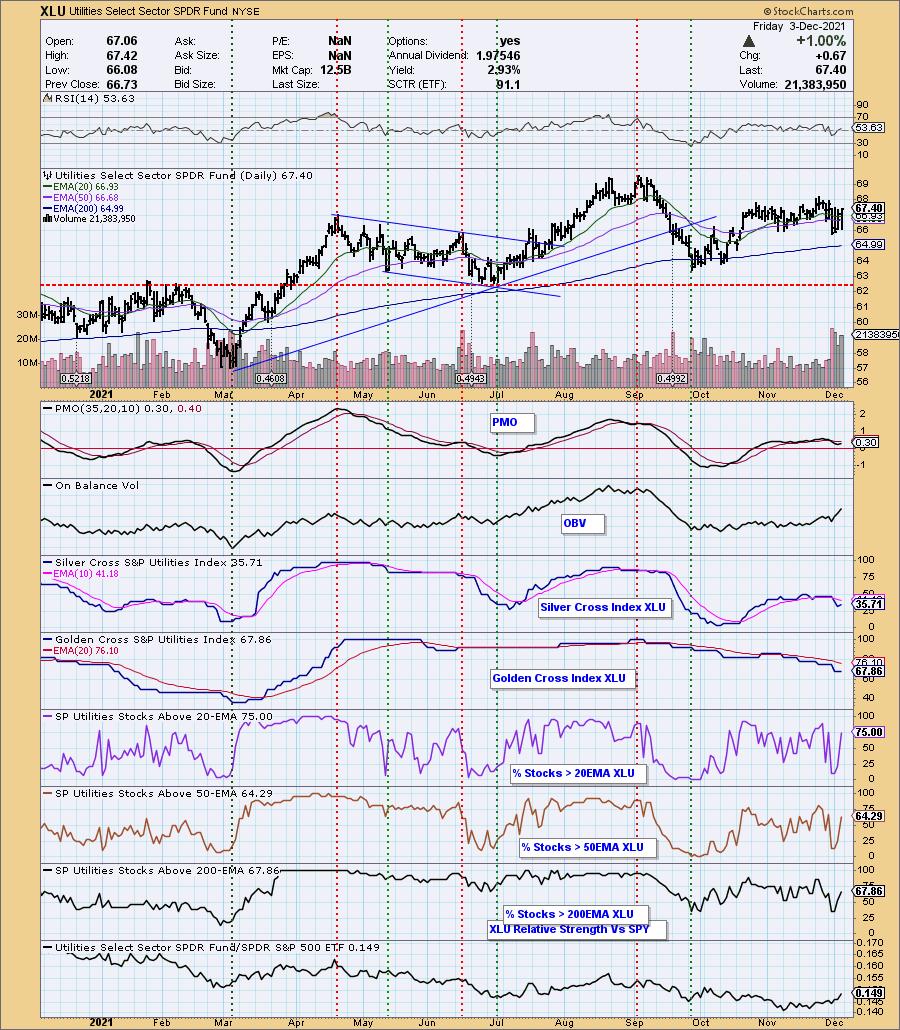
Sector to Watch: Utilities (XLU)
Participation shot through the roof today giving XLU a strong bullish bias. Price action is less than impressive, but now the PMO is turning up and the RSI is now positive. Positive volume is coming in as money begins to rotate to defensive areas of the market. Today's runner-up was XLP which also saw an improvement in participation, the bias is now bullish on XLP, but participation isn't as strong as on XLU.
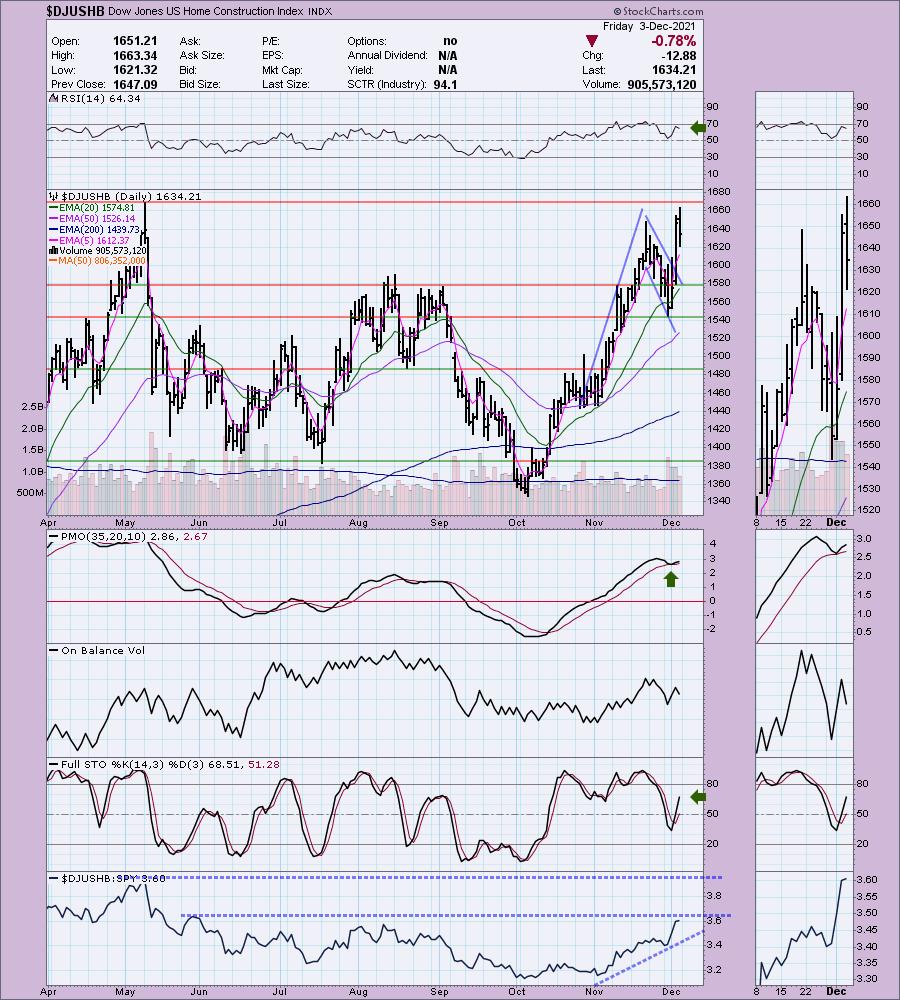
Industry Group to Watch: Home Construction ($DJUSHB)
Multiutilities was a close second since it was in the "Sector to Watch", but Home Builders started to breakout yesterday from a bullish flag formation. They pulled back today after reaching overhead resistance at the May top. The RSI is positive and not overbought and the PMO has a very bullish bottom above the signal line. Relative strength is rising, but we are getting ready to test relative highs. I believe we will see them do well, but they have bearish market forces working against them right now.
Go to our Sector ChartList on DecisionPoint.com to get an in depth view of all the sectors.
Technical Analysis is a windsock, not a crystal ball.
Have a great weekend & Happy Charting! The next Diamonds Report is Tuesday 12/7.
- Erin
erin@decisionpoint.com
Full Disclosure: I'm about 10% exposed to the market.
Watch the latest episode of DecisionPoint with Carl & Erin Swenlin on Mondays 7:00p EST or on the DecisionPoint playlist on the StockCharts TV YouTube channel here!
NOTE: The stocks reported herein are from mechanical trading model scans that are based upon moving average relationships, momentum and volume. DecisionPoint analysis is then applied to get five selections from the scans. The selections given should prompt readers to do a chart review using their own analysis process. This letter is not a call for a specific action to buy, sell or short any of the stocks provided. There are NO sure things or guaranteed returns on the daily selection of "diamonds in the rough."
Helpful DecisionPoint Links:
DecisionPoint Shared ChartList and DecisionPoint Chart Gallery
Price Momentum Oscillator (PMO)
Swenlin Trading Oscillators (STO-B and STO-V)
(c) Copyright 2021 DecisionPoint.com