
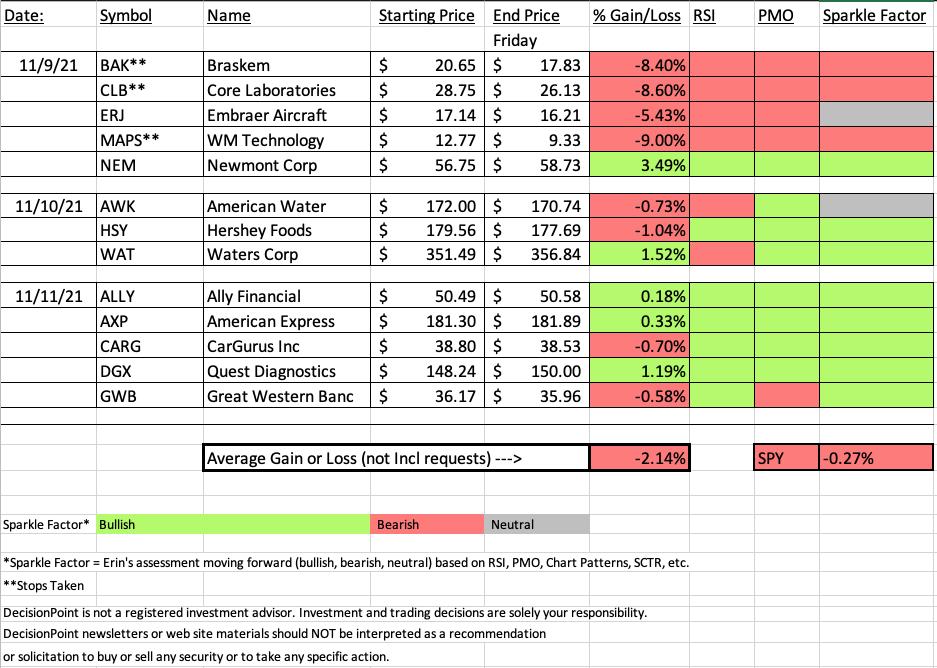
During this morning's Diamond Mine trading room we found that Tuesday's "Diamonds in the Rough" produced only one winner, Newmont Mining (NEM). Gold Miners continue to look good and so it isn't surprising that Tuesday's stand out was also this week's "Darling".
The remainder of Tuesday's picks saw three stops hit (two them hit the next day). I was asked why I presented them and reminded everyone that my report on Tuesday has all of the explanations needed. I did put the biggest loser this week in the report. The chart was showing new momentum, but indicators hadn't ripened. I suppose it is a good lesson that it is usually wise to wait for confirmation of all indicators.
I was also asked about the "Stocks to Review" that I usually list on Tuesdays and Wednesdays. These stocks were the ones that made the grade to be in the report, but I can't present them all so I offer them up for you to consider outside of the "Diamonds in the Rough".
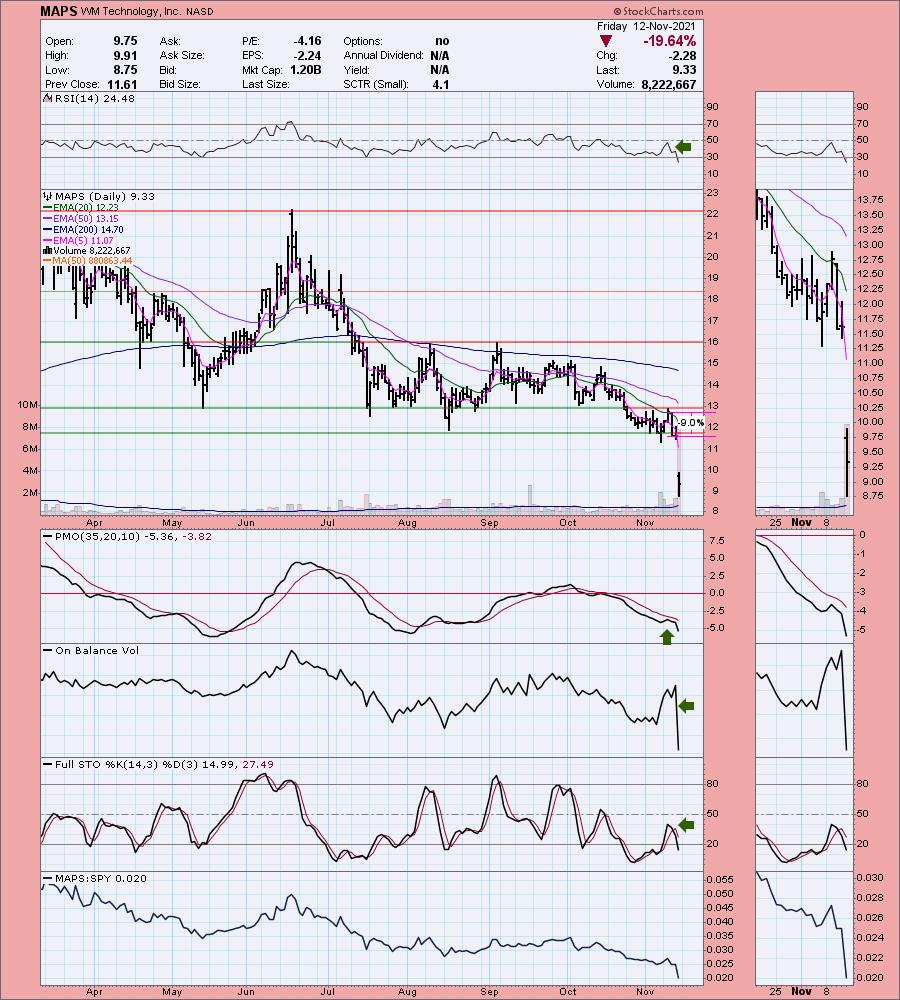
I mentioned this week's "Darling". This week's "Dud" was WM Technology (MAPS), the company that has produced the app "Weed Maps" that allows users to find local dispensaries and delivery services for marijuana. This app and company have potential, but until we see marijuana legalized in more states and particularly on the federal level, it will probably languish a bit longer. However, it can be considered watchlist material for when MJ, the marijuana ETF, begins to show relative strength, this stock will likely benefit.
This link to today's Diamond Mine recording is below as well as the link to sign up for next week's Diamond Mine.
Hope everyone has a terrific weekend!

RECORDING LINK Friday (11/12):
Topic: DecisionPoint Diamond Mine (11/12/2021) LIVE Trading Room
Start Time: Nov 12, 2021 09:00 AM
Meeting Recording Link HERE.
Access Passcode: November@12
REGISTRATION FOR FRIDAY 11/19 Diamond Mine:
When: Nov 19, 2021 09:00 AM Pacific Time (US and Canada)
Topic: DecisionPoint Diamond Mine (11/19/2021) LIVE Trading Room
Register in advance for this webinar HERE.
Save the registration confirmation email with login instructions in case Zoom doesn't notify you in time.

Free DP Trading Room (11/8) RECORDING LINK:
Topic: DecisionPoint Trading Room
Start Time: Nov 8, 2021 09:00 AM
Meeting Recording Link HERE.
Access Passcode: November%8
For best results, copy and paste the access code to avoid typos.
A few items about the spreadsheet: I've put on the spreadsheet whether the RSI is positive (green) or negative (red). The PMO column tells you if it is rising (green) or falling (red). Finally I've added my own "Sparkle Factor" that gives you my assessment going forward, bullish (green), bearish (red) or neutral (gray). The Sparkle Factor is basically my thoughts on whether I expect it to rise or fall. A neutral means it could really go either way so it could be added to a watch list. If you're in a stock I consider "neutral" going forward, the ball is in your court.
Darling:
Newmont Corporation (NEM)
EARNINGS: 2/17/2022 (BMO)
Newmont Corp. is a gold producer, which engages in the production of gold. It operates through the following geographical segments: North America, South America, Nevada, Australia, and Africa. The North America segment consists primarily of carlin, phoenix, twin creeks and long canyon in the state of Nevada and Cripple Creek and Victor in the state of Colorado, in the United States. The South America segment consists primarily of Yanacocha in Peru and Merian in Suriname. The Australia segment consists primarily of Boddington, Tanami and Kalgoorlie in Australia. The Africa segment consists primarily of Ahafo and Akyem in Ghana. The company was founded by William Boyce Thompson on May 2, 1921 and is headquartered in Greenwood Village, CO.
Predefined Scans Triggered: Bullish MACD Crossovers.
Here are the commentary and chart from Tuesday:
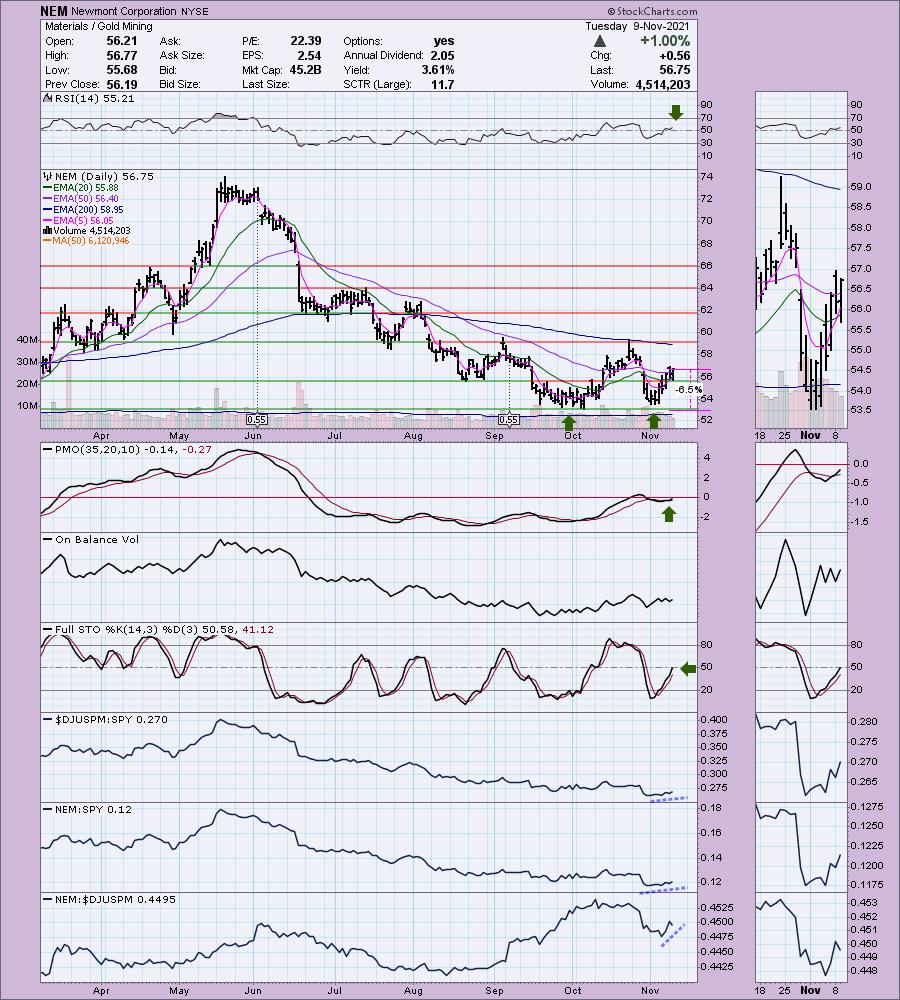
"NEM is down -0.04% in after hours trading. Gold Miners as a whole are very bullish right now. I presented NEM as the "Diamond of the Week" during yesterday's DecisionPoint Show. I also presented GOLD as a co-"Diamond of the Week". I presented NEM in the June 22nd 2020 Diamonds Report. Surprisingly, the stop was never hit. The position was up over 30% at the May top. Currently it is up a modest 1.16%.
We have a double-bottom forming. The confirmation line is at the October high. If the pattern executes as expected, the minimum upside target is at resistance at the April high. The RSI is back in positive territory and the PMO recently triggered a crossover BUY signal. Stochastics are rising and have just hit positive territory. Relative strength is improving for the group and NEM is outperforming the group."
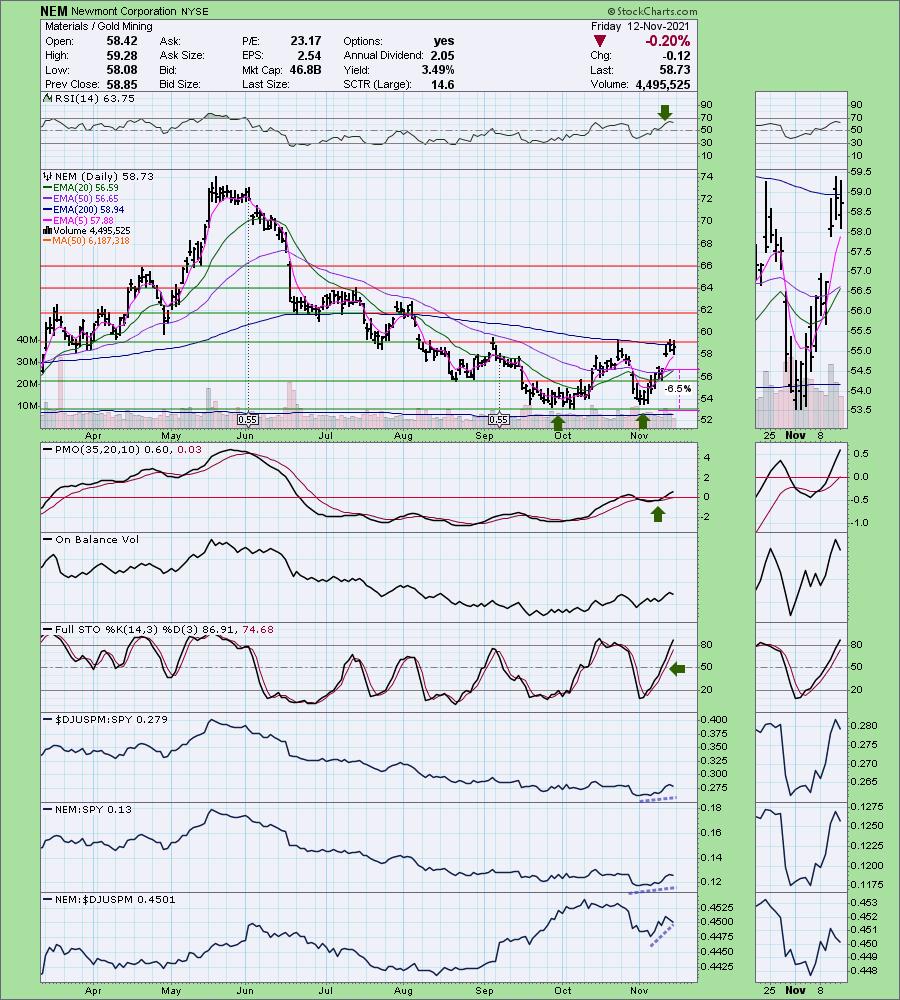
Here is today's chart:
The double-bottom pattern hasn't executed yet, but it looks good. The RSI has flattened but remains in positive territory. The PMO continues to rise after a bullish reversal just under the zero line. NEM is also nearing a "Silver Cross" BUY signal as the 20-EMA is about to cross above the 50-EMA. There is the risk that this is a reverse island formation, but given the strength of the group and Gold, I am expecting the breakout next week.
Don't forget, on Thursdays I look at reader-requested symbols, so shoot me an email at erin@decisionpoint.com. I read every email I receive and try to answer them all!
Dud:
WM Technology, Inc. (MAPS)
EARNINGS: 11/11/2021 (AMC) ** Reports Thursday **
WM Technology, Inc. operates as a listings marketplace with SaaS subscription offerings sold to retailers and brands in the U.S. state-legal and Canadian cannabis markets. It also provides information on the cannabis plant and the industry and advocates for legalization. The company was founded by Douglas Francis and Justin Hartfield in 2008 and is headquartered in Irvine, CA.
Predefined Scans Triggered: Elder Bar Turned Green, Bullish MACD Crossovers, Parabolic SAR Buy Signals and P&F Double Bottom Breakout.
Below are the commentary and chart from Tuesday:
"MAPS is up +1.02% in after hours trading. Here's your "speculative" investment of the week--position size wisely and prepare for possible volatility. Price closed above the 20-EMA after testing support at the August low. The RSI is rising, but is still negative right now. The PMO has turned up in oversold territory. Stochastics are rising, but like the RSI, are not in positive territory yet. Volume is strong going into earnings on Thursday. It hasn't been a good relative performer, but it appears that is changing. I would like to see it above overhead resistance, but if after hours trading is any indication, it should breakout very soon. The stop is set below support at the closing low from this month."
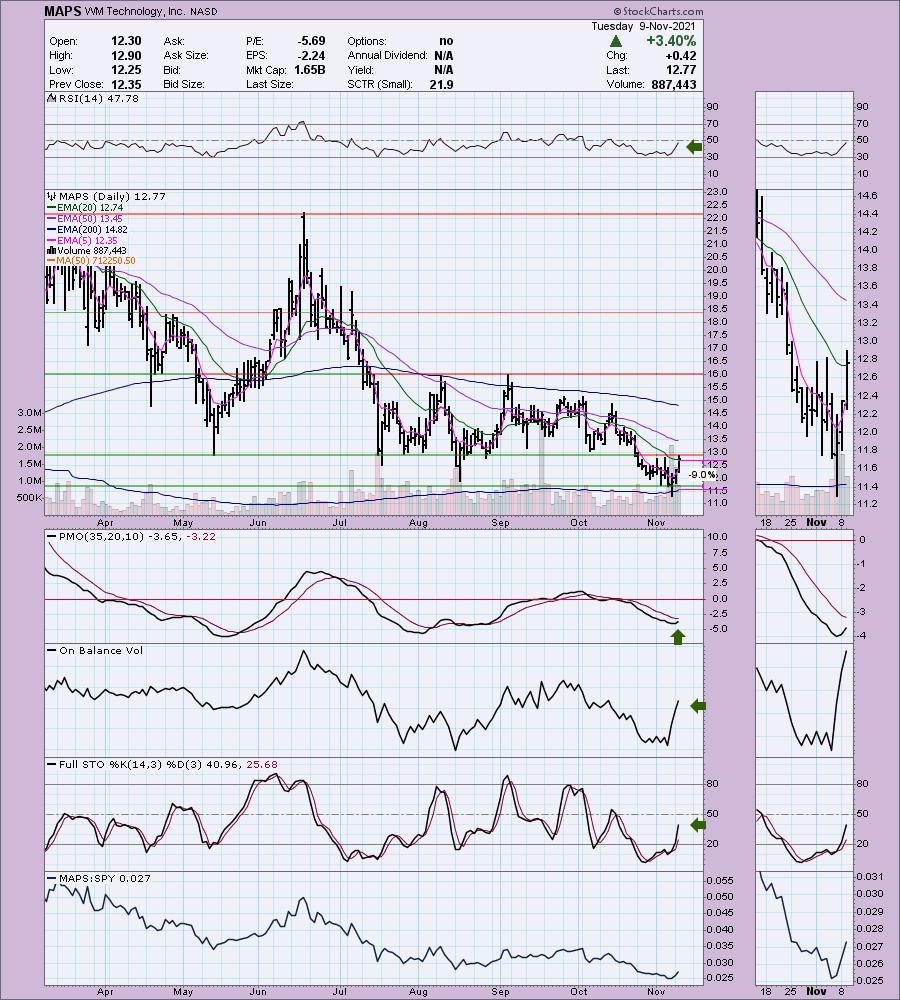
Below is today's chart:
MAPS thankfully triggered its stop on Wednesday so the giant gap down today was averted. Possible reasons the trade went south? The RSI while rising was still in negative territory. The PMO had turned up, but hadn't yet had a positive crossover. The chart is ugly right now with now visible support available. Currently it is at its all-time low.
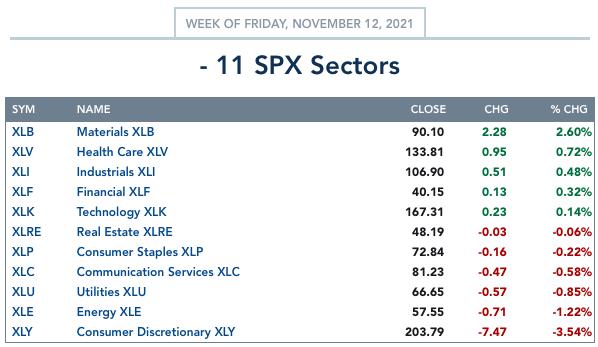
THIS WEEK's Sector Performance:
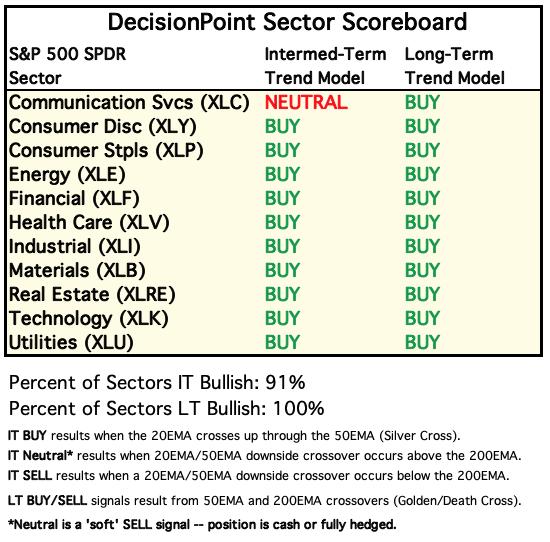
DecisionPoint Sector Scoreboard (Mechanical Trend Model Signals):
Click Here to view Carl's annotated Sector ChartList!
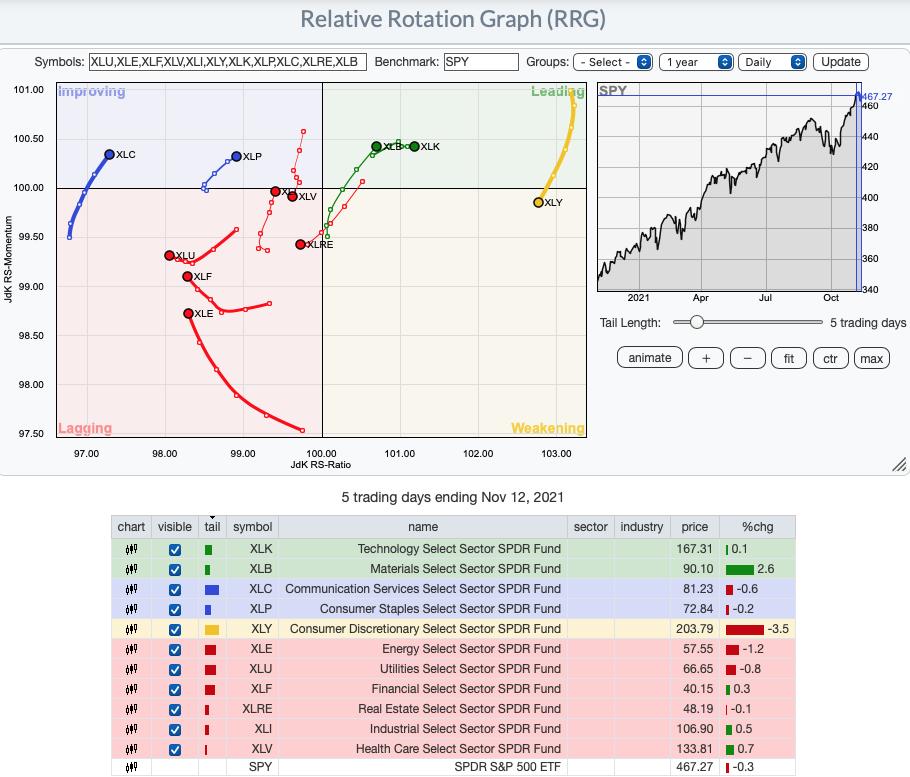
Short-term RRG: It isn't surprising that the three sectors I had narrowed down for the "one to watch" next week have favorable positions on the RRG. XLB and XLK are the strongest as they travel in the bullish northeast direction within Leading. Other sectors to keep an eye on are XLC, XLI and XLP. All three have a bullish northeast heading. XLY has fallen from favor as it has entered Weakening. XLV has the most negative position, as it moves southwest into Lagging. While XLU, XLF and XLE are lagging, they are beginning to turn back around.
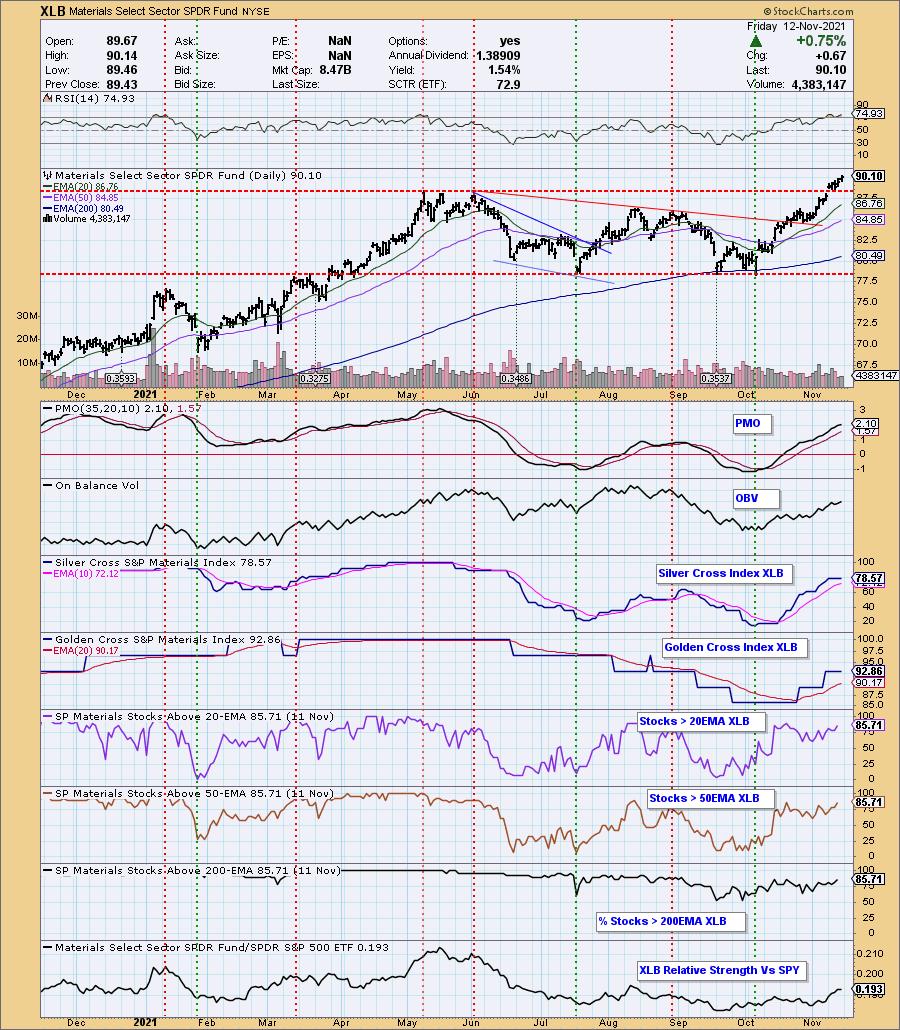
Sector to Watch: Materials (XLB)
I was very close to selecting XLI as the sector to watch, but I wasn't pleased with participation. I felt XLB had a more favorable chart. Participation on XLB is trending higher and there are more stocks > 20/50-EMAs than stocks with "silver crosses". This means that the SCI can move higher. This week's breakout was impressive and price continues to trend higher. The one issue I see is that it was the best performer this week and it may be time for Materials to hand over the reins to another sector.
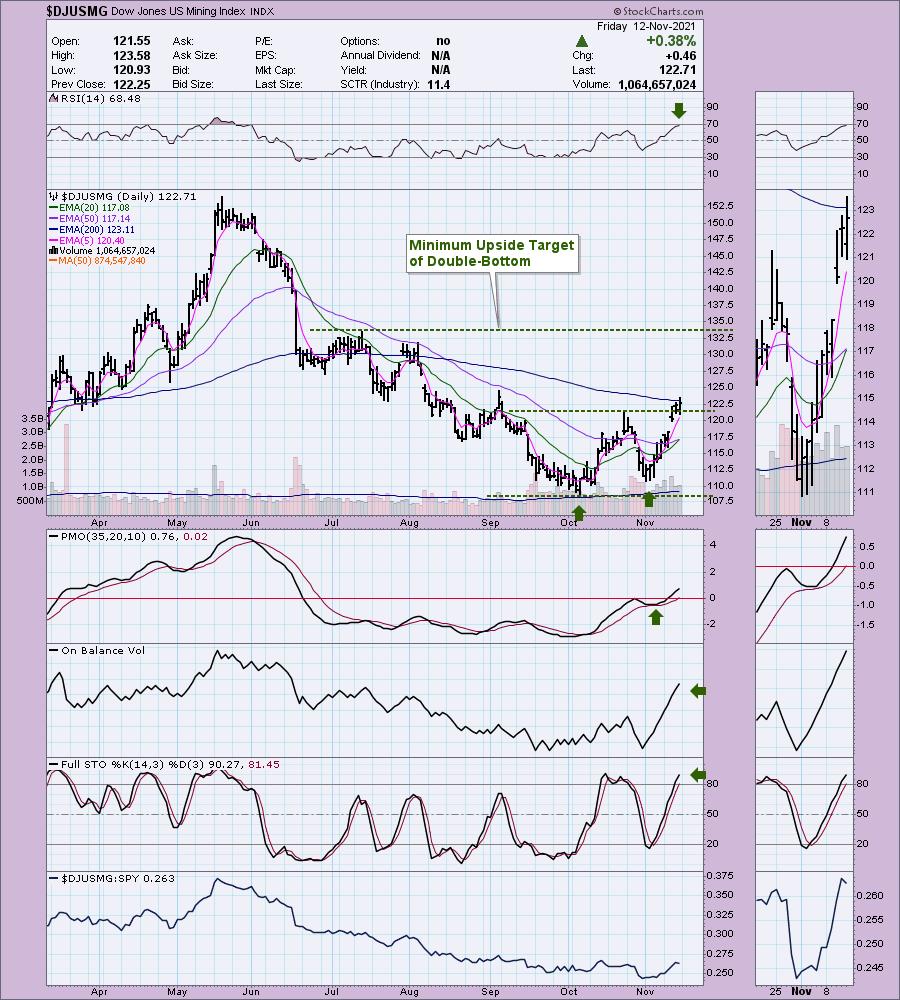
Industry Group to Watch: Mining ($DJUSMG)
I still like Gold Miners, but looking at the General Mining group, I similarly impressed. The double-bottom has been confirmed with a breakout above the October high. The minimum upside target of the pattern would see price test the July top. The RSI is positive and not overbought and the PMO has reached above the zero line after a very bullish bottom above the signal line. Stochastics are rising strongly and wow! check out the OBV and volume. Money is rotating into this group quickly.
Go to our Sector ChartList on DecisionPoint.com to get an in depth view of all the sectors.
Technical Analysis is a windsock, not a crystal ball.
Have a great weekend & Happy Charting! Next Diamonds Report is Tuesday 11/16.
- Erin
erin@decisionpoint.com
Full Disclosure: I'm about 80% exposed to the market.
Watch the latest episode of DecisionPoint with Carl & Erin Swenlin on Mondays 7:00p EST or on the DecisionPoint playlist on the StockCharts TV YouTube channel here!
NOTE: The stocks reported herein are from mechanical trading model scans that are based upon moving average relationships, momentum and volume. DecisionPoint analysis is then applied to get five selections from the scans. The selections given should prompt readers to do a chart review using their own analysis process. This letter is not a call for a specific action to buy, sell or short any of the stocks provided. There are NO sure things or guaranteed returns on the daily selection of "diamonds in the rough."
Helpful DecisionPoint Links:
DecisionPoint Shared ChartList and DecisionPoint Chart Gallery
Price Momentum Oscillator (PMO)
Swenlin Trading Oscillators (STO-B and STO-V)
(c) Copyright 2021 DecisionPoint.com