
As I reviewed the scan results today, I noticed a new theme. The word is already out on Technology and Consumer Discretionary. I shared my favorite Semiconductors yesterday, but I'm going to include a hybrid Software stock with its fingers in the Healthcare and Financial sectors.
The "theme" I'm concentrating on today is Industrials (XLI). XLI is about to have an IT Trend Model "Silver Cross" BUY signal as the 20-EMA is about to cross above the 50-EMA. The sector chart looks strong. The Silver Cross Index (SCI) is rising nicely and participation "under the hood" is strong, suggesting the SCI will continue to rise higher. The PMO has just entered positive territory and the RSI is positive and not overbought. We're not seeing the relative strength line rising just yet, but the SPY is having a pretty impressive rally right now.
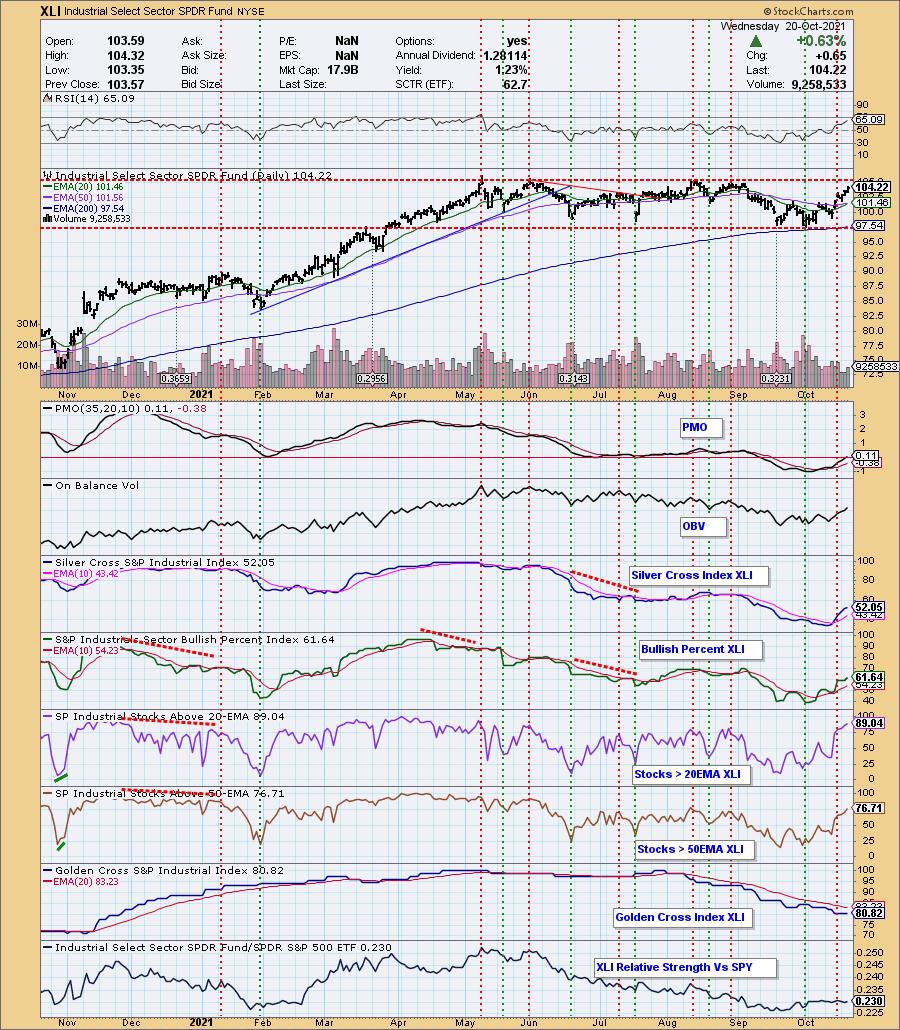
In this sector, I noticed that Industrial Machinery and Marine Transportation stocks were floating to the top of my list. Not particularly "sexy" industry groups, but they have some nice technicals on their charts.
Today's "Diamonds in the Rough": DAC, FLOW, HQY and XYL.
"Stocks to Review" (no order): FCFS, MUSA, DIOD, TFX, AMT, DE and HCAT.

RECORDING LINK Friday (10/15):
Topic: DecisionPoint Diamond Mine (10/15/2021) LIVE Trading Room
Start Time : Oct 15, 2021 09:00 AM
Meeting Recording LINK.
Access Passcode: October$15
REGISTRATION FOR FRIDAY 10/22 Diamond Mine:
When: Oct 22, 2021 09:00 AM Pacific Time (US and Canada)
Topic: DecisionPoint Diamond Mine (10/22/2021) LIVE Trading Room
Register in advance for this webinar HERE.
Save the registration confirmation email with login instructions in case Zoom doesn't notify you in time.

Free DP Trading Room (10/18) RECORDING LINK:
Topic: DecisionPoint Trading Room
Start Time : Oct 18, 2021 09:00 AM
Meeting Recording LINK
Access Passcode: October18!
For best results, copy and paste the access code to avoid typos.
Welcome to DecisionPoint Daily Diamonds, wherein I highlight five "Diamonds in the Rough." These are selected from the results of my DecisionPoint scans, which search for stocks that could benefit from the trend and condition of the market. Remember, these are not recommendations to buy or sell, but are the most interesting of the stocks that surfaced in my scans. My objective is to save you the work of the initial, tedious culling process, but you need to apply your own analysis to see if these stocks pique your interest as well. There are no guaranteed winners here!
Danaos Corp. (DAC)
EARNINGS: 11/8/2021 (AMC)
Danaos Corp. engages in the provision of marine and seaborne transportation services. It offers services by operating vessels in the containership sector of the shipping industry. The company was founded by Dimitris Coustas in1972 and is headquartered in Piraeus, Greece.
Predefined Scans Triggered: Bullish MACD Crossovers and P&F Double Top Breakout.
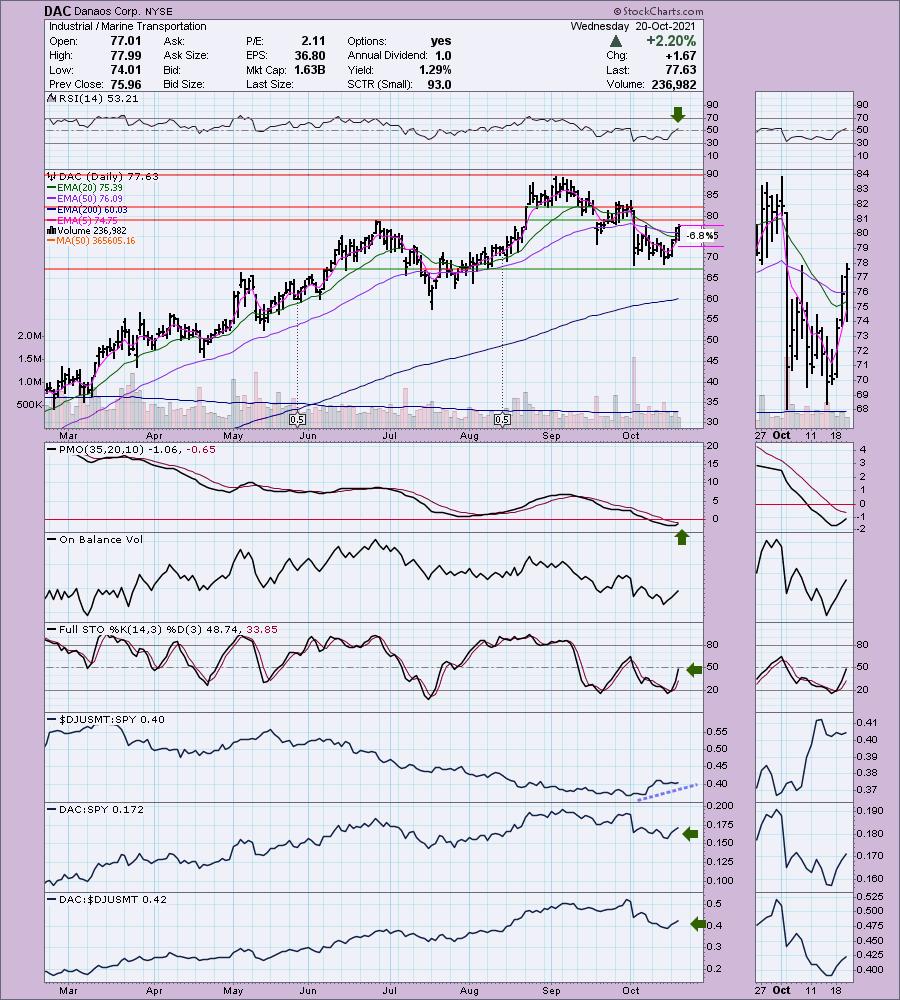
DAC is down -0.04% in after hours trading. Price bounced off support at the May tops and has now vaulted both the 20/50-EMAs. The RSI just moved into positive territory and the PMO is turning up in oversold territory. Stochastics are rising strongly. You can see that relative performance is somewhat flat for the industry group, but it is beginning to trend higher this month. DAC is now outperforming both the group and the SPY. The stop is set just below the September intraday low at 6.8%.
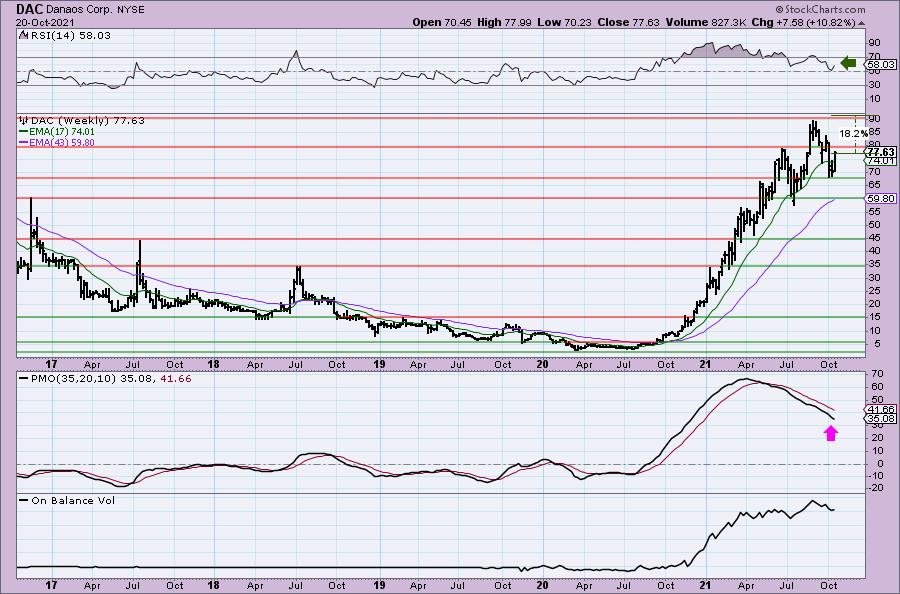
The weekly chart is mixed with a positive and rising RSI, but a PMO in decline on a SELL signal. The declining trend hasn't been broken to the upside yet. I'd keep your investment timeframe short-term until that declining trend is broken and the PMO is rising. Upside potential is over 18%.
SPX FLOW Inc. (FLOW)
EARNINGS: 11/3/2021 (BMO)
SPX Flow, Inc. engages in manufacturing and distributing industrial components. It operates through the following segments: Food & Beverage and Industrial. The Food and Beverage segment includes mixing, drying, evaporation, and separation systems and components, heat exchangers, and reciprocating and centrifugal pump technologies. The Industrial segment serves customers in the chemical, air treatment, mining, pharmaceutical, marine, shipbuilding, infrastructure construction, general industrial and water treatment industries. The company was founded in 1912 and is headquartered in Charlotte, NC.
Predefined Scans Triggered: New CCI Buy Signals and P&F Low Pole.
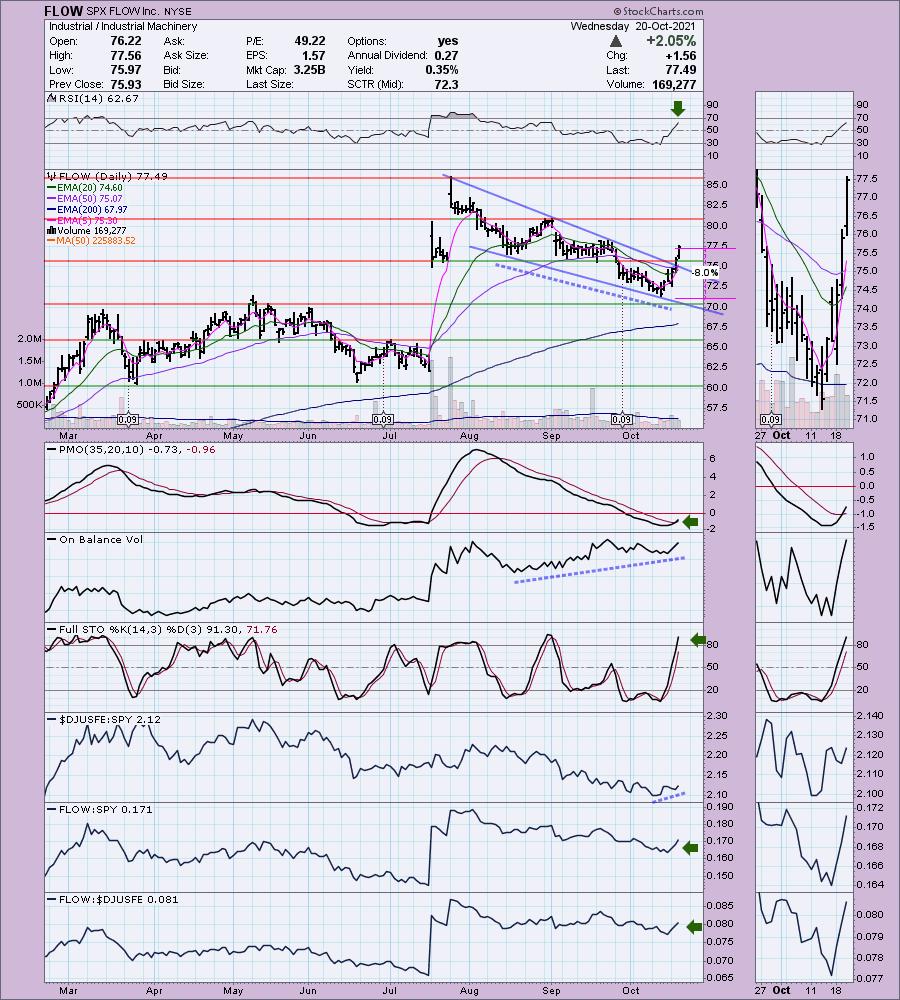
FLOW is unchanged in after hours trading. This is probably my favorite chart today. Price has broken out from an intermediate-term falling wedge. There is a new ST Trend Model BUY signal as the 5-EMA crossed above the 20-EMA. The PMO had a new crossover BUY signal today. The OBV positive divergence is beautiful and suggests this breakout should see plenty of follow-through. The RSI is now positive and Stochastics are rising strongly (albeit overbought). Relative strength studies show the group beginning to see improvement as well as the stock. The stop is set below support at the October low.
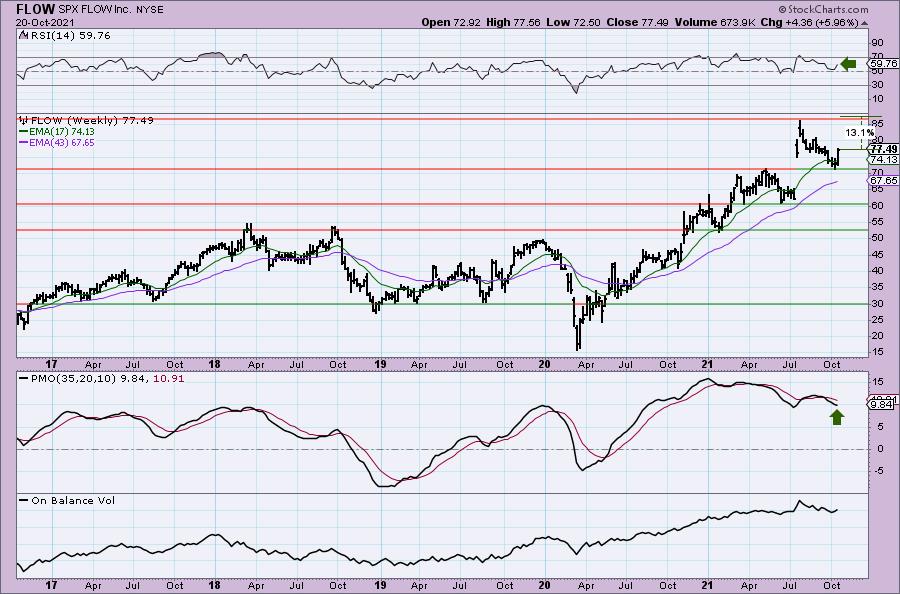
The weekly chart looks pretty good. The weekly RSI is rising and is not overbought. The weekly PMO is beginning to decelerate and could turn up soon. Upside potential is over 13%. I expect it to move past all-time highs.
HealthEquity, Inc. (HQY)
EARNINGS: 12/6/2021 (AMC)
HealthEquity, Inc. provides range of solutions for managing health care accounts. The firm's offers its solutions for employers, health plans, brokers, consultants and financial advisors. Its services include HAS, FSA, HRA, DCRA, 401(k), Commuter, COBRA and HIA. It also offers products like healthcare saving and spending platform, health savings accounts, investment advisory services, reimbursement arrangements, and healthcare incentives. The company was founded by Stephen D. Neeleman on September 18, 2002 and is headquartered in Draper, UT.
Predefined Scans Triggered: Entered Ichimoku Cloud and P&F Double Top Breakout.
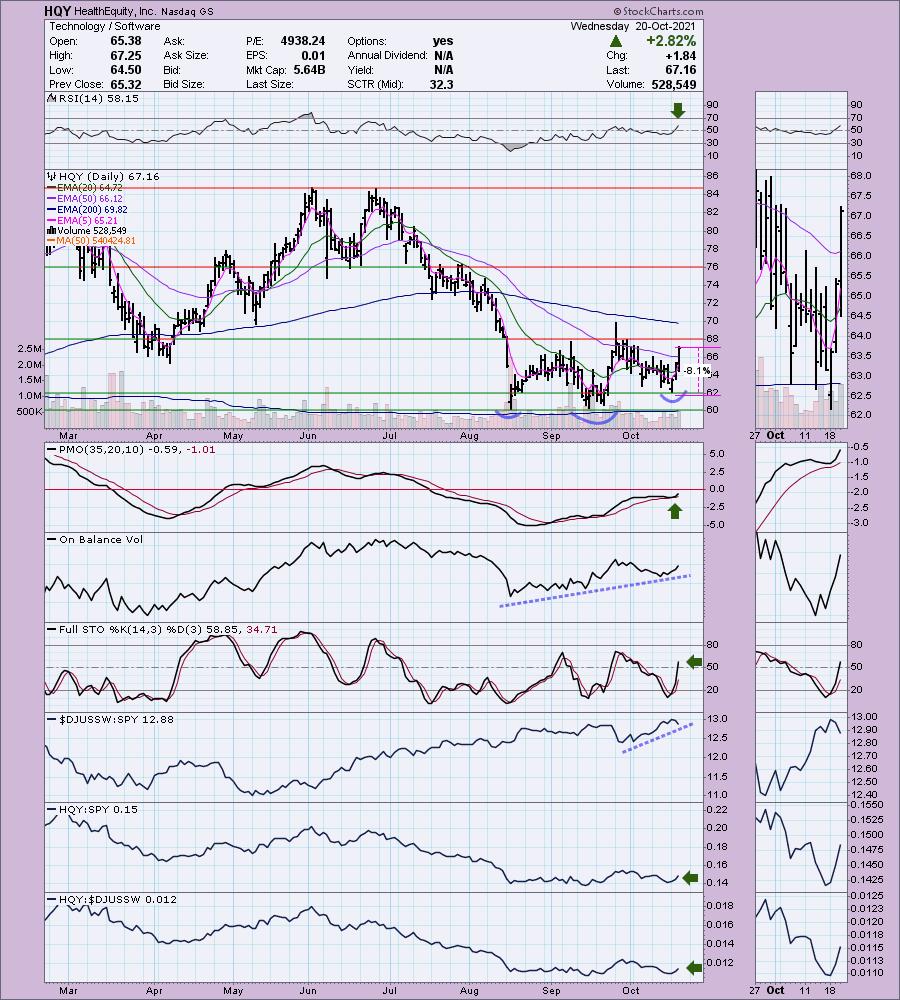
HQY is unchanged in after hours trading. We have a "basing" pattern on HQY. I believe it could be read as either a reverse head and shoulders or triple-bottom. Both are bullish so no need to quibble. Price broke above the 50-EMA. The PMO has formed an especially bullish bottom above its signal line. While price bottoms are mostly flat, the OBV has been trending higher. Stochastics are strong and the RSI is rising and positive. Relative strength for Software has been improving; now we are seeing HQY begin to outperform. The stop is set below the recent low at about 8%.
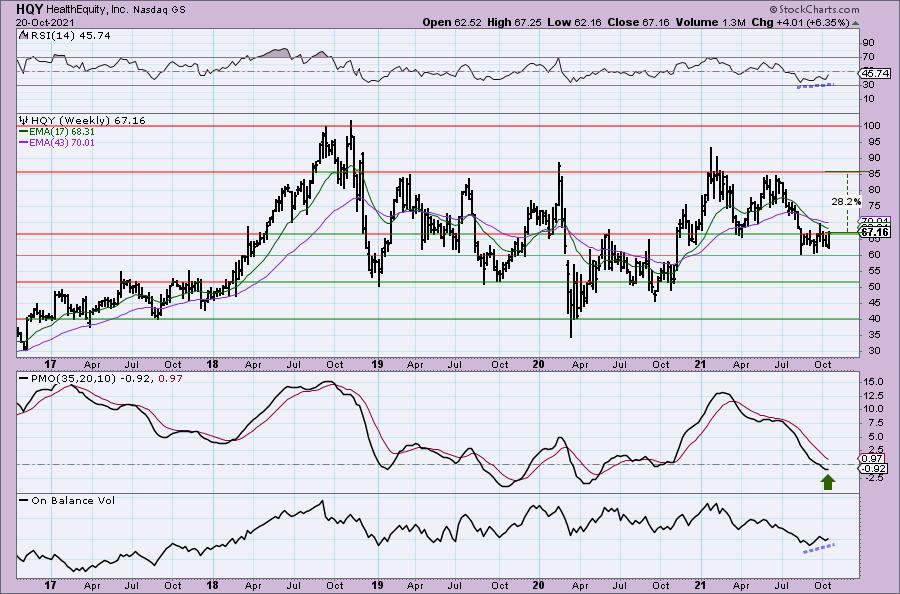
The weekly RSI is negative, but it is trending higher. The PMO has flattened and as noted on the daily chart the OBV is trending higher. My one concern would be the possibility of a bearish reverse flag formation on the weekly chart. Be true to your stop if this one loses support. Upside potential is great at over 28% which is somewhat conservative given we've seen all-time highs around $100.
Xylem Inc. (XYL)
EARNINGS: 11/2/2021 (BMO)
Xylem, Inc. engages in the design, manufacture, and application of engineered technologies for the water industry. It operates through following business segments: Water Infrastructure, Applied Water, and Measurement and Control Solutions. The Water Infrastructure segment focuses on the transportation, treatment and testing of water. The Applied Water segment encompasses the uses of water and focuses on the commercial, residential, and industrial end markets. The Measurement and Control Solutions segment focuses on developing technology solutions that enable intelligent use and conservation of critical water and energy resources as well as analytical instrumentation used in the testing of water. The company was founded in 2011 and is headquartered in Rye Brook, NY.
Predefined Scans Triggered:Bullish MACD Crossovers and P&F High Pole.
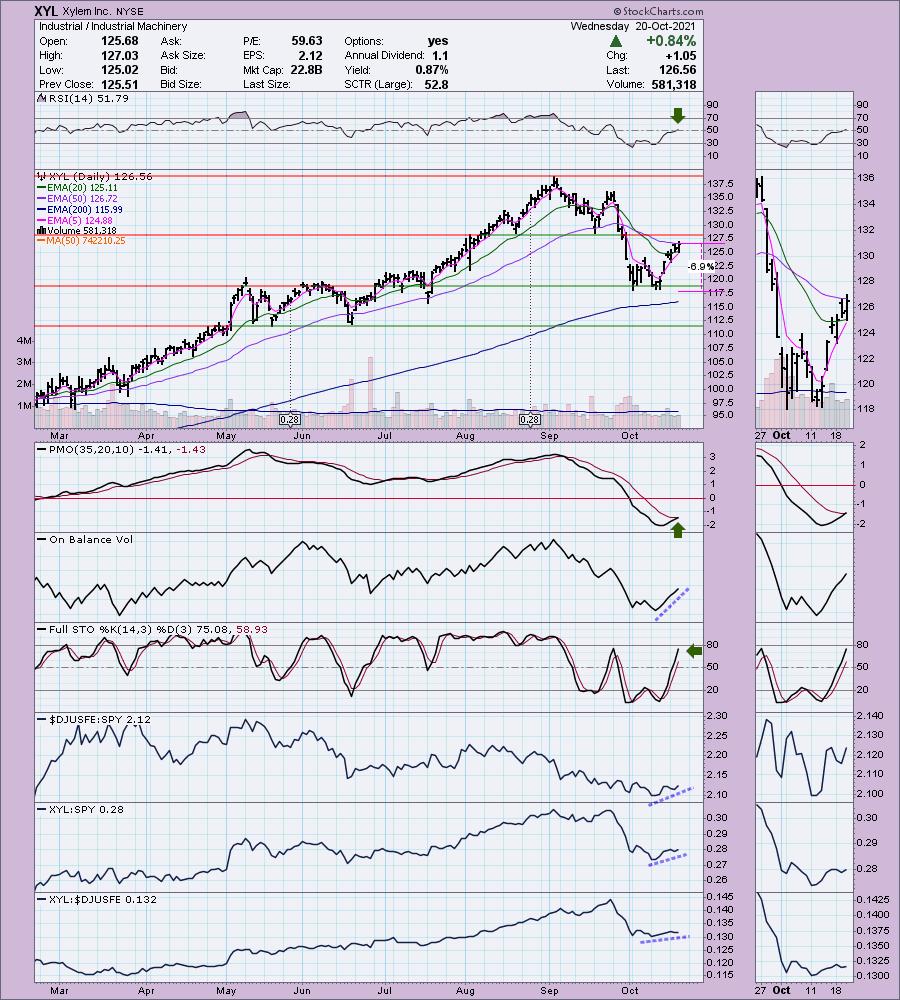
XYL is down -0.83% in after hours trading. We have a bullish double-bottom that is in the process of executing. The minimum upside target of that pattern would take price to about $132.50, but given there isn't any resistance at that level, I would expect a move higher to at least $135. The RSI just moved positive and the PMO just had a crossover BUY signal. The OBV shows volume coming in on this rally. Relative performance is positive and improving. The stop is set at 6.9%, just below the double-bottom.
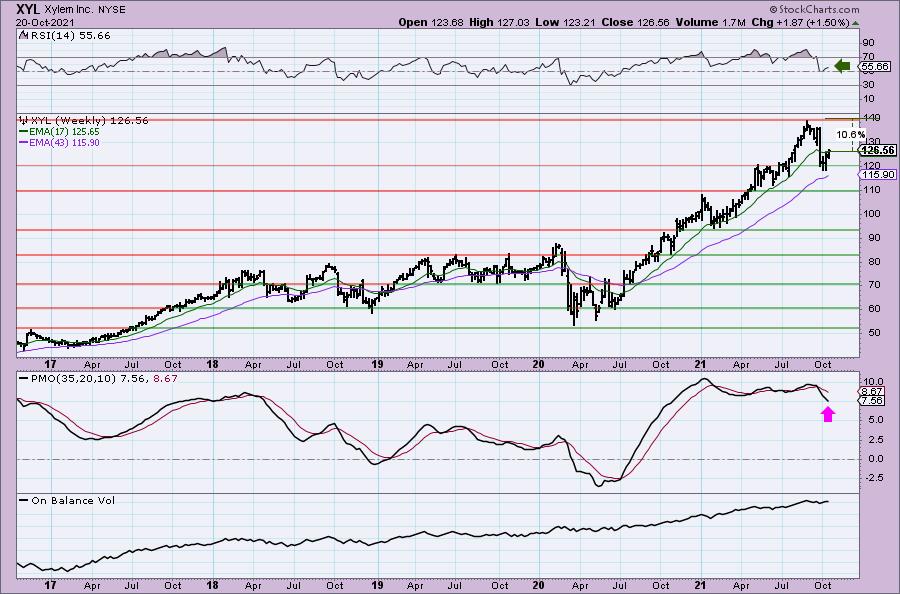
The weekly PMO doesn't look so good, but we can see price is bouncing off strong support. The RSI is also positive and rising. It's about 10% away from all-time highs. I expect it to surpass that, but I'd definitely like to see the PMO decelerate more.
Don't forget, on Thursdays I look at reader-requested symbols, click HERE to shoot me an email. I read every email I receive and try to answer them all!
Current Market Outlook:
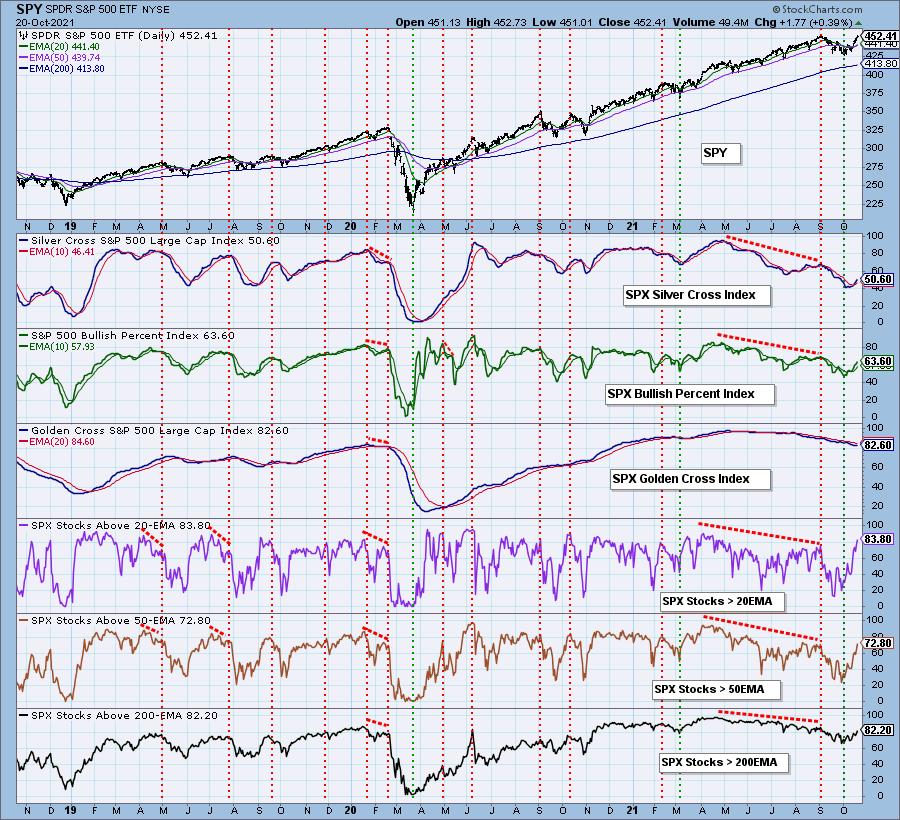
Market Environment: It is important to consider the odds for success by assessing the market tides. The following chart uses different methodologies for objectively showing the depth and trend of participation for intermediate- and long-term time frames.
- The Silver Cross Index (SCI) shows the percentage of SPX stocks on IT Trend Model BUY signals (20-EMA > 50-EMA)
- The Golden Cross Index (GCI) shows the percentage of SPX stocks on LT Trend Model BUY signals (50-EMA > 200-EMA)
- The Bullish Percent Index (BPI) shows the percentage of SPX stocks on Point & Figure BUY signals.
Don't forget that as a "Diamonds" member, you have access to our GCI/SCI curated ChartList on DecisionPoint.com. You'll find it under "Members Only" links on the left side on the Blogs and Links Page.
Here is the current chart:
Full Disclosure: I'm back to 75% invested and 25% is in 'cash', meaning in money markets and readily available to trade with. I am planning on purchasing FLOW in the morning.
I'm required to disclose if I currently own a stock and/or may buy it within the next 72 hours.
Technical Analysis is a windsock, not a crystal ball.
Happy Charting!
- Erin
erin@decisionpoint.com
Watch the latest episode of DecisionPoint with Carl & Erin Swenlin on Mondays 7:00p EST or on the DecisionPoint playlist on the StockCharts TV YouTube channel here!
NOTE: The stocks reported herein are from mechanical trading model scans that are based upon moving average relationships, momentum and volume. DecisionPoint analysis is then applied to get five selections from the scans. The selections given should prompt readers to do a chart review using their own analysis process. This letter is not a call for a specific action to buy, sell or short any of the stocks provided. There are NO sure things or guaranteed returns on the daily selection of "Diamonds in the Rough."
Helpful DecisionPoint Links:
DecisionPoint Shared ChartList and DecisionPoint Chart Gallery
Price Momentum Oscillator (PMO)
Swenlin Trading Oscillators (STO-B and STO-V)
For more links, go to DecisionPoint.com