
Those familiar with my analysis process know that I pay only a small amount of attention to noise, I mean daily news. However, there is one news item that is dominating the headlines right now--the withdrawal from Afghanistan. Politics aside, how might this affect our investment choices?
We know that China already has a near monopoly on rare earth materials, but Afghanistan also has rare earth materials. China is poised to 'help' Afghanistan with their mining of these materials. This means that China could have an even bigger piece of the pie. We are seeing the impact of scarce raw materials and production that are required to make everything from autos to iphones. Here is an article a subscriber recently sent that discusses this in more detail.
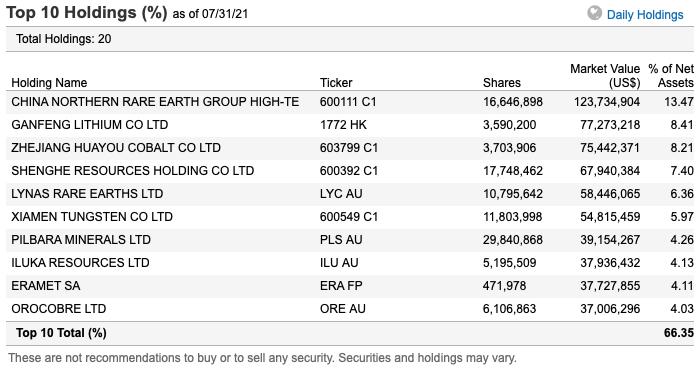
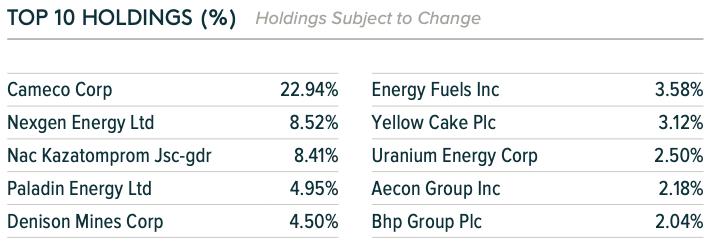
I discussed the Rare Earth Materials ETF (REMX) briefly in Friday's DP Diamonds Recap, but now I want to dive into the chart. I took a look at some of the holdings in REMX. Most aren't conventional investments, but it did steer me in the right direction for investigating other potential "diamonds in the rough".
Today's "Diamonds in the Rough" are: REMX, LAC, LYSDY and URA.

No Recording on 8/27 due to illness.
RECORDING LINK Friday (8/20):
Topic: DecisionPoint Diamond Mine (8/20/2021) LIVE Trading Room
Start Time : Aug 20, 2021 08:58 AM
Meeting Recording Link HERE.
Access Passcode: August/20th
REGISTRATION FOR FRIDAY 9/3 Diamond Mine:
When: Sep 3, 2021 09:00 AM Pacific Time (US and Canada)
Topic: DecisionPoint Diamond Mine (09/03/2021) LIVE Trading Room
Register in advance for this webinar HERE.
Save the registration confirmation email with login instructions in case Zoom doesn't notify you in time.

Free DP Trading Room (8/30) RECORDING LINK:
Topic: DecisionPoint Trading Room
Start Time : Aug 30, 2021 08:57 AM
Meeting Recording Link.
Access Passcode: August-30th
For best results, copy and paste the access code to avoid typos.
Welcome to DecisionPoint Daily Diamonds, wherein I highlight five "Diamonds in the Rough." These are selected from the results of my DecisionPoint scans, which search for stocks that could benefit from the trend and condition of the market. Remember, these are not recommendations to buy or sell, but are the most interesting of the stocks that surfaced in my scans. My objective is to save you the work of the initial, tedious culling process, but you need to apply your own analysis to see if these stocks pique your interest as well. There are no guaranteed winners here!
VanEck Vectors Rare Earth/Strategic Metals ETF(REMX)
EARNINGS: N/A
REMX tracks an index of global companies that mine, refine, or recycle rare earth and strategic metals.
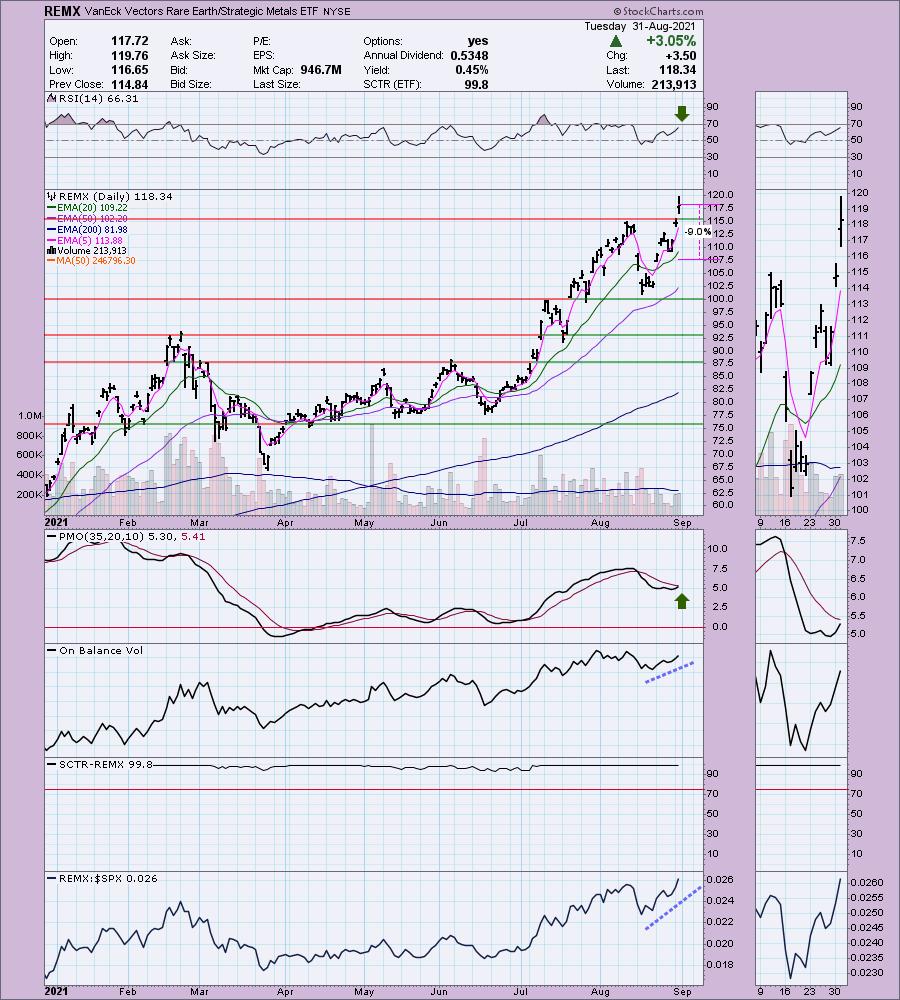
REMX is up +0.59% in after hours trading. There is still plenty of upside potential despite the recent runaway rally out of the lows this month. The pullback moved the RSI out of overbought territory. The PMO is a bit late to the party, but it should give us a crossover BUY signal shortly. I've set a 9% stop but I really doubt it will be hit.
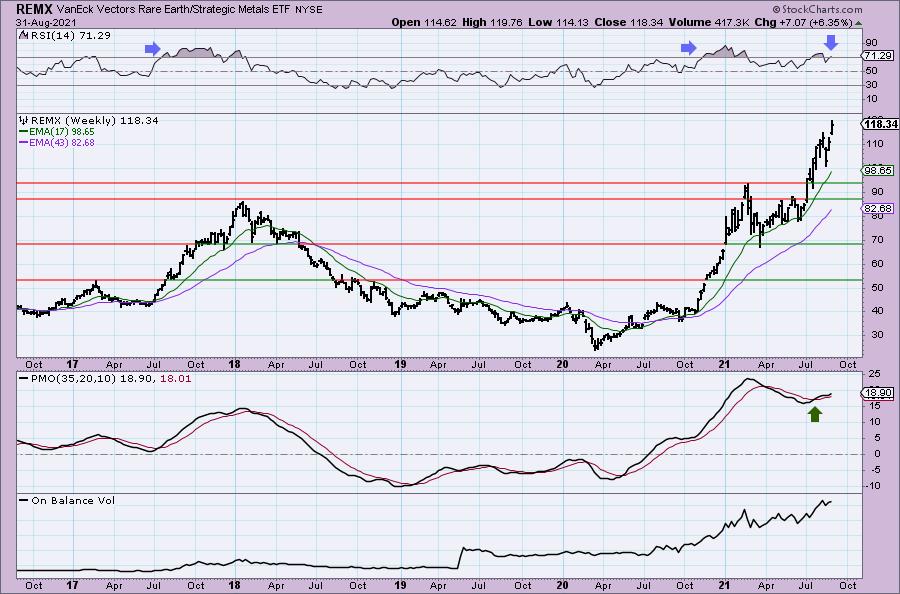
The weekly chart is looking good. The only detractor is the overbought weekly RSI. However, this one can hold onto overbought territory for weeks and months. We will want to view this weekly chart periodically, because when the RSI does turn back down, we see some significant pullbacks.
Lithium Americas Corp. (LAC)
EARNINGS: 11/4/2021 (BMO)
Lithium Americas Corp. is a resource company, which engages in lithium development projects. Its projects include: Thacker Pass and Caucharí-Olaroz. The company was founded by Raymond Edward Flood, Jr. on November 27, 2007 and is headquartered in Vancouver, Canada.
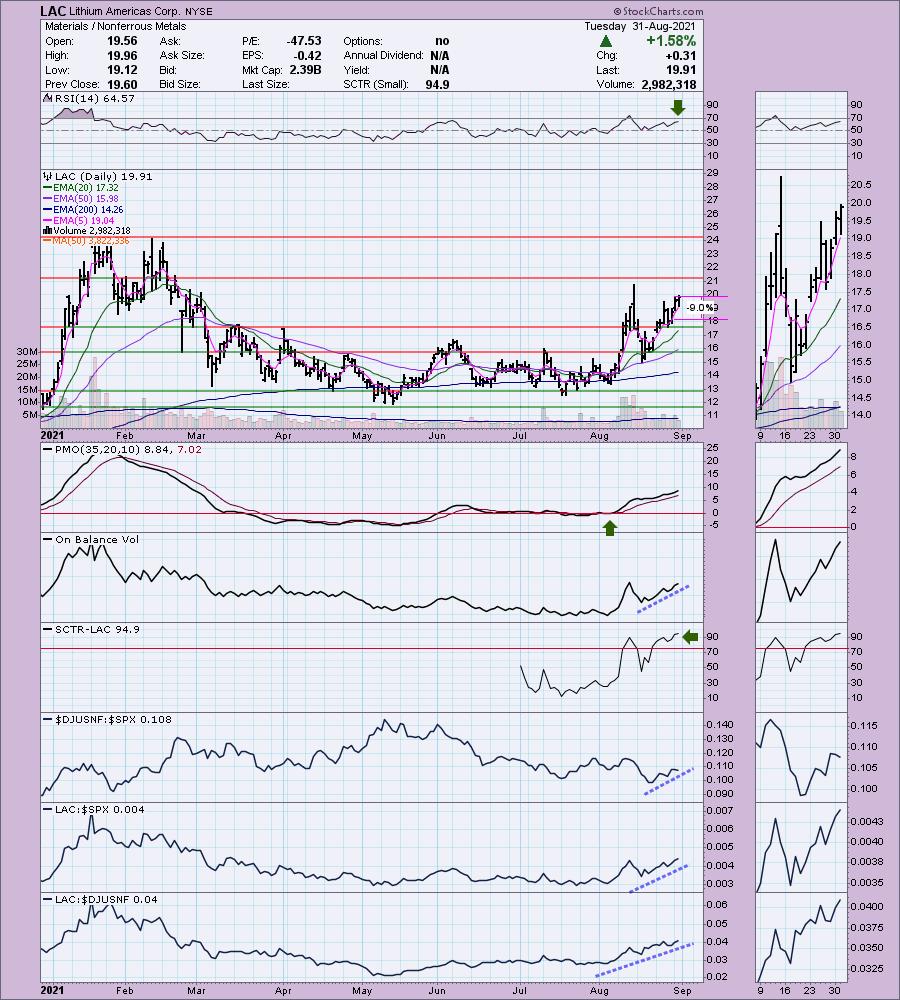
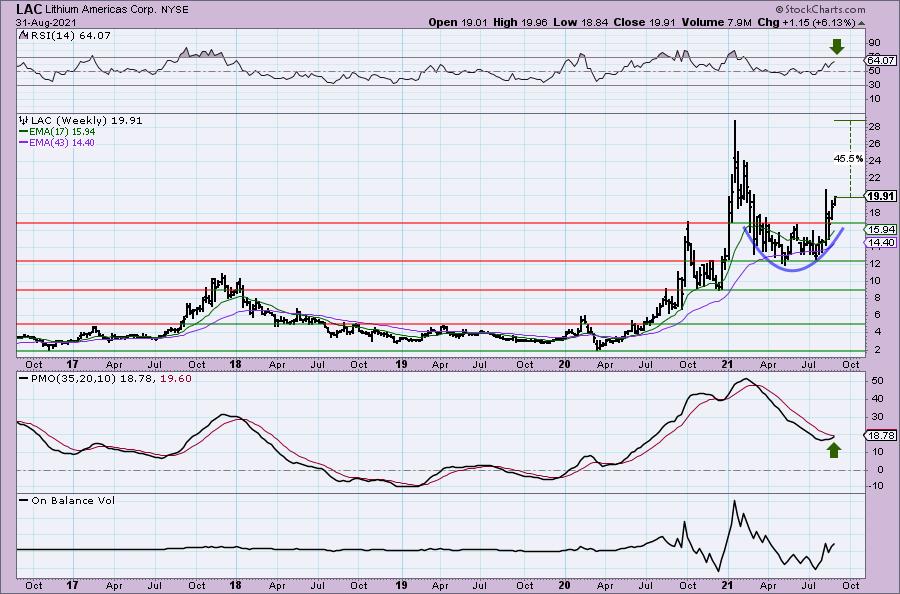
LAC is down -0.05% in after hours trading. I've covered LAC twice before. The most recent was on January 20th 2021. Terrible timing on that position as the deep 11.4% stop was hit on the collapse that almost immediately followed. However, the first time I covered it was on July 30th 2020. The stop was never hit so the position is up a whopping +220.6%! I did choose it from a batch of reader requests that day. I don't remember who brought it to the table, but I'm glad I picked it.
Price is rallying after the mid-August pullback. Resistance will be arriving soon, but given the positive RSI and rising PMO which is not overbought, I doubt LAC will have much trouble with it. Volume is confirming the latest rally and clearly relative strength is on its side. The stop is set at 9% which is just below the January trough.
We have a bullish cup-shaped bottom. The weekly RSI is positive and not overbought. The weekly PMO is nearing a crossover BUY signal. Upside potential is fantastic at 45%.
Lynas Corp. Ltd. (LYSDY)
EARNINGS: N/A
Lynas Rare Earths Ltd. engages in the production of rare earth minerals. It focuses on the exploration, development, mining, and processing of rare earth deposits. The company was founded by Nicholas Anthony Curtis on May 25, 1983 and is headquartered in Kuantan, Malaysia.
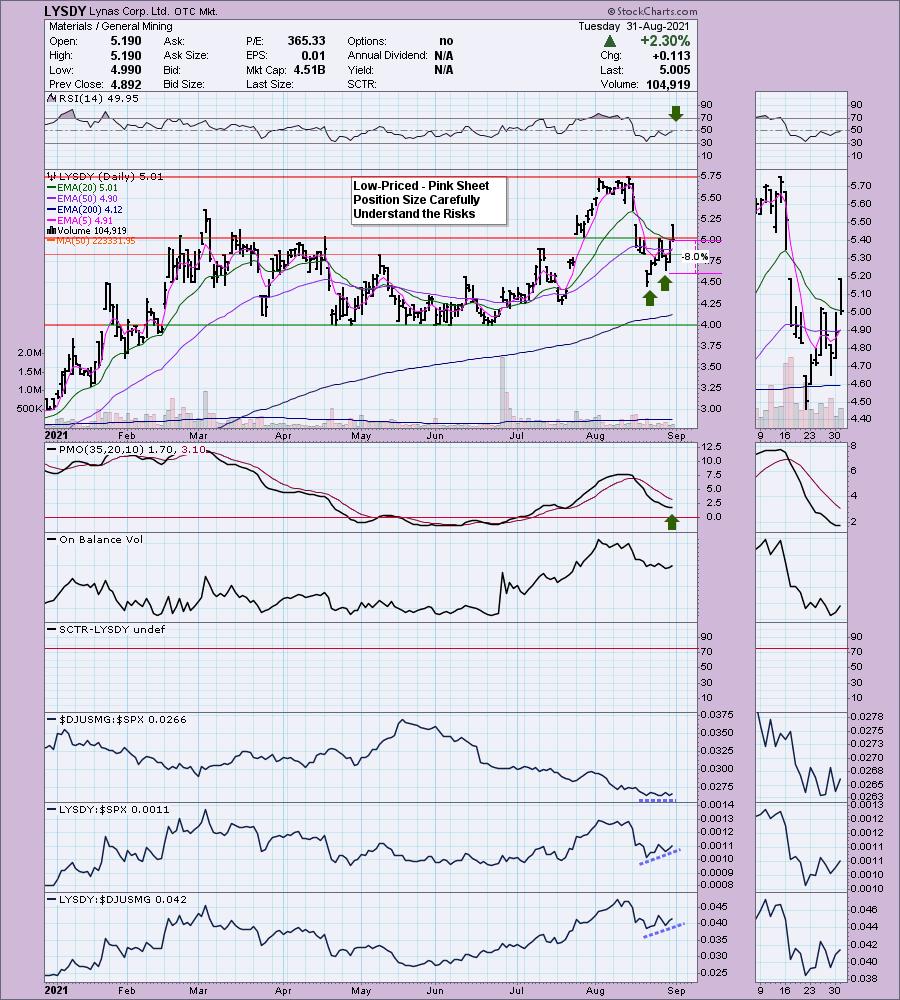
LYSDY is a pink sheet listing so it doesn't trade after hours. This is one of the holdings of REMX. Before I even talk about the chart, know that pink sheet OTC stocks carry inherent risk due to liquidity and volatility. This one is low-priced so you'll want to position size wisely. If you don't have a high risk appetite, probably best to avoid this one. However, I did find the chart very interesting indeed.
We have a bullish double-bottom that triggered today. Of course right after triggering, price sunk back below the confirmation line drawn across the middle of the "W". However, the chart still has merit. The RSI is about to cross into positive territory and the PMO is turning up. It is beginning to show improved relative performance. I'd like to see the OBV bottoms rising with price bottoms. The stop is set at 8% which is below the second low of the double-bottom pattern.
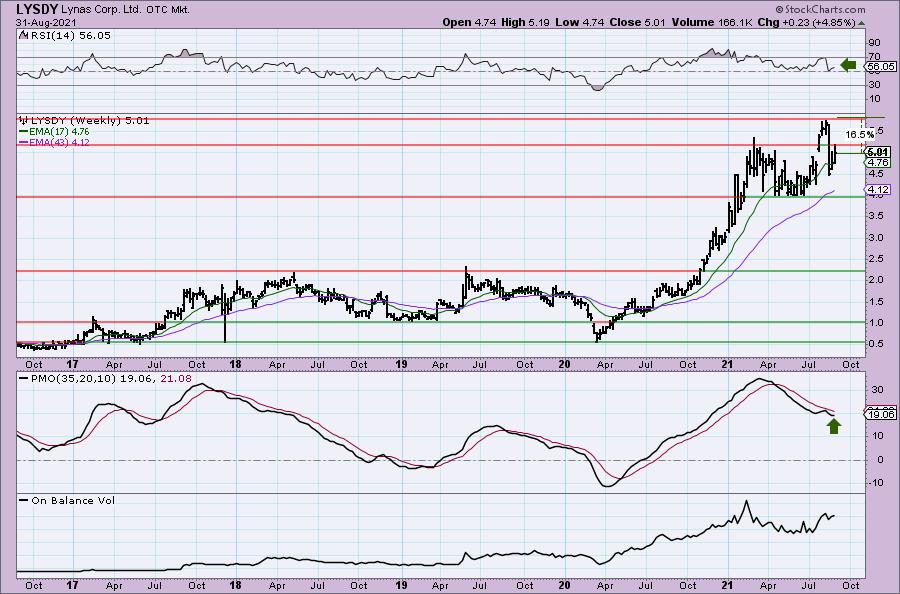
The weekly chart shows a PMO that is beginning to turn back up. The weekly RSI is positive. The July breakout executed a bull flag. But, as we can see, the breakout from the flag failed on this month's correction. However, now price is rising again. There is decent upside potential even if price only tests its all-time high. However, I would look for a move much higher than that.
Global X Uranium ETF (URA)
EARNINGS: N/A
URA tracks a market-cap-weighted index of companies involved in uranium mining and the production of nuclear components.
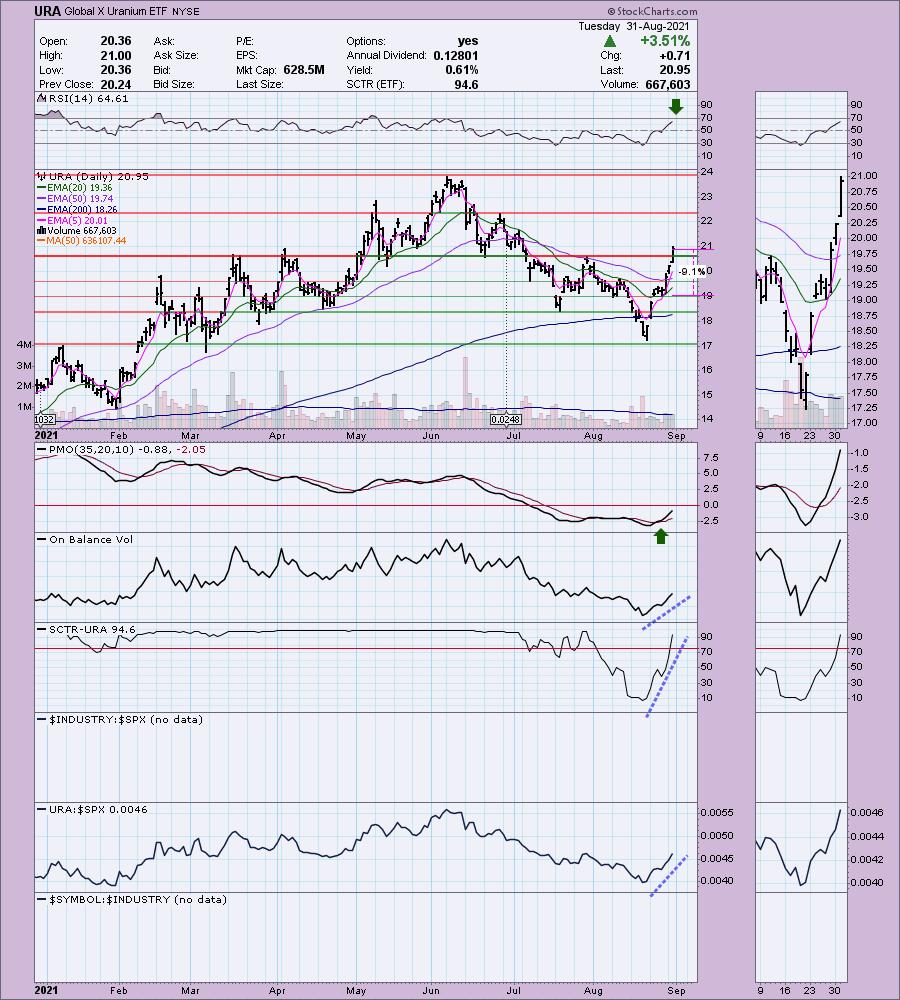
URA is up +0.24% in after hours trading. I covered URA on October 21st 2020. The position is still open as the 6.4% stop was never hit. Currently it is up +87.1% since. It has been enjoying a strong rally the last half of this month, but there is plenty of upside potential even on the daily chart. The RSI is positive and the PMO is on a oversold crossover BUY signal. The OBV is confirming the current rally. The SCTR shot up into the "hot zone" above 75, meaning it is in the upper 6% of all ETFs out there as far as relative strength. The stop is at 9.1% which puts at gap support.
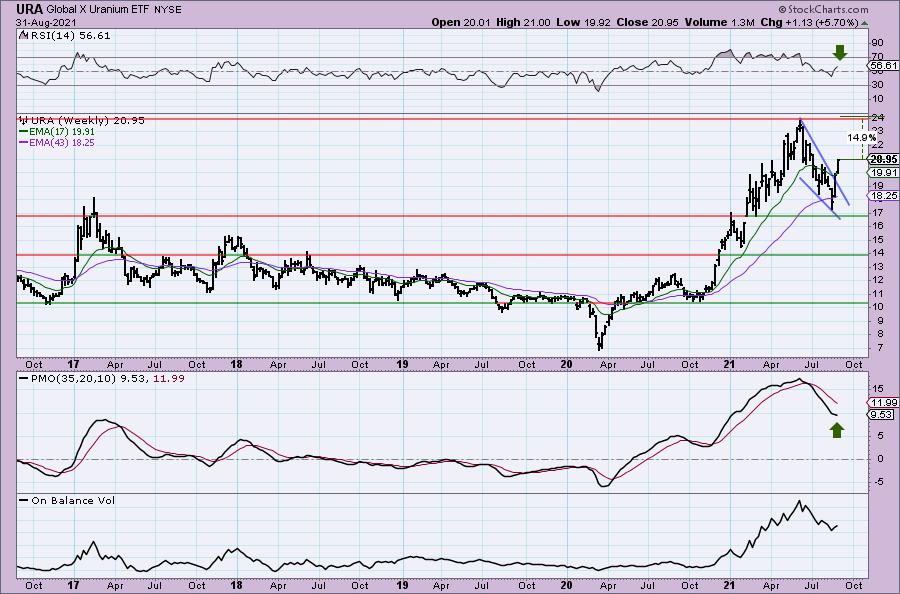
The weekly chart is shaping up nicely. There is a bullish falling wedge that has executed with this week's strong rally. The weekly RSI is positive and not overbought. The weekly PMO is decelerating in preparation for a possible crossover BUY signal. Upside potential is currently about 15%, but given the large bull flag, we should see price move much higher than that.
Don't forget, on Thursdays I look at reader-requested symbols, so shoot me an email at erin@decisionpoint.com. I read every email I receive and try to answer them all!
Current Market Outlook:
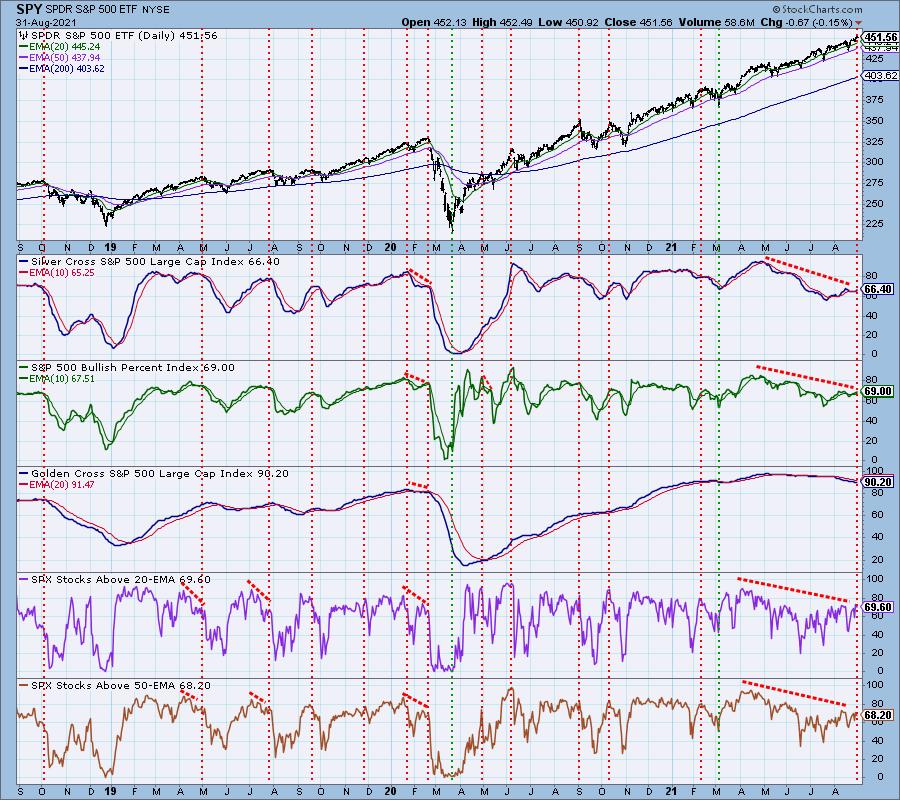
Market Environment: It is important to consider the odds for success by assessing the market tides. The following chart uses different methodologies for objectively showing the depth and trend of participation for intermediate- and long-term time frames.
- The Silver Cross Index (SCI) shows the percentage of SPX stocks on IT Trend Model BUY signals (20-EMA > 50-EMA)
- The Golden Cross Index (GCI) shows the percentage of SPX stocks on LT Trend Model BUY signals (50-EMA > 200-EMA)
- The Bullish Percent Index (BPI) shows the percentage of SPX stocks on Point & Figure BUY signals.
Don't forget that as a "Diamonds" member, you have access to our GCI/SCI curated ChartList on DecisionPoint.com. You'll find it under "Members Only" links on the left side on the Blogs and Links Page.
Here is the current chart:
Full Disclosure: I'm about 60% invested and 40% is in 'cash', meaning in money markets and readily available to trade with.
Technical Analysis is a windsock, not a crystal ball.
Happy Charting!
- Erin
erin@decisionpoint.com
Watch the latest episode of DecisionPoint with Carl & Erin Swenlin on Mondays 7:00p EST or on the DecisionPoint playlist on the StockCharts TV YouTube channel here!
NOTE: The stocks reported herein are from mechanical trading model scans that are based upon moving average relationships, momentum and volume. DecisionPoint analysis is then applied to get five selections from the scans. The selections given should prompt readers to do a chart review using their own analysis process. This letter is not a call for a specific action to buy, sell or short any of the stocks provided. There are NO sure things or guaranteed returns on the daily selection of "Diamonds in the Rough."
Helpful DecisionPoint Links:
DecisionPoint Shared ChartList and DecisionPoint Chart Gallery
Price Momentum Oscillator (PMO)
Swenlin Trading Oscillators (STO-B and STO-V)
For more links, go to DecisionPoint.com