
While the market was up today, we are still playing defense. To that end, today's "Diamonds in the Rough" are in defensive sectors and offer high yields as well as the opportunity to set a tight stop.
I decided to sell quite a few positions to limit my exposure to the market right now. I simply don't trust it given shallow participation within the market. The bias is bearish and that affects our confidence level on stock selection. There are pockets of strength to be sure, but our ability to find solid investments even within those pockets is limited given the market's lack of participation.
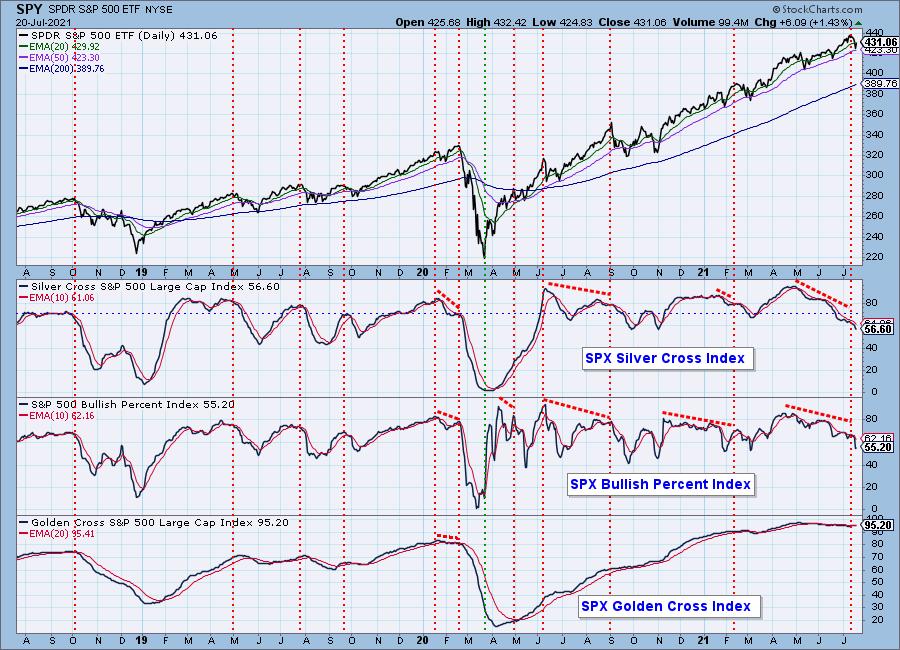
One example: About 57% of the SPX members have their 20-EMA > 50-EMA which is bad in and of itself, but then you have only 38% of those stocks with their price above the 50-EMA. What does that mean? That means that about 20% of those stocks on "Silver Crosses" (20-EMA > 50-EMA) are in peril of losing those signals.
Consequently, we need to be very selective or limit our exposure to account for the lack of participation. One way to limit exposure is moving to cash, but a slightly nuanced way to limit exposure is to only purchase when you can set a tight stop. That works on stocks that aren't that volatile and that leads us to defensive, high yield stocks and ETFs.
We are not in a bear market so shorting isn't necessarily a good trade.
Today's "Diamonds in the Rough" are: DUK, FLO, MDLZ and PNW.
Stocks to Review ** (no order): JKHY, DG, BRG, COLD and PFE.
** The "Stocks to Review" are stocks that were on my short list for the day.
 Diamond Mine Information:
RECORDING LINK "Bonus" Diamond Mine Wednesday (7/14):
Topic: Make-up DecisionPoint Diamond Mine (7/14/2021) LIVE Trading Room
Start Time : Jul 14, 2021 08:59 AM
Meeting Recording LINK for 7/14 is HERE.
Access Passcode: July-14th
RECORDING LINK FRIDAY (7/16) Diamond Mine:
Topic: DecisionPoint Diamond Mine (7/16/2021) LIVE Trading Room
Start Time : Jul 16, 2021 09:02 AM
Meeting Recording Link for 7/16 is HERE.
Access Passcode: July-16th
REGISTER NOW for Friday 7/23 Diamond Mine:
When: Jul 23, 2021 09:00 AM Pacific Time (US and Canada)
Topic: DecisionPoint Diamond Mine (07/23/2021) LIVE Trading Room
Register in advance for this webinar HERE.
Save the registration confirmation email with login instructions in case Zoom doesn't notify you in time.
Free DP Trading Room (7/19) RECORDING LINK:
Topic: DecisionPoint Trading Room
Start Time : Jul 19, 2021 08:57 AM
Meeting Recording for DP Trading Room (7/19) Link is HERE.
Access Passcode: July/19th
Guest: Leslie Jouflas, CMT - Free DP Trading Room (7/12) RECORDING LINK:
Topic: DecisionPoint Trading Room
Start Time : Jul 12, 2021 09:00 AM
Meeting Recording for DP Trading Room is HERE.
Access Passcode: W72^WzSb
For best results, copy and paste the access code to avoid typos.
Welcome to DecisionPoint Daily Diamonds, wherein I highlight five "Diamonds in the Rough." These are selected from the results of my DecisionPoint scans, which search for stocks that could benefit from the trend and condition of the market. Remember, these are not recommendations to buy or sell, but are the most interesting of the stocks that surfaced in my scans. My objective is to save you the work of the initial, tedious culling process, but you need to apply your own analysis to see if these stocks pique your interest as well. There are no guaranteed winners here!
Duke Energy Corp. (DUK)
EARNINGS: 8/5/2021 (BMO)
Duke Energy Corp. engages in the distribution of natural gas and energy related services. It operates through the following segments: Electric Utilities and Infrastructure; Gas Utilities and Infrastructure; and Commercial Renewables. The Electric Utilities and Infrastructure segment conducts operations in Duke Energy's regulated electric utilities in the Carolinas, Florida and the Midwest. The Gas Utilities and Infrastructure segment focuses on Piedmont, Duke Energy's natural gas local distribution companies in Ohio and Kentucky, and Duke Energy's natural gas storage and midstream pipeline investments. The Commercial Renewables segment acquires, develops, builds, operates, and owns wind and solar renewable generation throughout the continental United States. The company was founded on April 30, 1904 and is headquartered in Charlotte, NC.
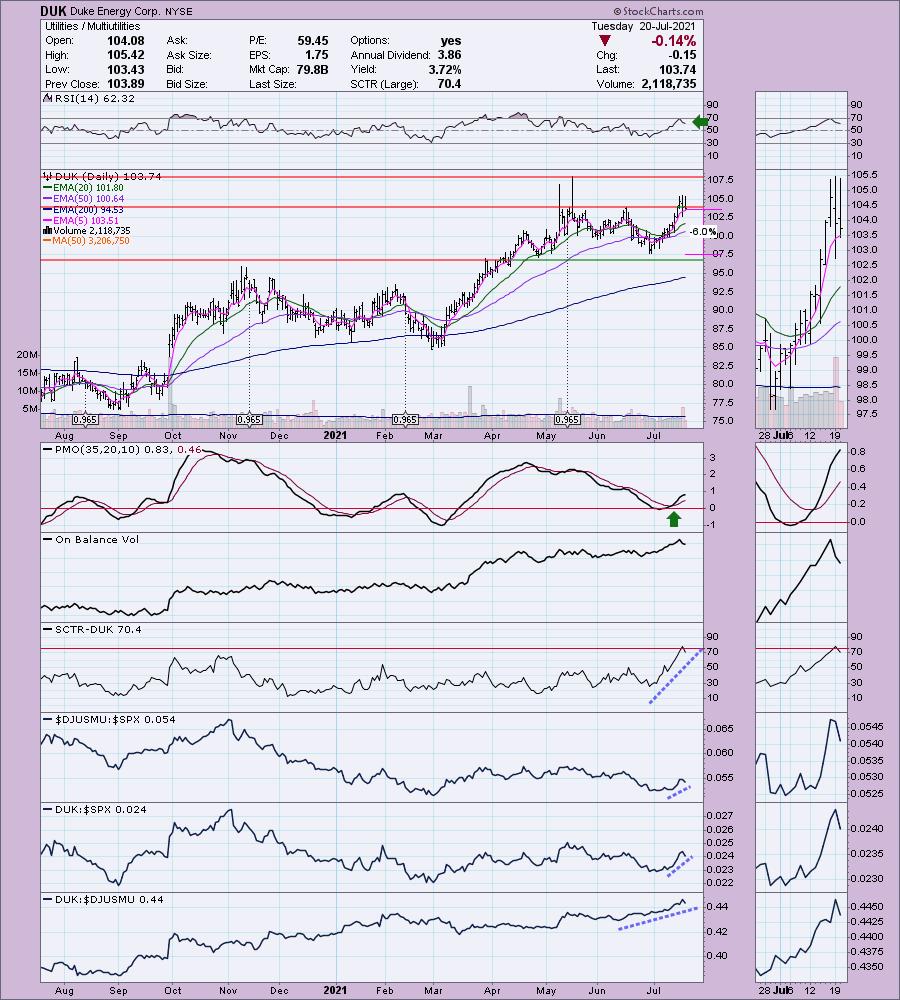
DUK is unchanged in after hours trading. I covered DUK in the January 14th 2021 Diamonds Report. The stop was never hit so the position is currently up +13.2%. I like it again. This has the highest stop level of all "Diamonds in the Rough" today and that is at a comfortable 6%. You'll also notice the high yield. Had you owned it since 1/14/2021, you'd have already been paid two $0.965 dividends. This one has pulled back the last two days to the 5-EMA and prior resistance at the June top. This took the RSI out of overbought territory. The PMO is currently on a BUY signal and notice that the OBV is confirming the current rally. Relative performance is excellent, although it was damaged slightly Friday and Monday.
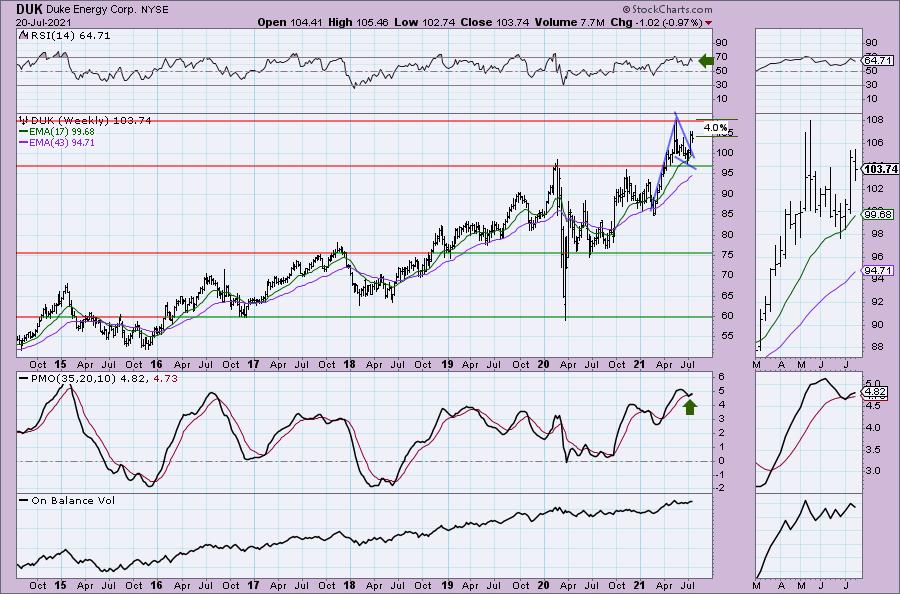
I see bull flag with a bullish falling wedge as the flag. Last week it executed the patter with the breakout from that falling wedge. The weekly RSI is positive and not overbought. The weekly PMO looks very good as it whipsawed back into a crossover BUY signal.
Flowers Foods, Inc. (FLO)
EARNINGS: 8/5/2021 (AMC)
Flowers Foods, Inc. engages in the manufacture and sale of bakery products. The firm offers bakery foods for retail and food service customers in the United States. Its brands include Nature's Own, Dave's Killer Bread, Wonder, Canyon Bakehouse, Tastykake and Mrs. Freshley's. The company was founded by William Howard Flowers, Sr. and Joseph Hampton Flowers, Jr. in 1919 and is headquartered in Thomasville, GA.
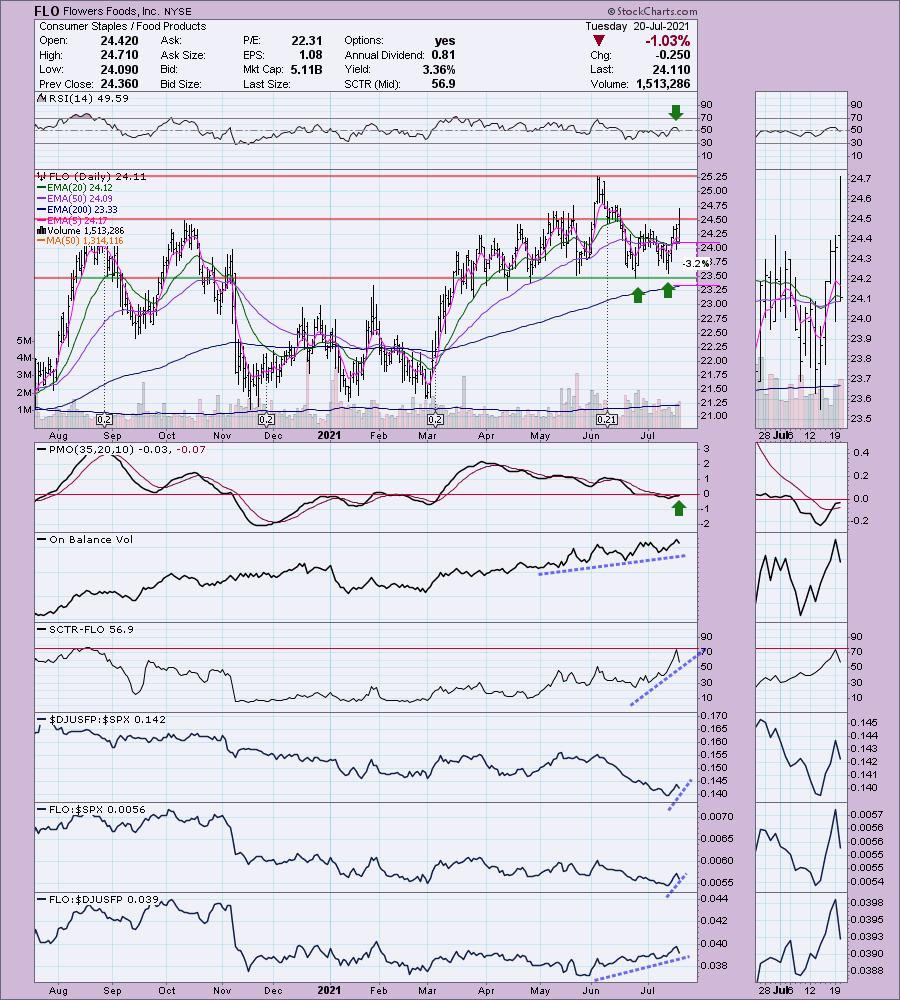
FLO is unchanged in after hours trading. I've covered this one twice before on April 15th, 2020 (stop never hit so up a modest +6.26%) and May 13th, 2020 (stop never hit so position is up +6.6% gain). I selected this as my "Diamond of the Week" for the DecisionPoint Show yesterday. I wasn't thrilled with the pullback today, but it really hasn't damaged the chart too much. The RSI did dip into negative territory, but the PMO still okay. Relative performance was damaged somewhat, but overall it is in a rising trend. Because it dropped today, the stop can be set thinly at only 3.2%. It also has a 3.6% yield!
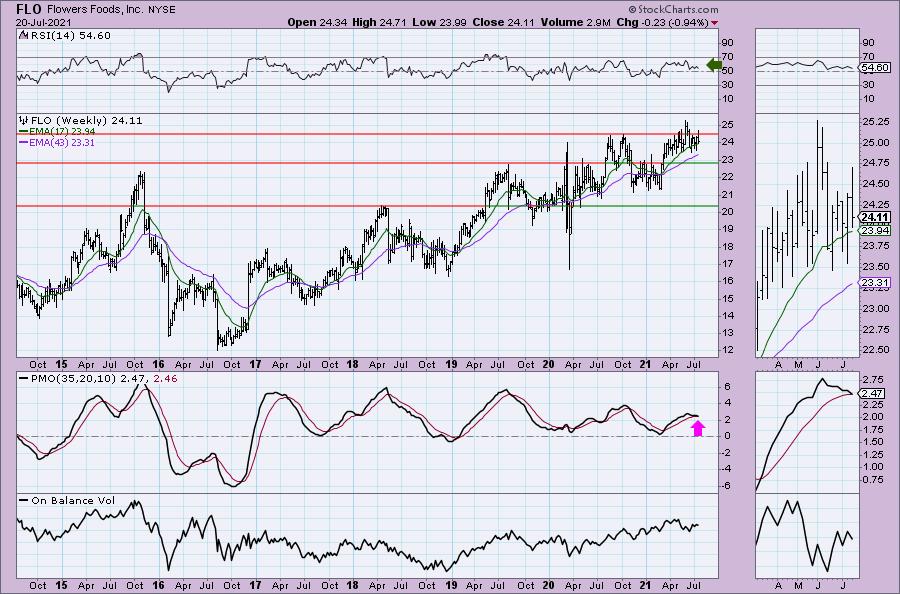
The weekly chart isn't that great given the upcoming PMO crossover SELL signal, but the RSI is still positive. Since it's at new all-time highs, we do not have an upside target at a resistance level to rely on. I would set the upside target at 3x the stop level (since it is thin) at 15%.
Mondelez International, Inc. (MDLZ)
EARNINGS: 7/27/2021 (AMC)
Mondelez International, Inc. engages in the manufacture and marketing of snack food and beverage products. It operates through the following geographical segments: Latin America; Asia, Middle East, and Africa; Europe; and North America. Its products include beverages, biscuits, chocolate, gum & candy, cheese & grocery and meals. Its brands include but not limited to Nabisco, Oreo, and LU biscuits; Cadbury, Cadbury Dairy Milk, and Milka chocolates; and Trident gum. The company was founded by James Lewis Kraft in 1903 is headquartered in Chicago, IL.
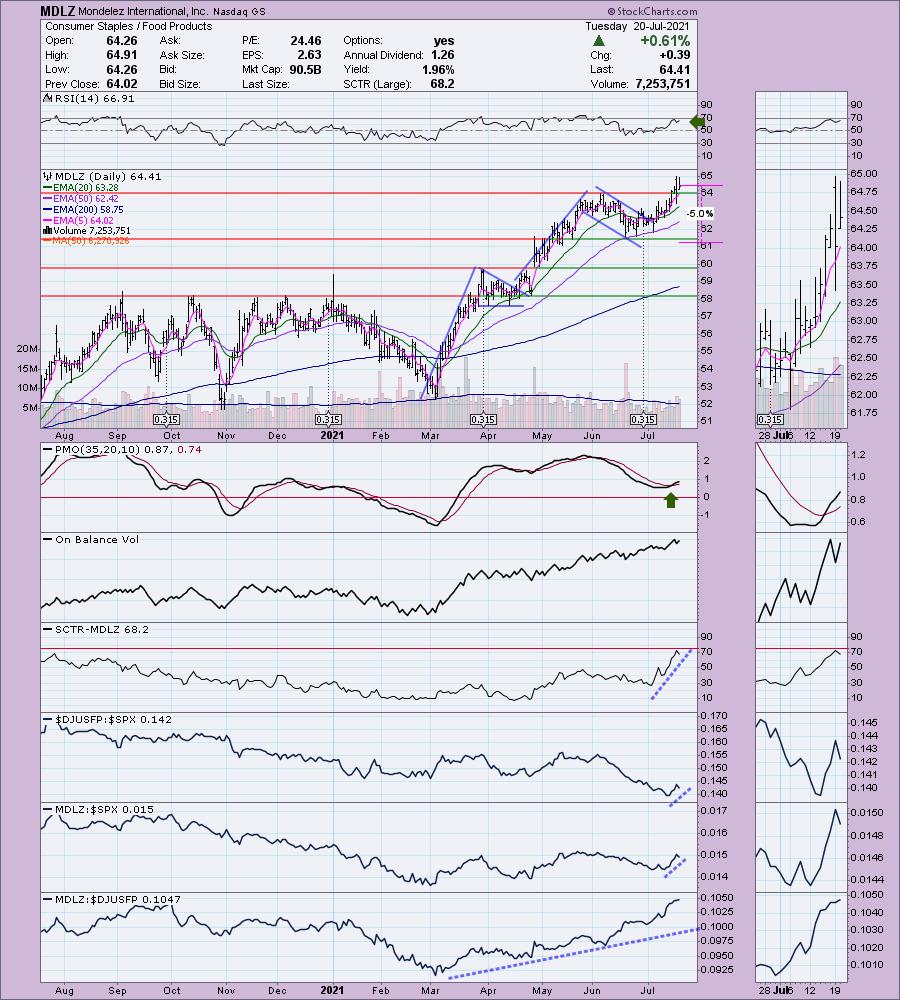
MDLZ is up +0.42% in after hours trading. The yield is nearly 2%. Yesterday it broke out intraday but pulled back below overhead resistance. Today it traded above resistance all day. There was a flag that came out of the March low that executed and hit the upside target. We now have another flag breakout with a minimum upside target around $70. The RSI is positive and the PMO just triggered a crossover BUY signal. The SCTR has made marked improvement and relative strength is picking up for the group and MDLZ has been outperforming the group since it came out of that March low. It is also beginning to outperform the SPX. You can set a thin stop at about 5%.
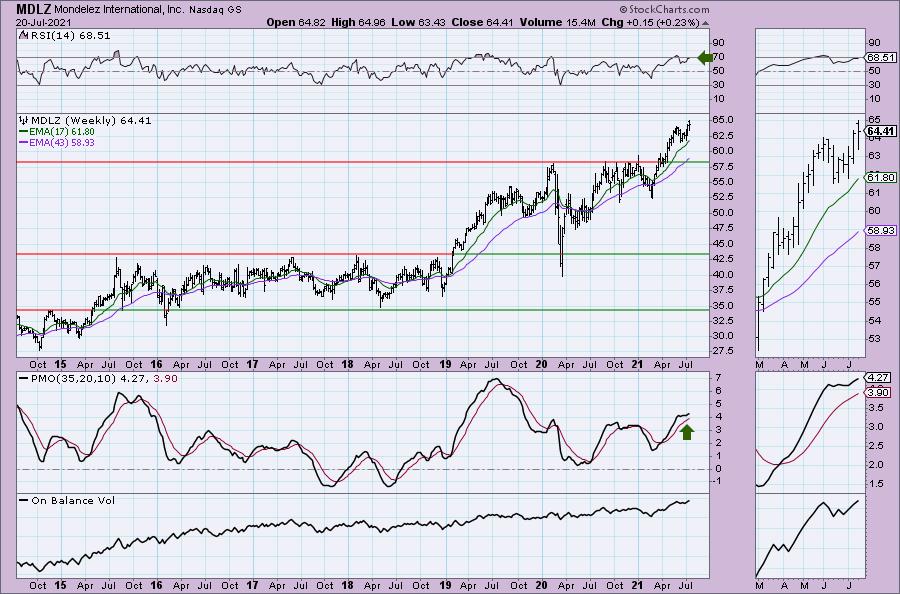
The weekly chart looks good with a weekly RSI that is positive, although getting a bit overbought, and a weekly PMO that has bottomed above the signal line which is especially bullish. Remember the minimum upside target is about $70 for the flag (8.68% gain), but I would look for it to move past that.
Pinnacle West Cap Corp. (PNW)
EARNINGS: 8/5/2021 (BMO)
Pinnacle West Capital Corp. is a holding company, which engages in providing energy and energy-related products. It offers regulated retail and wholesale electricity businesses and related activities, such as electricity generation, transmission and distribution through its subsidiary, Arizona Public Service Co. The company was founded on February 20, 1985 and is headquartered in Phoenix, AZ.
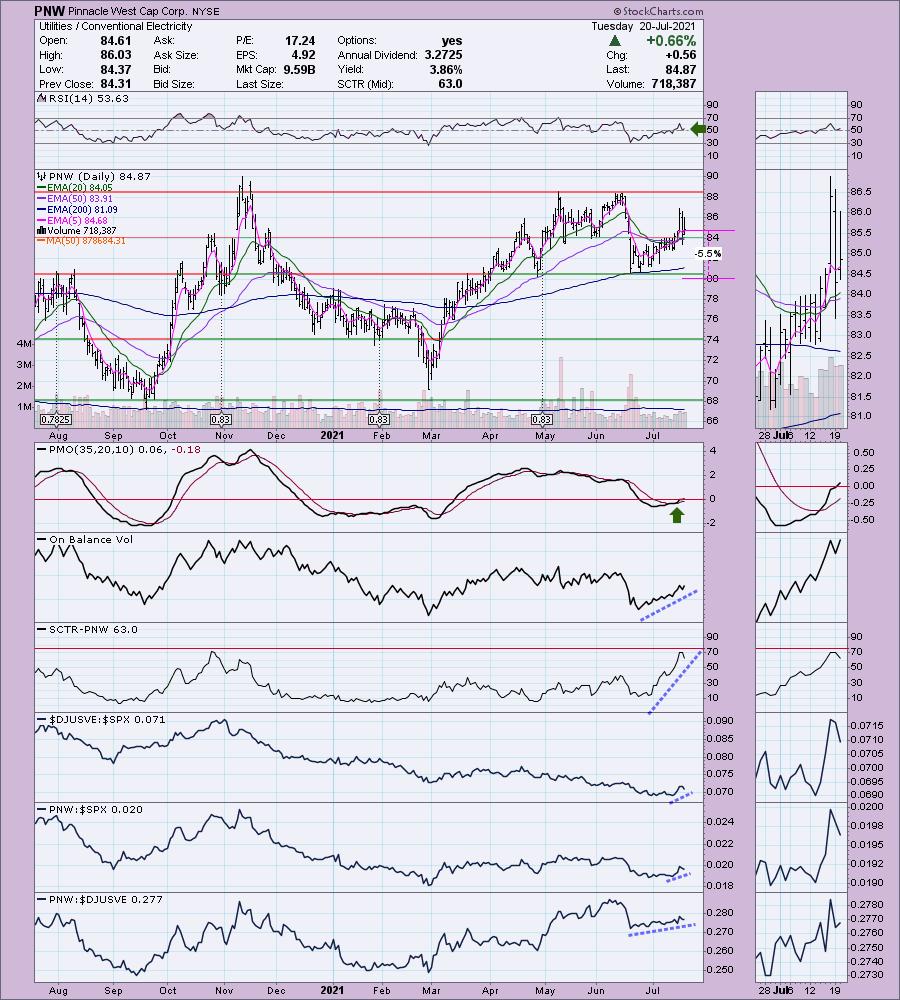
PNW is up +0.15% in after hours trading. This one broke out above resistance and then pulled back to the breakout point. The RSI stayed positive through this and is rising again. The PMO is on a BUY signal and has crossed above the zero line. As with a few stocks, relative strength against the SPX took a hit, but there is a rising trend in relative strength indicators. I particularly like that this one typically outperforms its industry group. This is from the "industry group to watch" that I wrote about on Friday. You'll note a nice 3.86% yield and a thin 5.5% stop level.
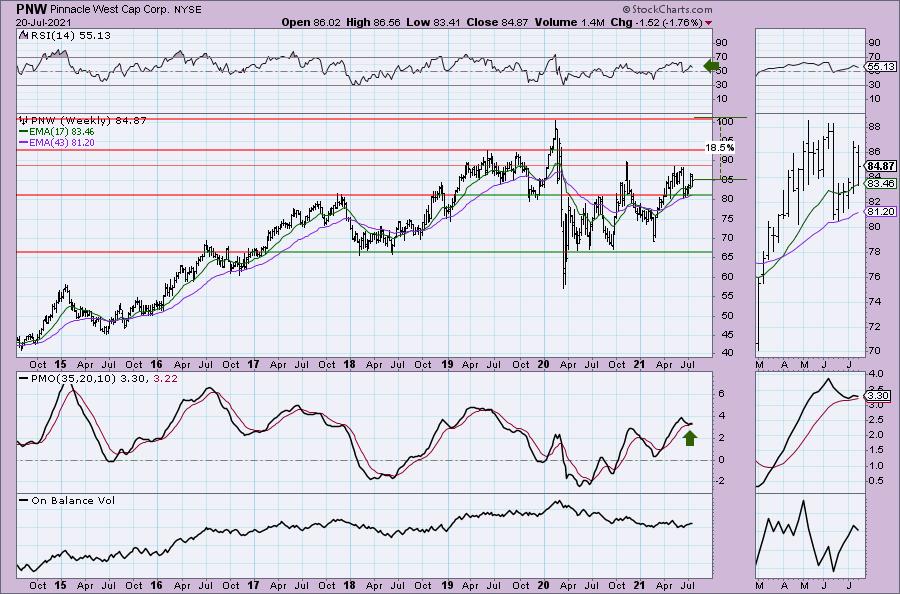
The weekly chart is favorable with a positive weekly RSI and a PMO that has bottomed above the signal line. Upside potential is good at 18.5%.
Join me at Synergy Trader's educational event featuring top analysts sharing their "Favorite Indicators". I'll be doing my presentation on:
"Under the Hood" Indicators
If you haven't registered for my free webinar tomorrow at 7:00p ET, it is time to do so! I will discussing my "favorite indicators" and giving you more tips on properly timing your entries and exits. As always your support is greatly appreciated! Recordings will be sent by them, so they only go to those who register. So Register HERE asap!
Don't forget, on Thursdays I look at reader-requested symbols, so shoot me an email at erin@decisionpoint.com. I read every email I receive and try to answer them all!
Current Market Outlook:
Market Environment: It is important to consider the odds for success by assessing the market tides. The following chart uses different methodologies for objectively showing the depth and trend of participation for intermediate- and long-term time frames.
- The Silver Cross Index (SCI) shows the percentage of SPX stocks on IT Trend Model BUY signals (20-EMA > 50-EMA)
- The Golden Cross Index (GCI) shows the percentage of SPX stocks on LT Trend Model BUY signals (50-EMA > 200-EMA)
- The Bullish Percent Index (BPI) shows the percentage of SPX stocks on Point & Figure BUY signals.
Don't forget that as a "Diamonds" member, you have access to our GCI/SCI curated ChartList on DecisionPoint.com. You'll find it under "Members Only" links on the left side on the Blogs and Links Page.
Here is the current chart:
Full Disclosure: I'm about 35% invested and 65% is in 'cash', meaning in money markets and readily available to trade with.
Technical Analysis is a windsock, not a crystal ball.
Happy Charting!
- Erin
erin@decisionpoint.com
Watch the latest episode of DecisionPoint with Carl & Erin Swenlin on Mondays 7:00p EST or on the DecisionPoint playlist on the StockCharts TV YouTube channel here!
NOTE: The stocks reported herein are from mechanical trading model scans that are based upon moving average relationships, momentum and volume. DecisionPoint analysis is then applied to get five selections from the scans. The selections given should prompt readers to do a chart review using their own analysis process. This letter is not a call for a specific action to buy, sell or short any of the stocks provided. There are NO sure things or guaranteed returns on the daily selection of "Diamonds in the Rough."
Helpful DecisionPoint Links:
DecisionPoint Shared ChartList and DecisionPoint Chart Gallery
Price Momentum Oscillator (PMO)
Swenlin Trading Oscillators (STO-B and STO-V)
For more links, go to DecisionPoint.com