
Today's Reader Request Diamonds Report is using reader requests that were sent in last week. I was unable to do the Thursday report due to attendance at our niece's graduation that day.
I'll also be making up one of the "Diamond Mine" trading rooms that I'll miss on vacation THIS WEDNESDAY--same time, same bat channel. The registration information is below.
Let me just say that many of the requests from last week looked quite good when I reviewed them today, but I picked the ones that look the best moving forward. As always, they are not 'sure things', but the set-ups are nice.
My choice today is O'Reilly Auto Parts (ORLY). The chart is looking fantastic and the group is beginning to outperform.
Finally, I WILL be doing Reader Requests again this Thursday so send them over! So many of your request so many symbols during the trading rooms, send them my way for the Thursday reports!
Today's "Diamonds in the Rough" are: AMD, KKR, ORLY, TRHC and VERO.
Stocks/ETFs to Review (no order): IHI, ISRG, NRG, FUBO, TM, BNGO, KOS, and OXY.
** UPCOMING VACATION - June 28th to July 9th **
It's that time of year again! Last year it was a road trip to Alabama and back, this year it is a road trip to Utah and back! We plan on dropping in Las Vegas, Zion, Spanish Fork, Bryce Canyon, back to the Grand Canyon, Bull Head City and finally back home. I'll include my travel diary and pictures just like last year for Diamonds readers!
I plan on writing, but trading rooms will be postponed until I return home. Blog articles may be delayed depending on WIFI service and/or our travel for the day. You'll miss two Diamond Mines (I'll make them up in the coming weeks).
 Diamond Mine Information:
RECORDING LINK:
Topic: DecisionPoint Diamond Mine (06/18/2021) LIVE Trading Room
Start Time : Jun 18, 2021 08:59 AM
6/18 Diamond Mine Recording Link.
Access Passcode: June-18th
REGISTRATION FOR WEDNESDAY Diamond Mine:
When: Jun 23, 2021 09:00 AM Pacific Time (US and Canada)
Topic: BONUS DecisionPoint Diamond Mine Wednesday (6/23)
Register in advance for Wednesday's Diamond Mine webinar HERE.
REGISTRATION FOR FRIDAY Diamond Mine:
When: Jun 25, 2021 09:00 AM Pacific Time (US and Canada)
Topic: DecisionPoint Diamond Mine (6/25) LIVE Trading Room
Register in advance for FRIDAY's webinar HERE
Save the registration confirmation email with login instructions in case Zoom doesn't notify you in time.
Free DP Trading Room RECORDING LINK:
Topic: DecisionPoint Trading Room
Start Time : Jun 14, 2021 09:00 AM
Free DP Trading Room Recording LINK.
Access Passcode: June/14th
For best results, copy and paste the access code to avoid typos.
Welcome to DecisionPoint Daily Diamonds, wherein I highlight five "diamonds in the rough." These are selected from the results of my DecisionPoint scans, which search for stocks that could benefit from the trend and condition of the market. Remember, these are not recommendations to buy or sell, but are the most interesting of the stocks that surfaced in my scans. My objective is to save you the work of the initial, tedious culling process, but you need to apply your own analysis to see if these stocks pique your interest as well. There are no guaranteed winners here!
Advanced Micro Devices, Inc. (AMD)
EARNINGS: 7/27/2021 (AMC)
Advanced Micro Devices, Inc. engages in the provision of semiconductor businesses. It operates through the following segments: Computing & Graphics, and Enterprise, Embedded and Semi-Custom. The Computing and Graphics segment includes desktop and notebook processors and chipsets, discrete and integrated graphics processing units, data center and professional GPUs and development services. The Enterprise, Embedded and Semi-Custom segment includes server and embedded processors, semi-custom System-on-Chip products, development services and technology for game consoles. The company was founded by W. J. Sanders III on May 1, 1969 and is headquartered in Santa Clara, CA.
AMD is down -0.05% in after hours trading. I covered AMD twice in 2020, April 14th 2020 (stop never hit, up 50.4% since) and October 1st 2020 (stop never hit, down -2.7% since). AMD was set up a bit better when this one was requested, but given today's pullback, it looks pretty good. At this point, price broke out of the trading range on Thursday and then formed a "pig's ear". These patterns will usually see a pullback and we got it today. Price remained above that trading range which is bullish and could be a great place to see AMD bounce back. The RSI is positive, the PMO is rising despite today's decline. AMD has performed well against the SPX, but it clearly doesn't hold a leadership role within the industry group right now. Still it looks good for a possible short-term play, mainly because you can set a tight stop. Even 6% is rather deep given the 200-EMA is generally a good place for a stop.
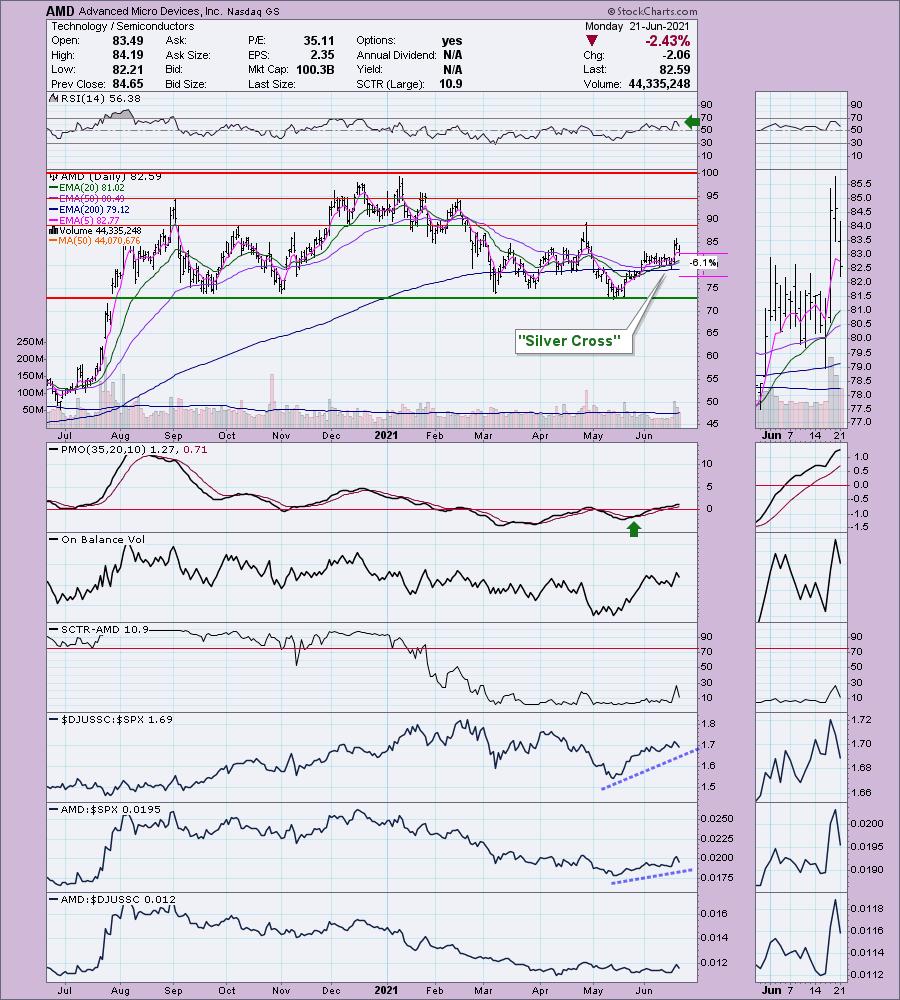
The weekly chart is good and bad. Bad would be the possible head and shoulders and rounded top. Good would be a newly positive RSI and the weekly PMO is turning up. We could see a move back to all-time highs which would be a tidy 20%+ profit.
KKR & Co Inc (KKR)
EARNINGS: 8/3/2021 (BMO)
KKR & Co., Inc. engages in the provision of investment and private equity asset management services. It manages investments across multiple asset classes includes private equity, energy, infrastructure, real estate, credit, and hedge funds. The firm operates business through four business lines: Private Markets, Public Markets, Capital Markets, and Principal Activities. The Private Markets line manages and sponsors a group of private equity funds that invest capital for long-term appreciation, either through controlling ownership of a company or strategic minority positions. The Public Markets line operates combined credit and hedge funds platforms. The Capital Markets line comprises of global capital markets business. It implements traditional and non-traditional capital solutions for investments or companies seeking financing. The Principal Activities line manages the firm's assets and deploys capital to support and grow the businesses. The company was founded by Henry R. Kravis and George R. Roberts in 1976 and is headquartered in New York, NY.
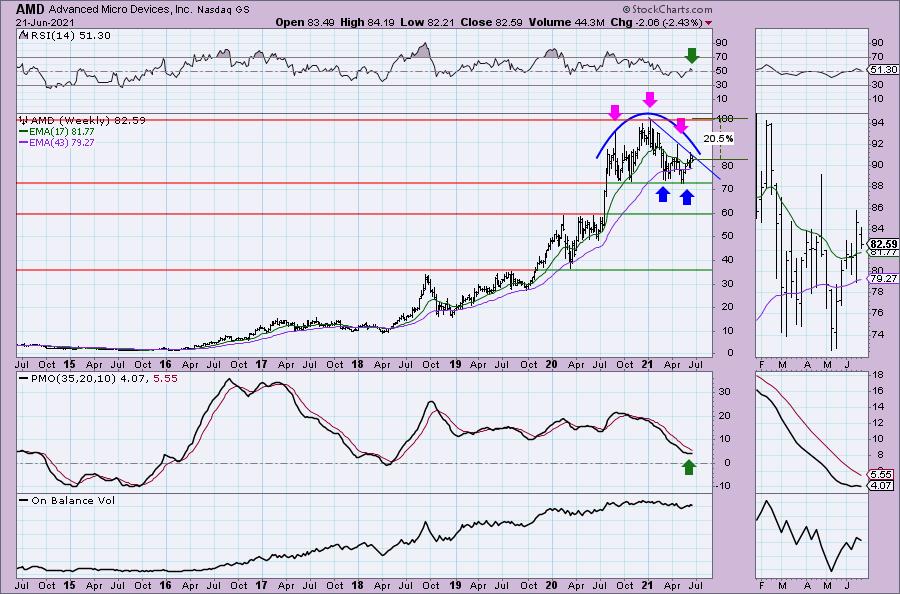
KKR is up +0.09% in after hours trading. This was my favorite of the reader requests. The RSI is positive on today breakout move with the PMO triggered a new crossover BUY signal. The OBV isn't telling us a whole lot, but the SCTR has been in the "hot zone" above 75 for months. This means it has been in the top quartile among all mid-cap stocks. The group is doing well against the SPX and KKR is beginning to outperform the SPX as well. It isn't a great choice based on relative performance to the industry group, but I'm mostly interested in its performance against the SPX (we all want to do better than the benchmark index). The stop can be set thinly at 7.6%.

Not surprisingly, the weekly PMO is topping. The weekly RSI is overbought (although it has been overbought for weeks with not much damage. This does look "flag like". I would expect to see it break out here.
O'Reilly Automotive, Inc. (ORLY)
EARNINGS: 7/28/2021 (AMC)
O'Reilly Automotive, Inc. owns and operates retail outlets in the United States. It engages in the distribution and retailing of automotive aftermarket parts, tools, supplies, equipment, and accessories in the U.S., serving both professional installers and do-it-yourself customers. The company provides new and remanufactured automotive hard parts, including alternators, starters, fuel pumps, water pumps, brake system components, batteries, belts, hoses, temperature controls, chassis parts and engine parts; maintenance items comprising oil, antifreeze products, fluids, filters, lighting products, engine additives, and appearance products; and accessories, such as floor mats, seat covers, and truck accessories. Its stores offer auto body paint and related materials, automotive tools and professional service provider service equipment. The company stores also offer enhanced services and programs comprising used oil, oil filter and battery recycling; battery, wiper, and bulb replacement; battery diagnostic testing; electrical and module testing; check engine light code extraction; loaner tool program; drum and rotor resurfacing; custom hydraulic hoses; professional paint shop mixing and related materials; and machine shops. Its stores provide do-it-yourself and professional service provider customers a selection of brand name, house brands, and private label products for domestic and imported automobiles, vans, and trucks. O'Reilly Automotive was founded by Charles F. O'Reilly and Charles H. O'Reilly, Sr. in November 1957 and is headquartered in Springfield, MO.
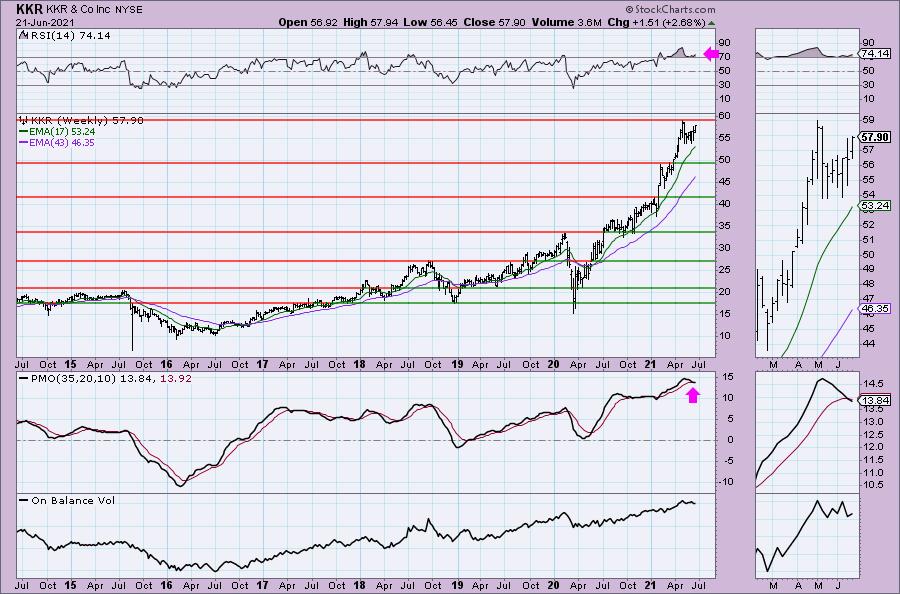
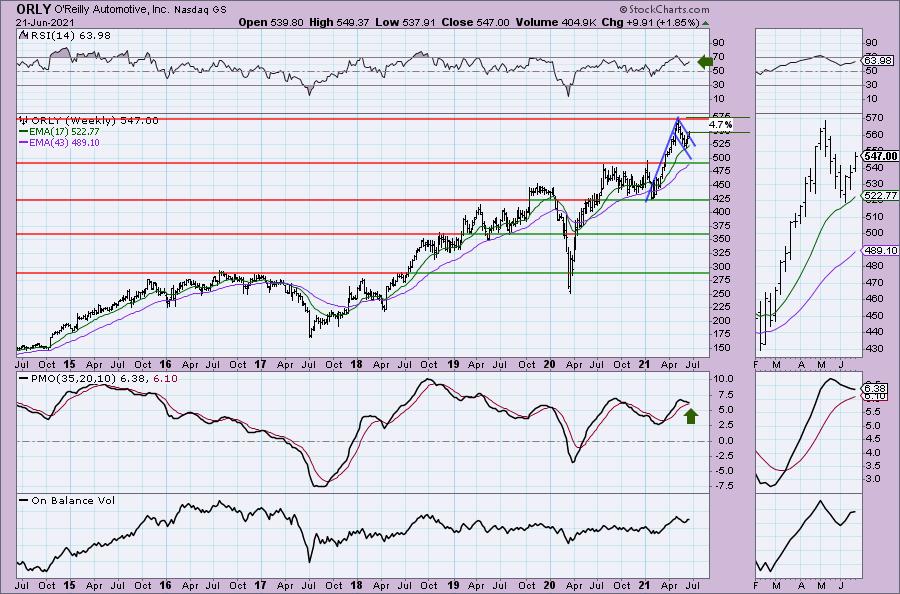
ORLY is unchanged in after hours trading. Price broke out of its declining trend and ORLY soared today. The 5-EMA has just crossed above the 20-EMA for a ST Trend Model BUY signal. The RSI has just moved into positive territory and is not overbought. I very much like the PMO's bottom sitting above the zero line. It is about ready to generate a crossover BUY signal. I like that the group is only now beginning to outperform, new momentum is the sweet spot. ORLY is performing very well against both its group and the SPX. Also another thin stop, that could be made even thinner for protection.
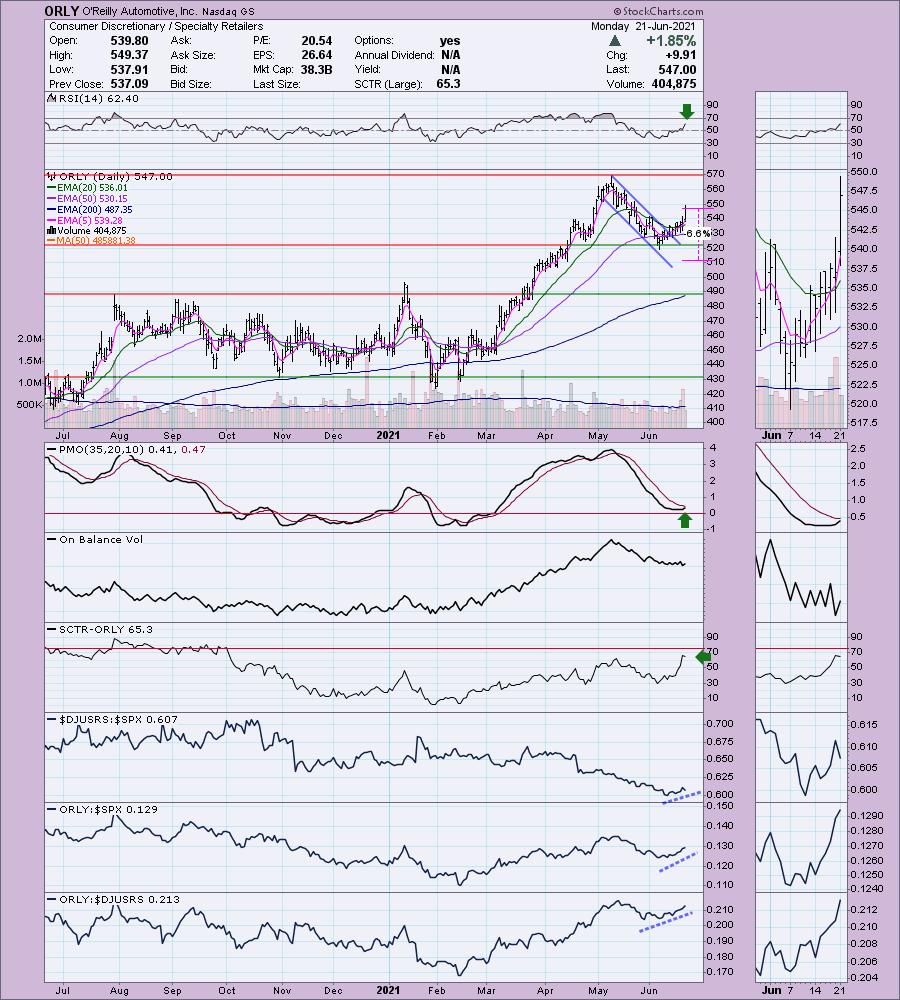
Love seeing the breakout beginning from the bullish flag formation. It's only 4.7% away from its all-time high, but I expect to see it move much higher.
Tabula Rasa HealthCare, Inc. (TRHC)
EARNINGS: 8/3/2021 (AMC)
Tabula Rasa Healthcare, Inc. is a healthcare technology company, which engages in the development of solutions designed for pharmacists, providers, and patients to optimize medication regimens. It operates through the following segments: CareVention HealthCare and MedWise HealthCare. The CareVention HealthCare segment provides services, PACE, which is a center for Medicare & Medicaid services, or CMS, sponsored program providing medical and social services. Its brands include CareKinesis, Capstone Risk Adjustment Services, PACElogic, TruChart, PeakTPA, PersonifilRx, and Pharmastar. The MedWise HealthCare segment provides Medication Therapy Management, or MTM, software and services for Medicare, Medicaid, and commercial health plans, and also provides a cloud-based patient engagement software and services. It offers cloud-based software and clinical pharmacist services through its brands, including MedWise, SinfoníaRx, RxCompanion, PrescribeWellness, and DoseMeRx. The company was founded by Calvin H. Knowlton, Orsula V. Knowlton, and Michael Greenhalgh in April 2009 and is headquartered in Moorestown, NJ.
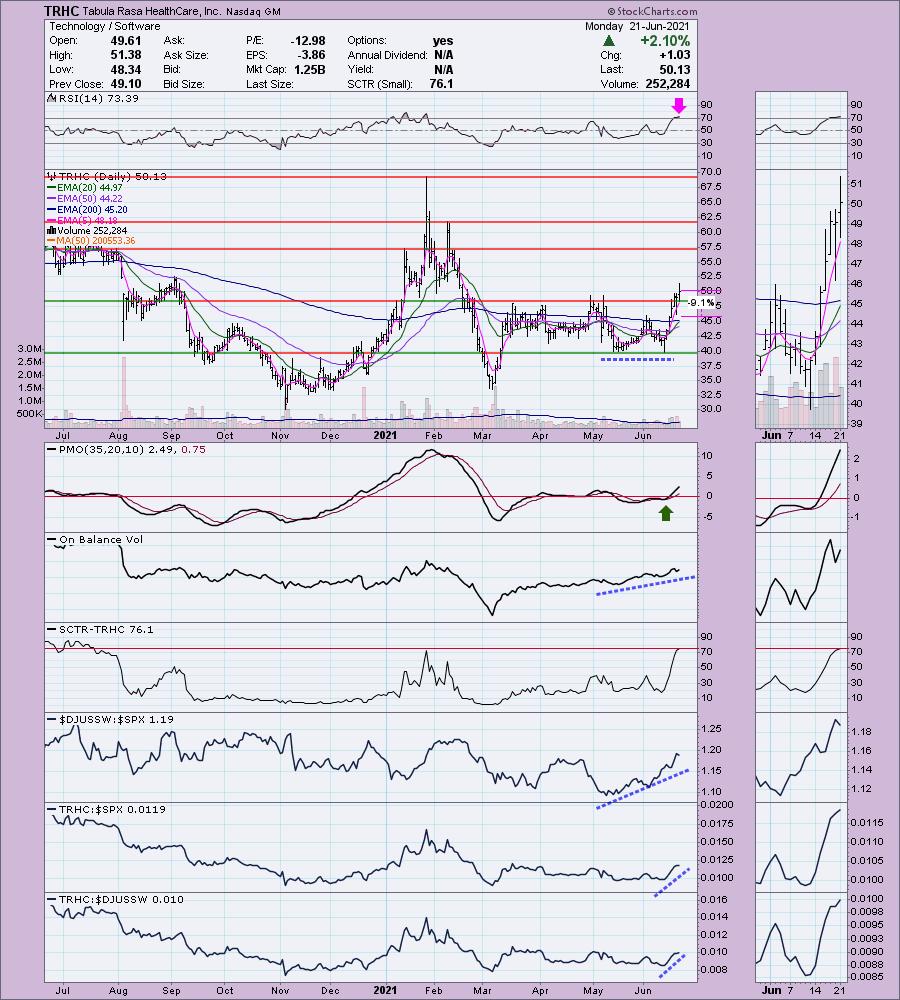
TRHC unchanged in after hours trading. The only bad part of this chart is the overbought RSI. The double-bottom formation looks good and price has broken above the confirmation line (middle of the "W"). It's nearly reached its upside target and with the overbought RSI, be careful. However, the PMO is on a crossover BUY signal and the OBV has a bit of a positive divergence with the price lows of the double-bottom. The SCTR just entered the "hot zone" above 75 and it is performing well, as is the industry group. The stop is deeper than I like, but it takes us down to the confirmation line of the double-bottom.
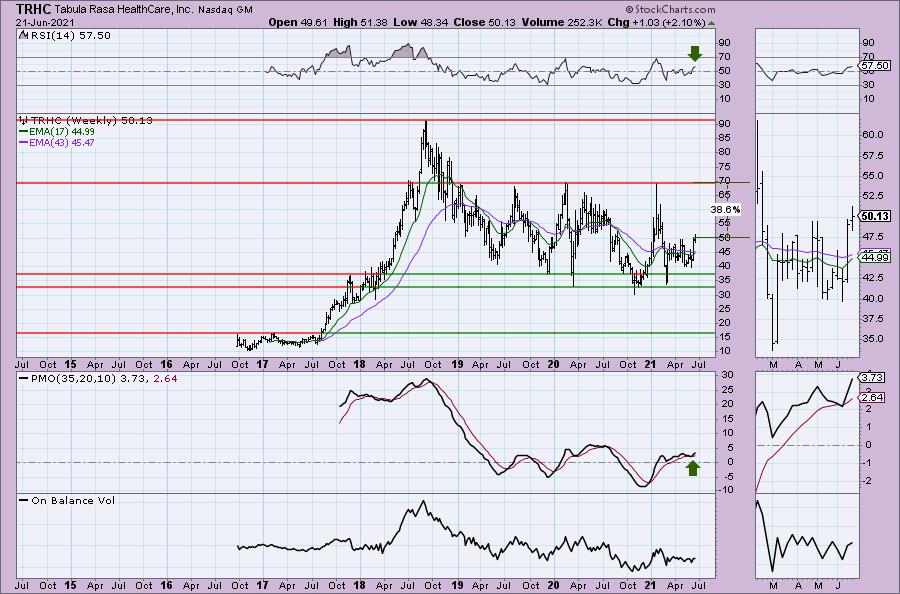
The weekly RSI is positive and rising. The weekly PMO just whipsawed back into a BUY signal and it is not overbought. TRHC has been in a wide trading range and it appears it's ready to test the top of that channel.
Venus Concept Inc. (VERO)
EARNINGS: 8/12/2021 (AMC)
Venus Concept, Inc. develops, commercializes and delivers minimally invasive and non-invasive medical aesthetic and hair restoration technologies and related practice enhancement services. Its product portfolio consists of aesthetic device platforms which includes venus versa, venus legacy, venus velocity, venus fiore, venus viva, venus freeze plus, and venus bliss. The company was founded on November 22, 2002 and is headquartered in Toronto, Canada.
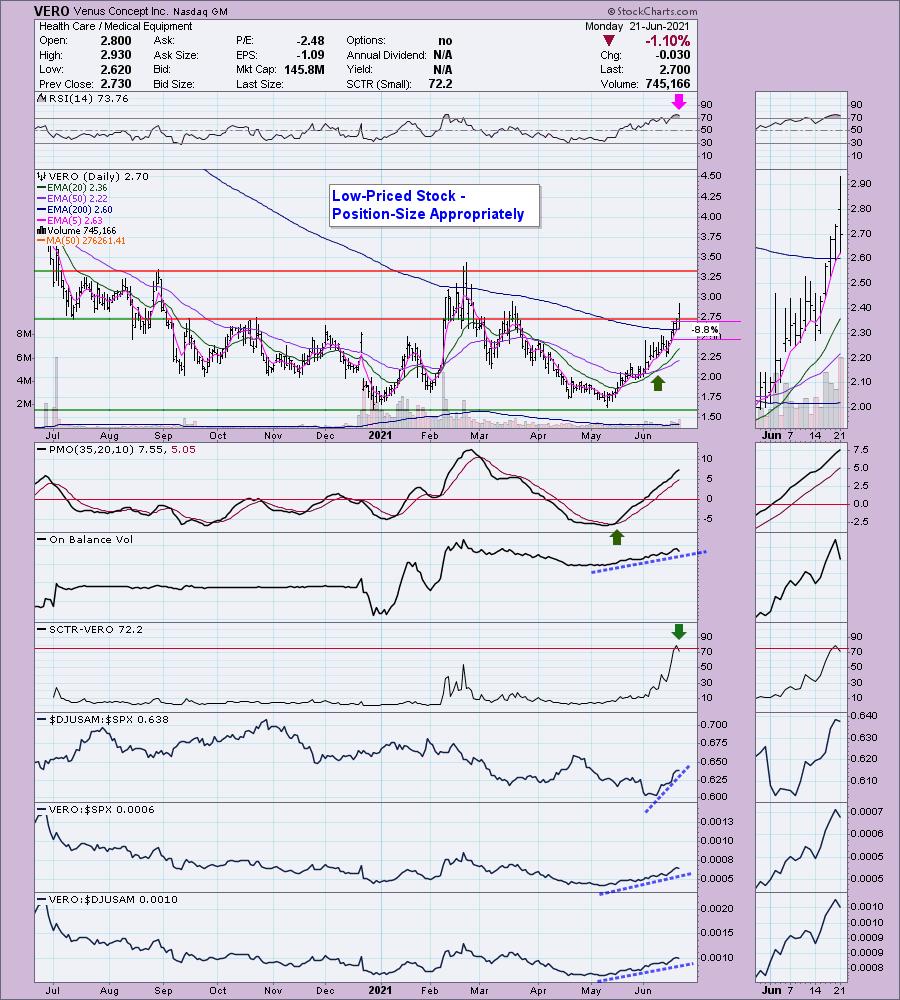
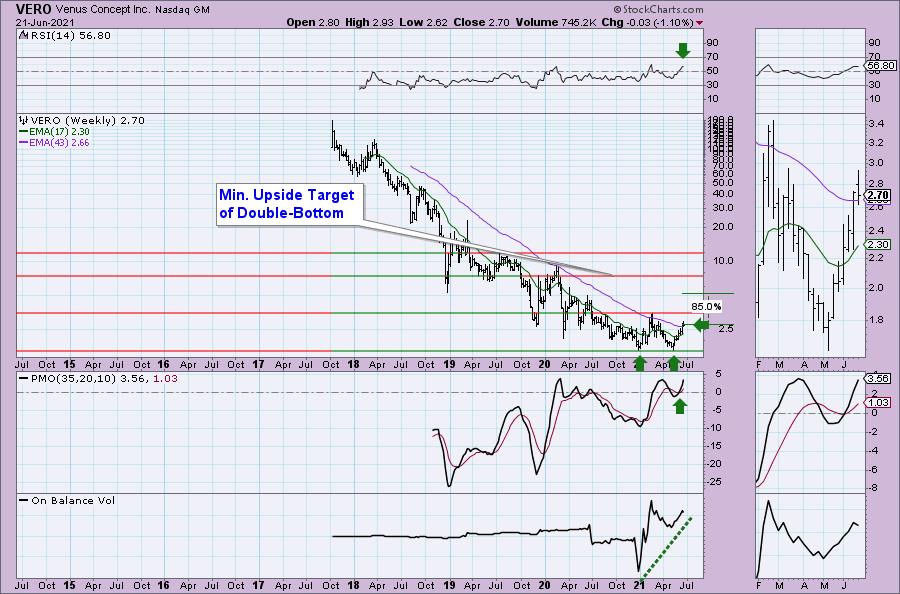
VERO is up +1.48% in after hours trading. The subscriber who presented this was definitely onto something. The RSI is very overbought and today's decline didn't really help to bring it down. The PMO is rising strongly and isn't quite overbought. I like the breakout above the 200-EMA, but I do note that price did fall back below resistance at the close. I like the relative performance. The stop is set below the 200-EMA near the prior June top. Be sure to position size carefully, it is a low-priced stock.
Note: This chart is log-scale. There is a double-bottom that formed on all-time lows. Last week it closed above the 43-week EMA and so far it is holding above that. The weekly PMO is rising on a BUY signal. We don't have a lot of data here so I really couldn't say if this is an overbought reading. I don't believe it is based on the low PMO readings that go to -25. The minimum upside target of the double-bottom is 180%+ away. While that is certainly possible, I opted to set the target on this one to the 2018 low.
Don't forget, on Thursdays I look at reader-requested symbols, so shoot me an email at erin@decisionpoint.com. I read every email I receive and try to answer them all!
Current Market Outlook:
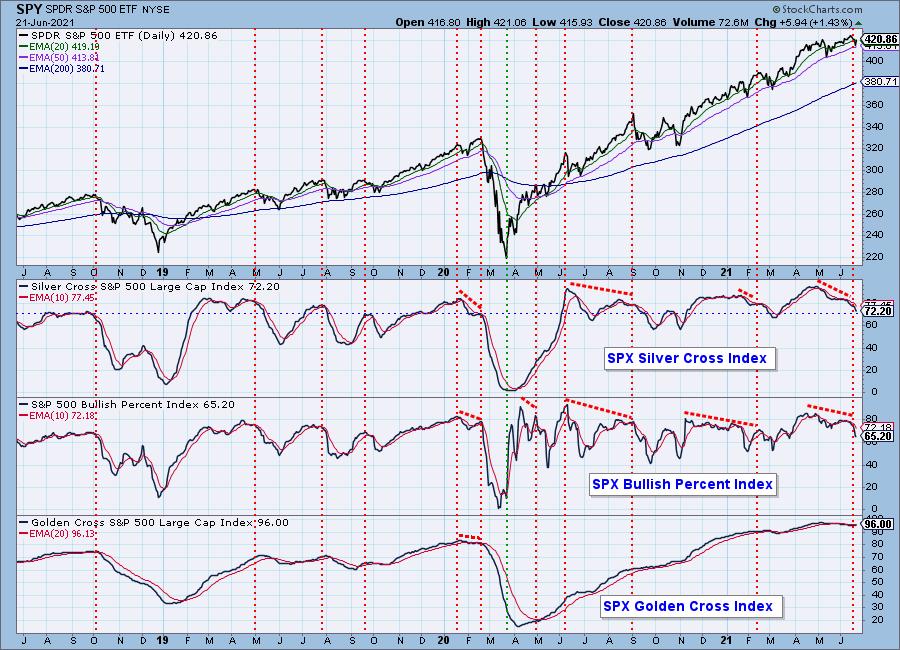
Market Environment: It is important to consider the odds for success by assessing the market tides. The following chart uses different methodologies for objectively showing the depth and trend of participation for intermediate- and long-term time frames.
- The Silver Cross Index (SCI) shows the percentage of SPX stocks on IT Trend Model BUY signals (20-EMA > 50-EMA)
- The Golden Cross Index (GCI) shows the percentage of SPX stocks on LT Trend Model BUY signals (50-EMA > 200-EMA)
- The Bullish Percent Index (BPI) shows the percentage of SPX stocks on Point & Figure BUY signals.
Don't forget that as a "Diamonds" member, you have access to our GCI/SCI curated ChartList on DecisionPoint.com. You'll find it under "Members Only" links on the left side on the Blogs and Links Page.
Here is the current chart:
Diamond Index:
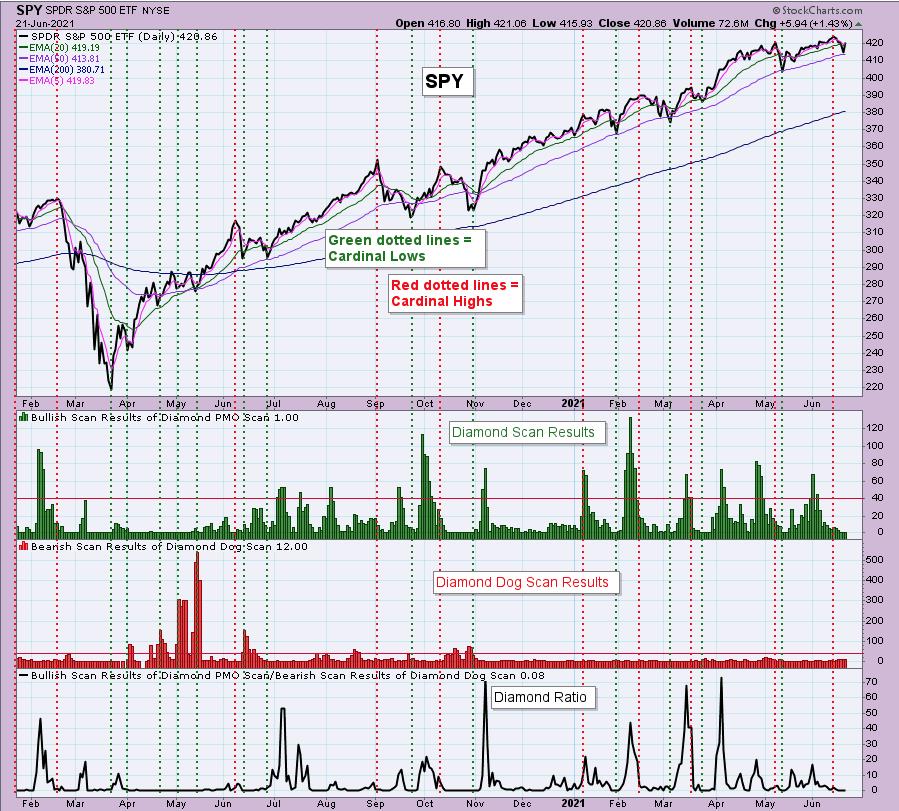
The Diamond Index chart looks at the number of scan results from my bullish Diamond PMO Scan and the number of scan results from the inverse Diamond Dog Scan. The Diamond Ratio divides the bullish results by the bearish results.
I only have data going back to October 2019 so I won't make any sweeping conclusions about the Diamond Index chart. I have marked cardinal tops with red dotted vertical lines and cardinal price bottoms with green dotted vertical lines. I believe that when the Diamond Dog results spike, it usually comes at a price bottom, or marks a strong continuation of the rising trend.
Unfortunately, the Diamond PMO Scan result numbers aren't providing much insight. The Diamond Ratio has promise, but again I don't see a clear correlation to the market tops/bottoms right now. I need to study and manipulate the data some more. Keep you posted!
Full Disclosure: I'm about 50% invested and 50% is in 'cash', meaning in money markets and readily available to trade with.
Technical Analysis is a windsock, not a crystal ball.
Happy Charting!
- Erin
erin@decisionpoint.com
Watch the latest episode of DecisionPoint with Carl & Erin Swenlin on Mondays 7:00p EST or on the DecisionPoint playlist on the StockCharts TV YouTube channel here!
NOTE: The stocks reported herein are from mechanical trading model scans that are based upon moving average relationships, momentum and volume. DecisionPoint analysis is then applied to get five selections from the scans. The selections given should prompt readers to do a chart review using their own analysis process. This letter is not a call for a specific action to buy, sell or short any of the stocks provided. There are NO sure things or guaranteed returns on the daily selection of "diamonds in the rough."
Helpful DecisionPoint Links:
DecisionPoint Shared ChartList and DecisionPoint Chart Gallery
Price Momentum Oscillator (PMO)
Swenlin Trading Oscillators (STO-B and STO-V)
For more links, go to DecisionPoint.com