
While Consumer Discretionary (XLY) wasn't a top five finisher among sectors today, it continues to provide plenty of choice for "Diamonds in the Rough". Not surprisingly, there were many reader requests that came from this sector. I added one of my own, another Restaurant and Bars stock. Yesterday's Diamond, Wingstop (WING) broke out in a big way, as did many of those stocks.
I did include one Biotech that was requested. It is a great chart for learning the power of chart patterns and I think it is lined up to continue to perform.
Tomorrow's Diamond Mine link is right here. We'll have plenty of "Diamonds in the Rough" to look at since I did an extra day this week! You won't want to miss it. Last week we found Healthcare was showing new momentum and zeroed in on Medical Equipment and Supplies. Those stocks followed through. What sector and industry group will we find tomorrow?
Today's "Diamonds in the Rough" are: ETSY, LB, MGNX and RRGB.
Stocks/ETFs to Review (no order): BC, CLBK, TTD, TTGT, GKOS, JCOM and BE.
** UPCOMING VACATION - June 28th to July 9th **
It's that time of year again! Last year it was a road trip to Alabama and back, this year it is a road trip to Utah and back! We plan on dropping in Las Vegas, Zion, Spanish Fork, Bryce Canyon, back to the Grand Canyon, Bull Head City and finally back home. I'll include my travel diary and pictures just like last year for Diamonds readers!
I plan on writing, but trading rooms will be postponed until I return home. Diamond Report publishing will vary depending on travel and activities, but you WILL get your 10 "Diamonds in the Rough" per week.
TENTATIVE SCHEDULE NEXT WEEK:
Five stocks on Wednesday (6/30), five stocks on Thursday (7/1) and then a Recap on Friday (7/2).
 Diamond Mine Information:
RECORDING LINK Today (6/23):
Topic: BONUS DecisionPoint Diamond Mine Wednesday (6/23)
Start Time : Jun 23, 2021 09:01 AM
6/23 Diamond Mine Recording Link.
Access Passcode: June-23rd
RECORDING LINK (Friday 6/18):
Topic: DecisionPoint Diamond Mine (06/18/2021) LIVE Trading Room
Start Time : Jun 18, 2021 08:59 AM
6/18 Diamond Mine Recording Link.
Access Passcode: June-18th
REGISTRATION FOR FRIDAY Diamond Mine:
When: Jun 25, 2021 09:00 AM Pacific Time (US and Canada)
Topic: DecisionPoint Diamond Mine (6/25) LIVE Trading Room
Register in advance for FRIDAY's webinar HERE
Save the registration confirmation email with login instructions in case Zoom doesn't notify you in time.
Free DP Trading Room RECORDING LINK:
Topic: DecisionPoint Trading Room
Start Time : Jun 14, 2021 09:00 AM
Free DP Trading Room Recording LINK.
Access Passcode: June/14th
For best results, copy and paste the access code to avoid typos.
Welcome to DecisionPoint Daily Diamonds, wherein I highlight five "Diamonds in the Rough." These are selected from the results of my DecisionPoint scans, which search for stocks that could benefit from the trend and condition of the market. Remember, these are not recommendations to buy or sell, but are the most interesting of the stocks that surfaced in my scans. My objective is to save you the work of the initial, tedious culling process, but you need to apply your own analysis to see if these stocks pique your interest as well. There are no guaranteed winners here!
Etsy Inc. (ETSY)
EARNINGS: 8/4/2021 (AMC)
Etsy, Inc. engages in the operation of online marketplace. It offers handmade products such as shoes, clothing, bags, and accessories. It operates through the following geographical segments: United States, United Kingdom, and Other International. The company was founded by Haim Schoppik, Robert Kalin, Jared Tarbell, and Christopher Maguires in 2005 and is headquartered in New York, NY.
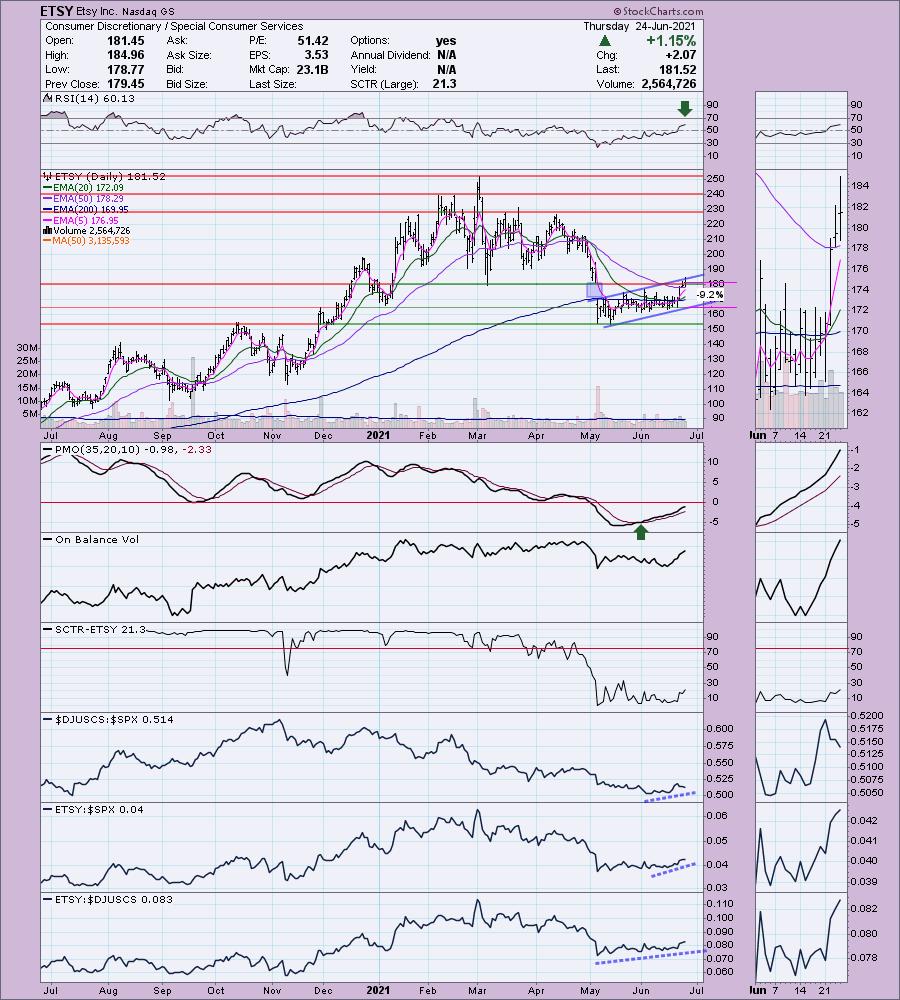
ETSY is up +0.04% in after hours trading. I covered ETSY in the March 10, 2020Diamonds Report. The bear market decline took the position out by activating the 6.8% stop very quickly. If for some reason you had hung onto it, it would be up +213.1%. Those who used to watch the old MarketWatchers LIVE show when SCTV was just getting started, know that I was known for picking ETSY when it was about $14. It flew up to $40 in no time. So every time ETSY came up everyone thought of me for some reason.
Well, it was requested today and I liked the set up. Price broke above gap resistance and price resistance at $180. It is within a rising trend channel, but it is at the top of the channel, so we are vulnerable for a pullback. However, given the positive RSI and PMO on the BUY signal, I expect it to continue higher and steepen its ascent. Volume is definitely coming in. Relative performance is pretty good. I set the stop where price would break down from the rising trend channel.
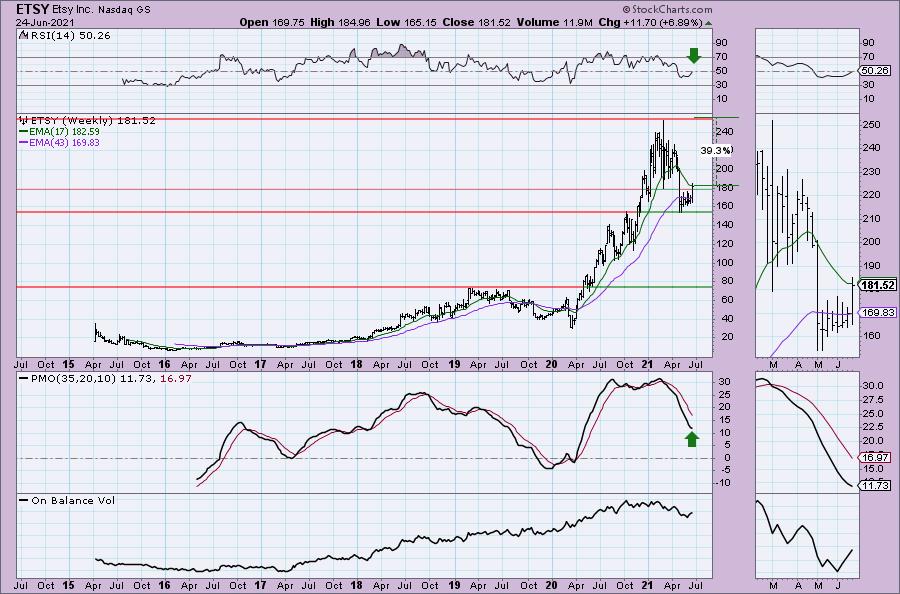
While the weekly PMO may not be optimal, the weekly RSI has just entered positive territory. Price this week broke above resistance at the confirmation line for the big double-top. This one should make it to its all-time high barring a market collapse.
L Brands, Inc. (LB)
EARNINGS: 8/18/2021 (AMC)
L Brands, Inc. engages in the retail of women's intimate and other apparel, personal care, beauty and home fragrance products. It operates through the following segments: Victoria's Secret, Bath & Body Works and Victoria's Secret and Bath & Body Works International. The Victoria's Secret segment sells women's intimate and other apparel, personal care and beauty products under the Victoria's Secret and PINK brand names. The Bath & Body Works segment offers body care, home fragrance products, soaps and sanitizers under the Bath & Body Works, White Barn, C.O. Bigelow and other brand names. The Victoria's Secret and Bath & Body Works International segment includes the Victoria's Secret and Bath & Body Works stores located outside of the U.S. and Canada, as well as the online business in Greater China. The company was founded by Leslie Herbert Wexner in 1963 and is headquartered in Columbus, OH.
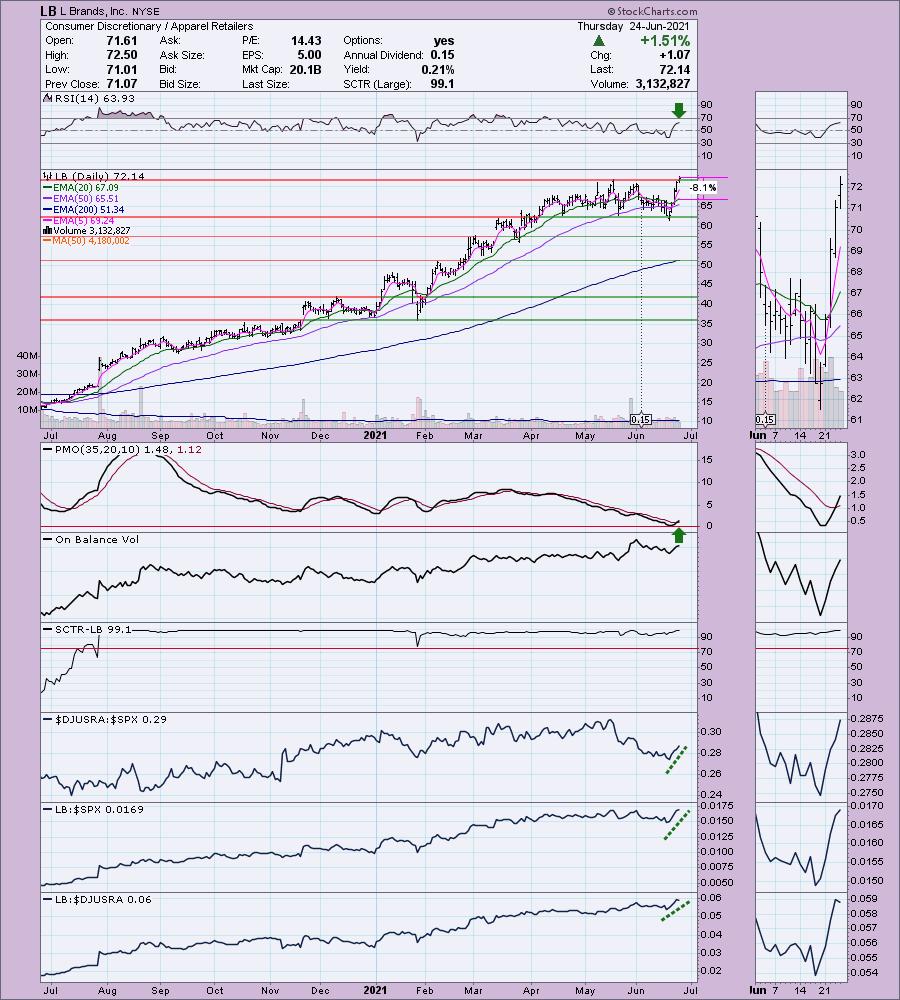
LB is unchanged in after hours trading. Great reader request with a positive RSI and new PMO BUY signal. Today price broke out. Would like to see a higher high on the OBV, but I'll definitely forgive that given the stellar SCTR and outperformance by the group and LB. The stop is my typical 8%. It aligns with the 20/50-EMAs.
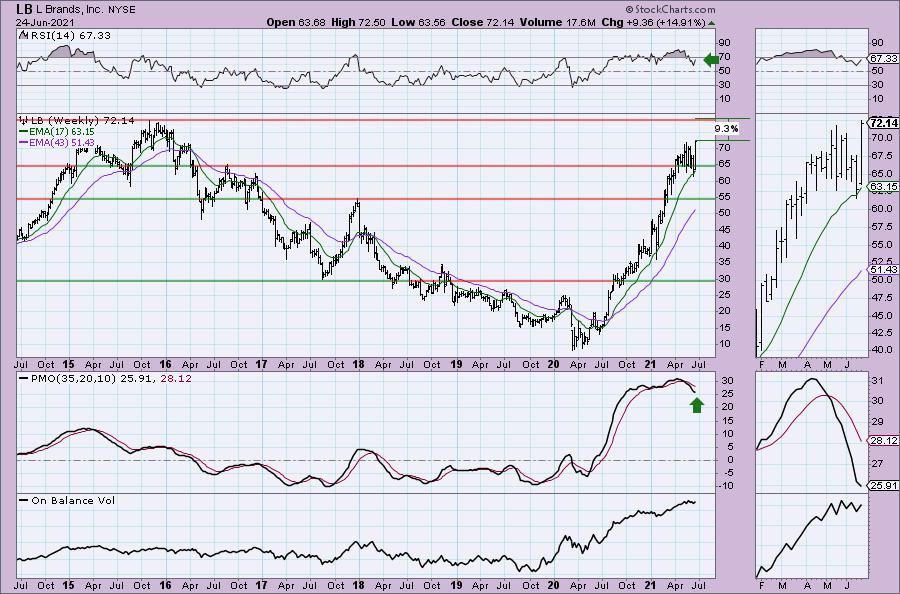
The weekly RSI is positive and not yet overbought. The weekly PMO is on a SELL signal but on this big rally week, it is already beginning to decelerate. Check out this article in Barron's. The analyst believes that LB could double this year. Great reader request. Hope you got in earlier this week!
MacroGenics Inc. (MGNX)
EARNINGS: 7/29/2021 (AMC)
MacroGenics, Inc. is a clinical-stage biopharmaceutical company, which engages in discovering and developing antibody-based therapeutics designed to modulate the human immune response for the treatment of cancer. Its product pipeline includes Margetuximab, Flotetuzumab, Retifanlimab, Enoblituzumab, Tebotelimab, MGC018, MGD019, IMGC936, and MGD014 for infectious diseases. The company was founded by Scott E. Koenig, Jeffrey V. Ravetch, LeRoy E. Hood, Ruedi Aebersold, and Alan Aderem on August 14, 2000 and is headquartered in Rockville, MD.
MGNX is unchanged in after hours trading. I picked this one on April 22 2021 Diamonds Report. It headed about 8% higher into the head of the head and shoulders I have annotated. It fell apart at that point and the 8.9% stop was hit. Notice that seriously textbook head and shoulders pattern. A perfect H&S should have higher volume on the left shoulder than the right. The neckline is almost perfectly horizontal. Unfortunately, if you owned it, by the time the pattern was visible, it had swooped past the neckline. The descent was painful and quick. However, it has now given us an opportunity to grab it on the upswing after bouncing off strong support. The RSI just moved positive and the PMO just triggered a crossover BUY signal. While Biotechs are now underperforming the SPX, MGNX is blowing away the industry group and the SPX as far as performance. There is certainly a chance it won't get past the neckline, but for now it is set up nicely. I would call this current pattern a "V" Bottom. Once it retraces 1/3rd of the price drop, we can expect it to rally past the start of the pattern which is at the right shoulder of the old H&S. The stop is deep, but on a volatile Biotech it's the price you pay for admission. Position size carefully. The stop is set at the January/February tops.
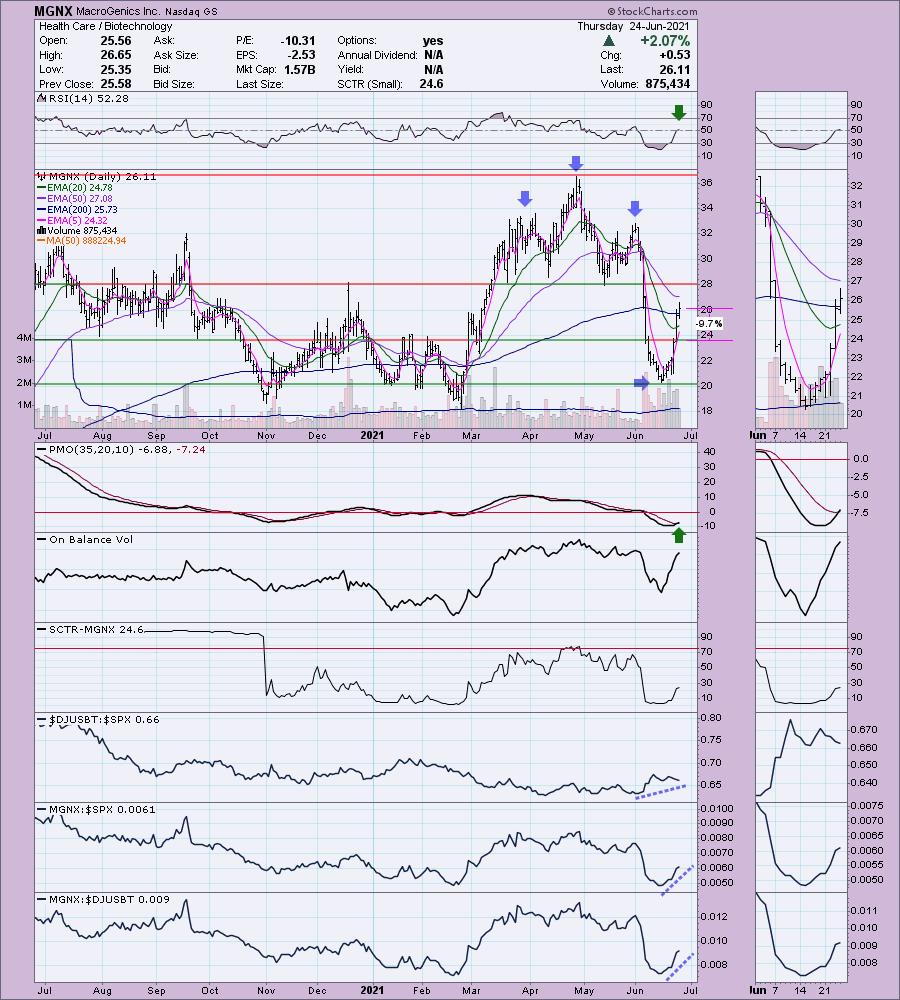
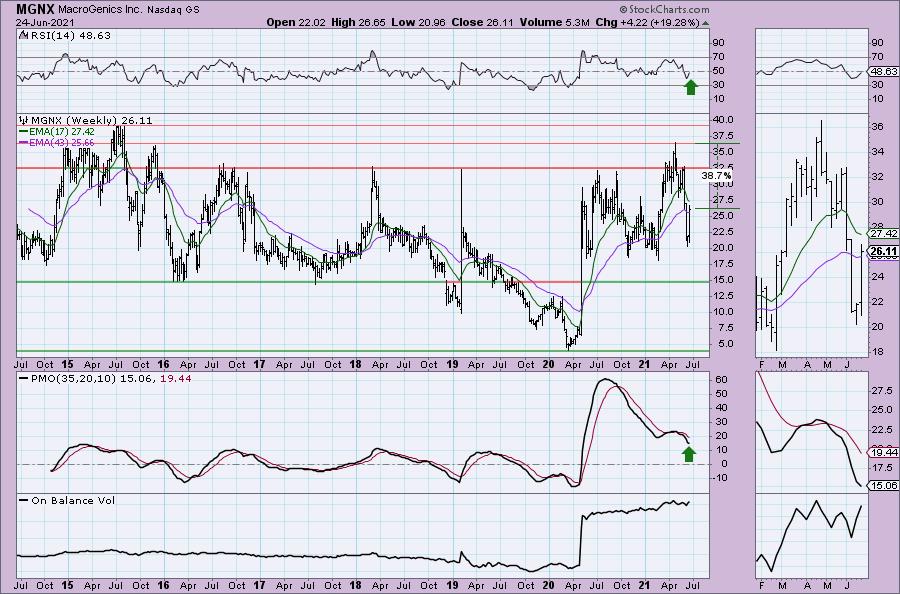
It is bouncing off the late 2020 and early 2021 lows. Today it pushed past the 50-EMA. The RSI is still negative, but the PMO is already showing signs of turning back up. It is a nearly 20% rally this week, so a pullback is entirely possible. Even conservatively, the upside target is nearly 39%. Remember to set a stop on this one.
Red Robin Gourmet Burgers Inc. (RRGB)
EARNINGS: 8/11/2021 (AMC)
Red Robin Gourmet Burgers, Inc. develops, operates, and franchises full-service restaurants North America. It serves a variety of salads, soups, appetizers, other entrees, desserts, signature alcoholic and non-alcoholic beverages. The company was founded in September 1969 and is headquartered in Greenwood Village, CO.
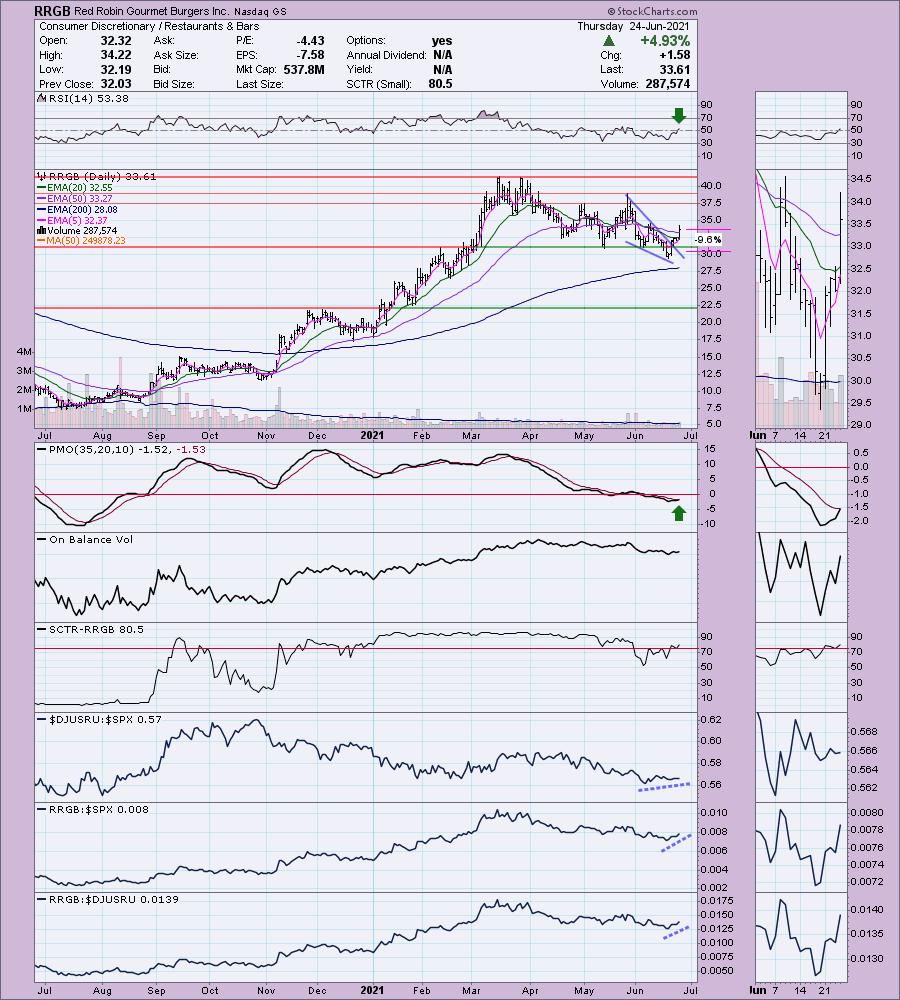
RRGB is down -1.49% in after hours trading. That tells me two things. One, we will have a better entry tomorrow and two, it'll likely show a decline on tomorrow's spreadsheet. There is a breakout from a bullish falling wedge and price broke above both the 20/50-EMAs today. The PMO had a crossover BUY signal today as well. The SCTR has just reentered the "hot zone" above 75. The group is outperforming right now and RRGB is outperforming both the group and the SPX. The stop is somewhat deep at -9.6%, but if you get a better entry, you can certainly lower that.
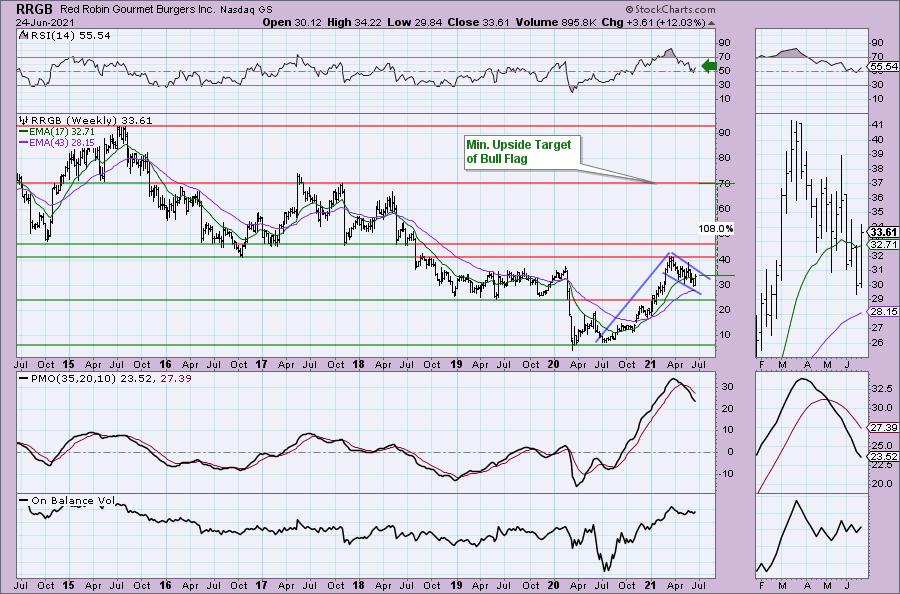
The weekly chart has some work to do as far as turning that PMO around, but the weekly RSI is positive and rising and we have a bullish flag formation. If this pattern resolves upward as it is supposed to, the minimum upside target (calculated by adding the height of the flag pole to breakout point) is at $70 for an over 100% profit. Not sure it will get all the way up there, but even a move to the 2016 low would produce a 23%+ profit.
Don't forget, on Thursdays I look at reader-requested symbols, so shoot me an email at erin@decisionpoint.com. I read every email I receive and try to answer them all!
Current Market Outlook:
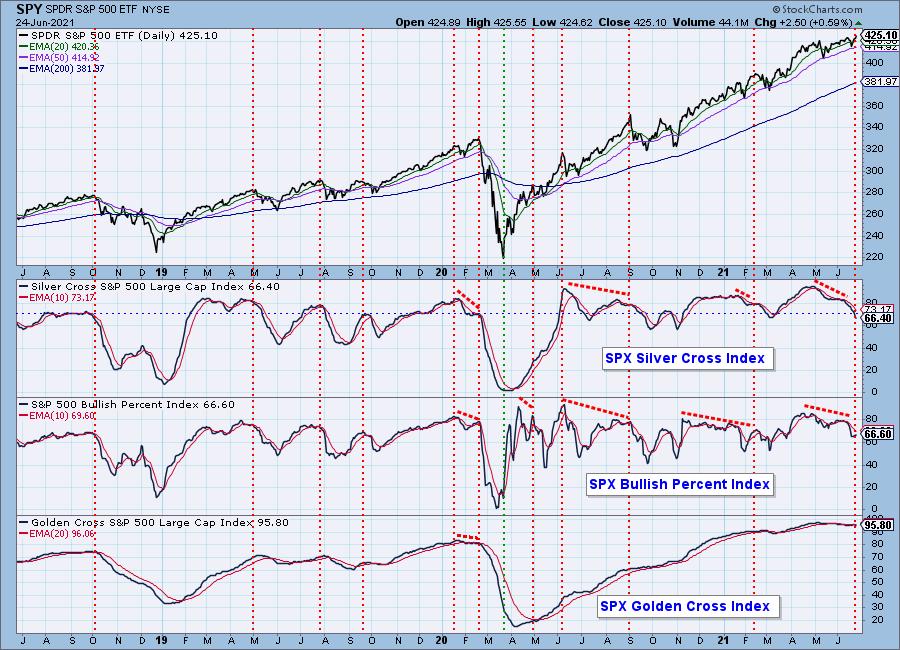
Market Environment: It is important to consider the odds for success by assessing the market tides. The following chart uses different methodologies for objectively showing the depth and trend of participation for intermediate- and long-term time frames.
- The Silver Cross Index (SCI) shows the percentage of SPX stocks on IT Trend Model BUY signals (20-EMA > 50-EMA)
- The Golden Cross Index (GCI) shows the percentage of SPX stocks on LT Trend Model BUY signals (50-EMA > 200-EMA)
- The Bullish Percent Index (BPI) shows the percentage of SPX stocks on Point & Figure BUY signals.
Don't forget that as a "Diamonds" member, you have access to our GCI/SCI curated ChartList on DecisionPoint.com. You'll find it under "Members Only" links on the left side on the Blogs and Links Page.
Here is the current chart:
Diamond Index:
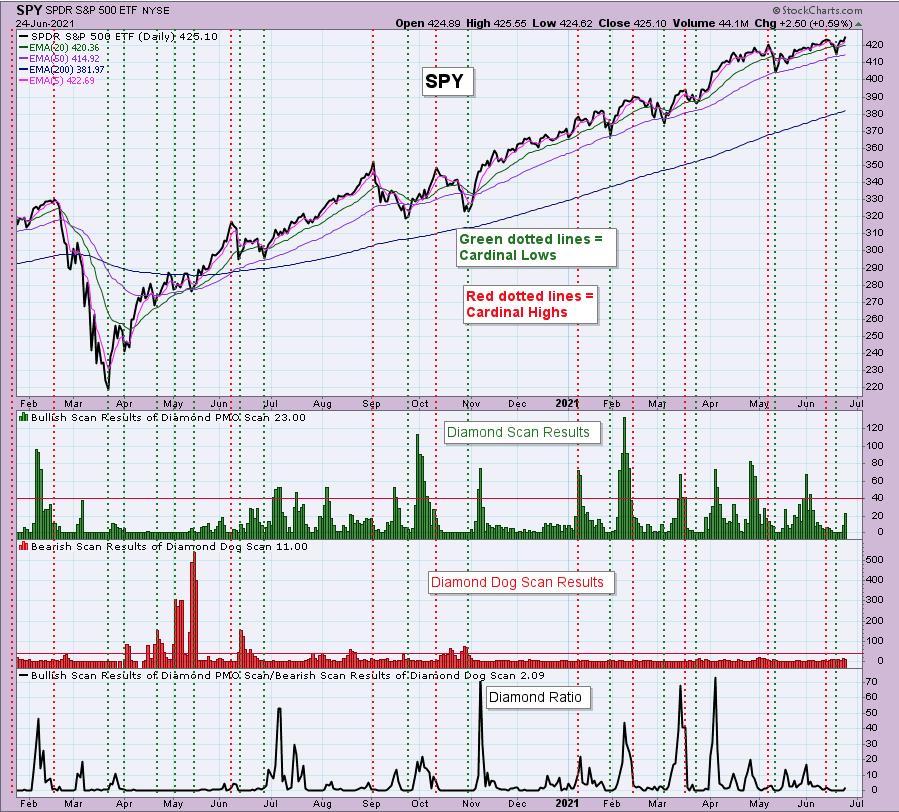
The Diamond Index chart looks at the number of scan results from my bullish Diamond PMO Scan and the number of scan results from the inverse Diamond Dog Scan. The Diamond Ratio divides the bullish results by the bearish results.
I only have data going back to October 2019 so I won't make any sweeping conclusions about the Diamond Index chart. I have marked cardinal tops with red dotted vertical lines and cardinal price bottoms with green dotted vertical lines. I believe that when the Diamond Dog results spike, it usually comes at a price bottom, or marks a strong continuation of the rising trend.
Unfortunately, the Diamond PMO Scan result numbers aren't providing much insight. The Diamond Ratio has promise, but again I don't see a clear correlation to the market tops/bottoms right now. I need to study and manipulate the data some more. Keep you posted!
Full Disclosure: I'm about 50% invested and 50% is in 'cash', meaning in money markets and readily available to trade with. Mostly shuffling my portfolio by adjusting my exposure in certain sectors.
Technical Analysis is a windsock, not a crystal ball.
Happy Charting!
- Erin
erin@decisionpoint.com
Watch the latest episode of DecisionPoint with Carl & Erin Swenlin on Mondays 7:00p EST or on the DecisionPoint playlist on the StockCharts TV YouTube channel here!
NOTE: The stocks reported herein are from mechanical trading model scans that are based upon moving average relationships, momentum and volume. DecisionPoint analysis is then applied to get five selections from the scans. The selections given should prompt readers to do a chart review using their own analysis process. This letter is not a call for a specific action to buy, sell or short any of the stocks provided. There are NO sure things or guaranteed returns on the daily selection of "Diamonds in the Rough."
Helpful DecisionPoint Links:
DecisionPoint Shared ChartList and DecisionPoint Chart Gallery
Price Momentum Oscillator (PMO)
Swenlin Trading Oscillators (STO-B and STO-V)
For more links, go to DecisionPoint.com