
Reader Request Day brought some very interesting stocks to the table. We have a steel company that is continuing to outperform and two stocks from the Exploration & Production industry group. With my scans I found a Trucking stock that has a beautiful set-up.
The two sectors that are really outperforming the market are Energy and Real Estate so it isn't surprising to see plenty of requests from those sectors. I've listed a few stocks I like but didn't present and the rest of the reader requests to the Stocks to Review.
Don't forget! Tomorrow is the Diamond Mine trading room! If you haven't registered yet, here is the link. It is also below, right above last week's recording link. These are in every report.
Today's "Diamonds in the Rough" are: NUE, PXD, USAK and VET.
Stocks/ETFs to Review (no order): DNOW, USCR, WNC, PSX, HTLD, CDMO, ABT, CVM, LAND, SXC, RIG and VET.
 Diamond Mine REGISTRATION Information:
When: Jun 4, 2021 09:00 AM Pacific Time (US and Canada)
Topic: DecisionPoint Diamond Mine LIVE Trading Room
Register in advance for this webinar HERE.
After registering, you will receive a confirmation email containing information about joining the webinar, including the password. SAVE IT! Zoom doesn't always send out the reminders.
=======================================================================
Diamond Mine RECORDING Link:
Topic: DecisionPoint Diamond Mine LIVE Trading Room
Start Time : May 28, 2021 09:01 AM
Meeting Recording Link.
Access Passcode: May-28th
***Click here to register for this recurring free DecisionPoint Trading Room on Mondays at Noon ET!***
+++++++++++++++++++++++++++++++++++++++++++++++++++++++++++++++++++++++++++++++
Free DP Trading Room RECORDING LINK:
Topic: DecisionPoint Trading Room
Start Time : May 31, 2021 09:00 AM PT
Meeting Recording Link HERE.
Access Passcode: May-31st
For best results, copy and paste the access code to avoid typos.

Arthur Hill, CMT in free DecisionPoint Trading Room June 7th!
Arthur Hill, CMT, is the Chief Technical Strategist and main author at TrendInvestorPro.com. Schooled in classical technical analysis, Arthur crossed over to the dark side, quantitative analysis, in 2012. Classical technical analysis provides a solid foundation for learning, but is largely subjective and discretionary in nature. Quantitative analysis puts classical technical indicators to the test with clear rules, signals and results. Taken together, classical chart analysis and quantitative analysis provide the basis for Arthur's systematic approach to analysis, trading and investing. Next level technical analysis.
Click here to register in advance for the recurring free DecisionPoint Trading Room! Recordings are available!
Welcome to DecisionPoint Daily Diamonds, wherein I highlight five "diamonds in the rough." These are selected from the results of my DecisionPoint scans, which search for stocks that could benefit from the trend and condition of the market. Remember, these are not recommendations to buy or sell, but are the most interesting of the stocks that surfaced in my scans. My objective is to save you the work of the initial, tedious culling process, but you need to apply your own analysis to see if these stocks pique your interest as well. There are no guaranteed winners here!
Nucor Corp. (NUE)
EARNINGS: 7/22/2021 (BMO)
Nucor Corp. engages in the manufacturing of steel and steel products. It operates through the following segments: Steel Mills, Steel Products, and Raw Materials. The Steel Mills segment comprises of carbon and alloy steel in sheet, bars; structural and plate; steel trading businesses; rebar distribution businesses; and Nucor's equity method investments. The Steel Products segment includes steel joists and joist girders, steel deck, fabricated concrete reinforcing steel, cold finished steel, steel fasteners, metal building systems, steel grating, tubular products businesses, piling products business, and wire and wire mesh. The Raw Materials segment consists of direct reduced iron, and ferrous and nonferrous metals. The company was founded by Ransom E. Olds in 1905 and is headquartered in Charlotte, NC.
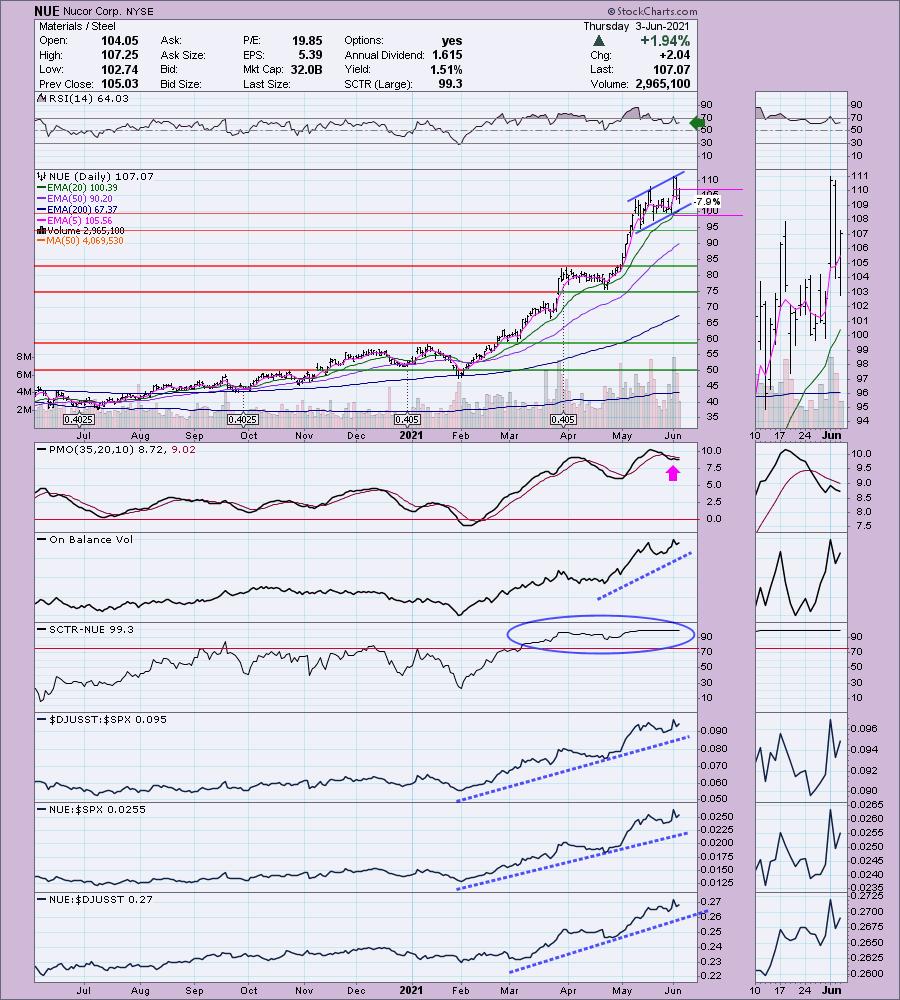
NUE is down -0.07% in after hours trading. I covered NUE in the February 25th 2021 Diamonds Report. Interestingly, I had used it as an example of relative strength. STLD had been requested, but I presented NUE as a bonus because it was performing better against its industry group. Since then, neither hit their stop. STLD is up +52.7% since, but NUE is up +74.1%! I'd be happy with either in my portfolio, but it does show that relative strength within an industry group is an important component.
The chart looks fairly healthy with a positive RSI and rising trend channel. Performance is still very strong within its group and against the SPX. We also have a confirming OBV and strong SCTR reading. There are some negatives. The PMO has topped below its signal line which is especially bearish. The rising trend channel forms an upwardly rising flag on a flagpole. These patterns tend to breakdown before breaking out. If you own this one, I believe you are still okay. Price is holding above the 20-EMA with no problem. We also know that steel is in demand as congress prepares to discuss a giant infrastructure bill. I would set an 8% stop just below $100.
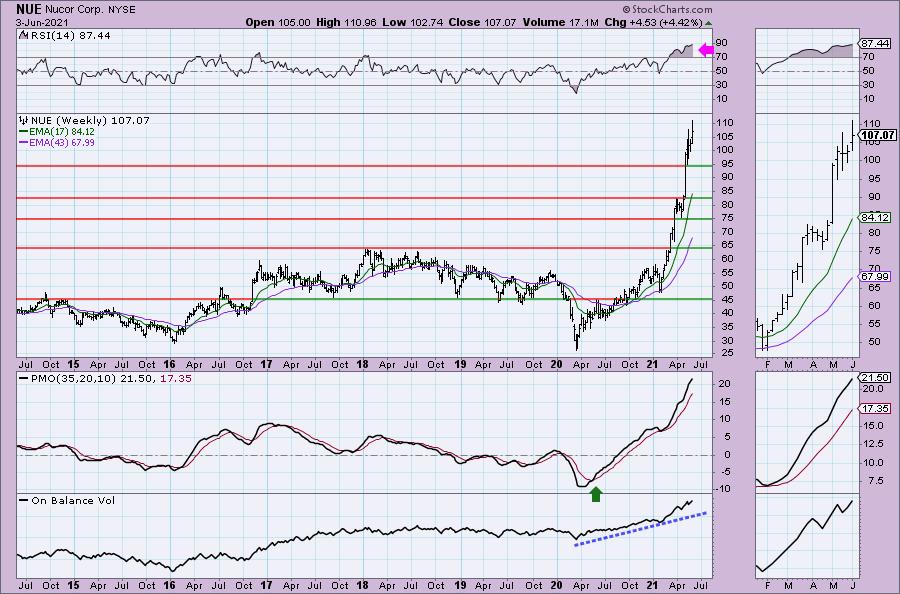
This is one of the best weekly charts we've seen in Diamonds. The weekly PMO is rising strongly and price is hitting new all-time highs nearly every week. I don't like the very overbought RSI, however we know that these conditions can persist in a strong extended rally.
Pioneer Natural Resources Co. (PXD)
EARNINGS: 8/4/2021 (AMC)
Pioneer Natural Resources Co. Operates as an independent oil and gas exploration and production company. The firm engages in hydrocarbon exploration in the Cline Shale. It focuses in the operation of Permian Basin, Eagle Ford Shale, Rockies, and West Panhandle projects. The company was founded by Scott Douglas Sheffield on April 2, 1997 and is headquartered in Irving, TX.
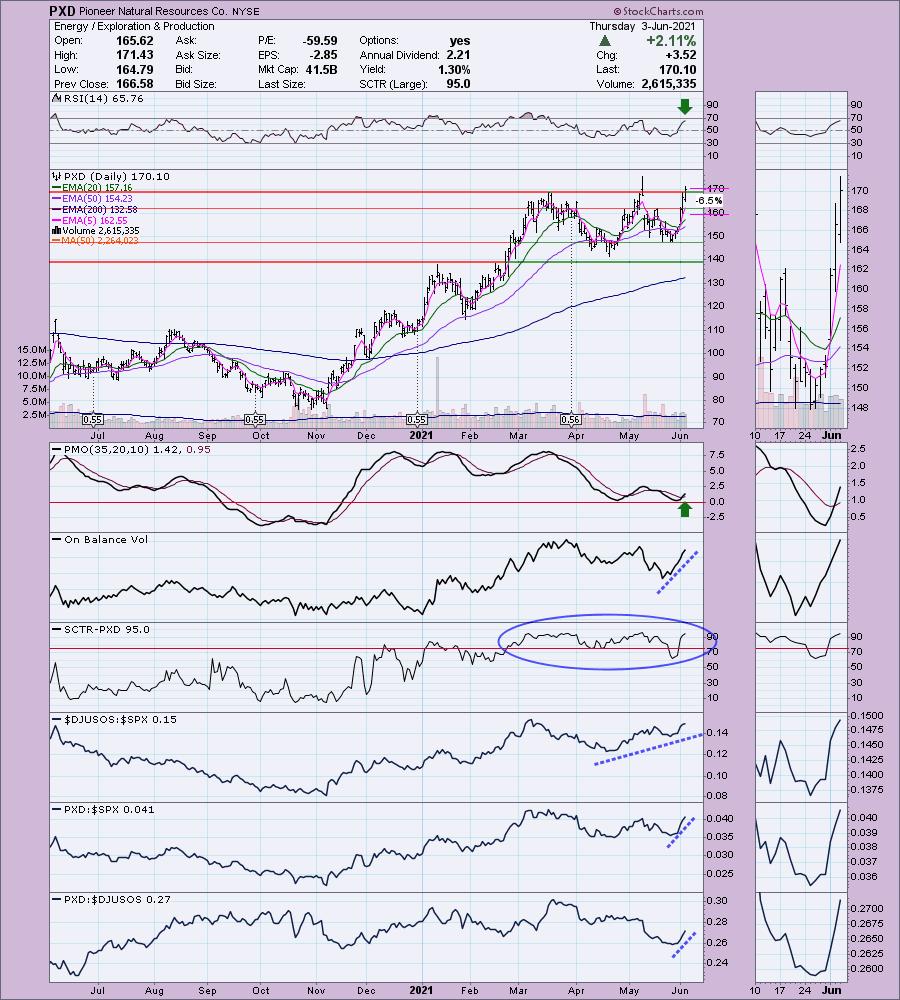
PXD is unchanged in after hours trading. I love today's breakout move that was accompanied by a new PMO crossover BUY signal. The RSI is positive and the OBV is confirming this rally. The SCTR has been healthy the majority of the year. This group is outperforming the SPX and PXD is outperforming both the group and SPX right now. The stop can be set tightly at 6.5% or you could certainly extend it if you are worried about being stopped out.
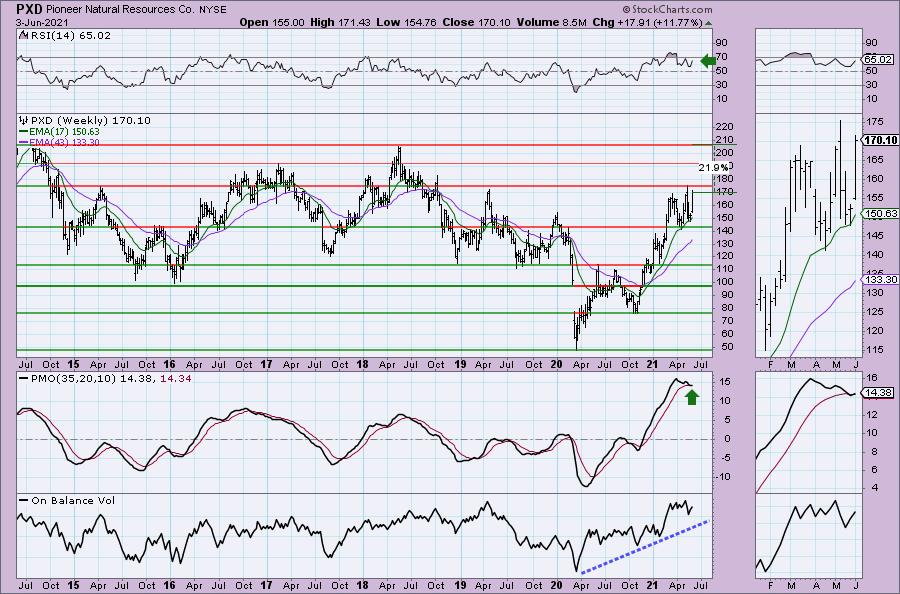
The weekly chart is very strong. The weekly PMO at first glance looks like a problem, but upon closer inspection in the thumbnail we can see that it has whipsawed back into a BUY signal. The OBV is confirming the rally out of the bear market low. The issue right now is that price is right up against overhead resistance. However, given the positive daily chart, I would expect to see price at least test the 2018 high.
USA Truck, Inc. (USAK)
EARNINGS: 7/29/2021 (AMC)
USA Truck, Inc. engages in the provision of transportation of general commodities. It operates through the Trucking and USAT Logistics segments. The Trucking segment includes one-way truckload, and dedicated freight motor carrier services. The USAT Logistics segment offers freight brokerage, logistics and rail intermodal services. The company was founded in 1983 and is headquartered in Van Buren, AR.
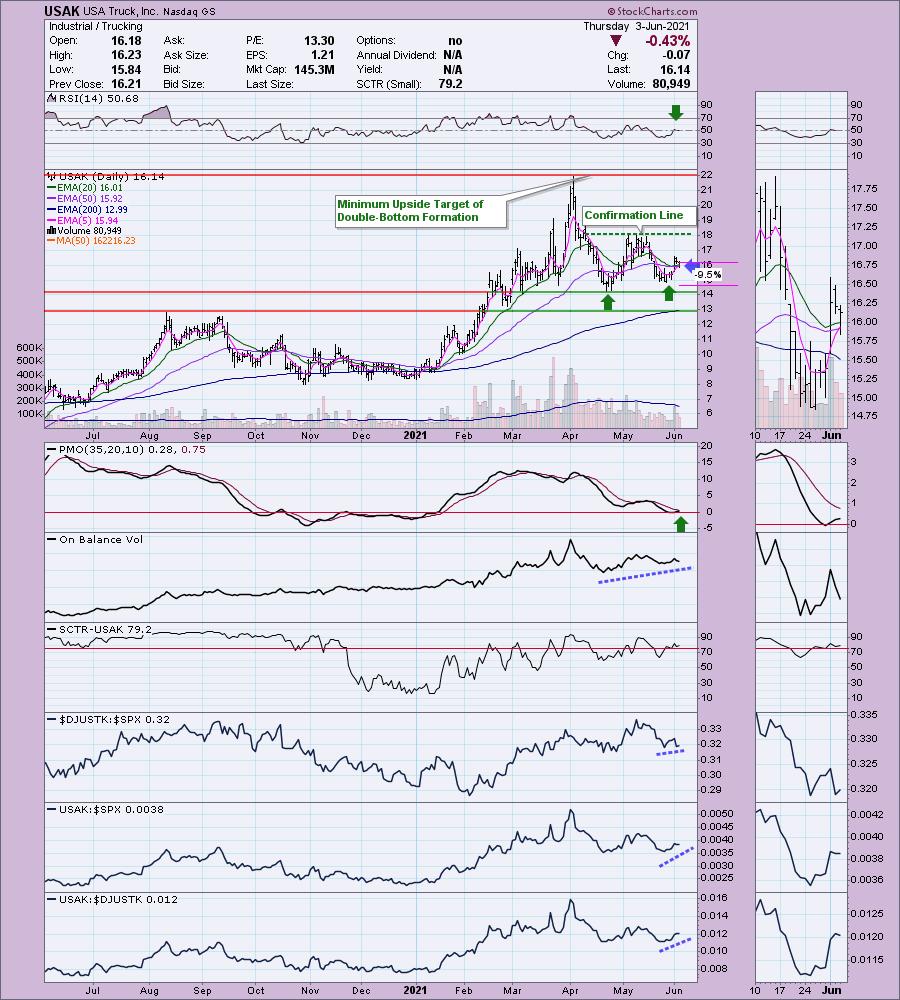
USAK is up +0.43% in after hours trading. I love this chart. I may have to pick this up tomorrow before the Diamond Mine if the 5-min chart looks good (it has a nice double-bottom on it right now). There is a bullish double-bottom in the making. The RSI just turned positive and the PMO has started rising. Price did pullback today, but remains above the 20-EMA. The 5-EMA should cross above the 20-EMA very shortly and that would be a ST Trend Model BUY signal. If price does what it is supposed to and breaks above the confirmation line, we should expect a move to challenge the April high. The OBV is rising. The industry group has been performing about as well as the SPX, but USAK is outperforming the SPX and the industry group. The stop is deep, but it is set below support at the second bottom of the double-bottom.
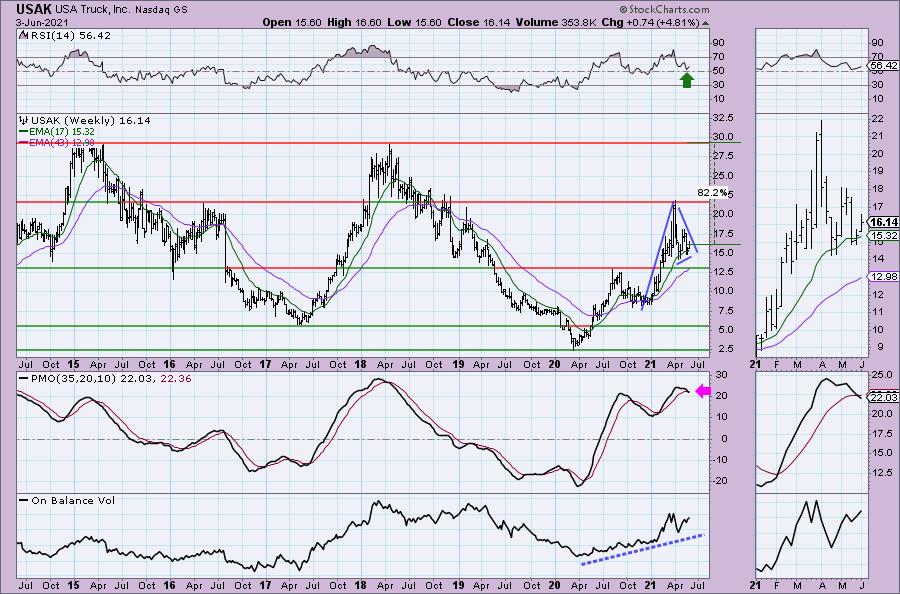
The weekly PMO is ugly, no arguing that. The rest of the chart looks pretty good. The weekly RSI is positive and I see a pennant on a flagpole. If price can make it to the 2021 top, that would be a 40%+ gain, but I don't see any reason it couldn't test the 2018 high.
Vermilion Energy Inc. (VET)
EARNINGS: 8/16/2021 (AMC)
Vermilion Energy, Inc. engages in the acquisition, exploration, development, and production of oil and natural gas. It operates through the following segments: Canada, United States of America, France, Netherlands, Germany, Ireland, Australia, and Corporate. The company was founded by Lorenzo Donadeo and Claudio A. Ghersinich in January 1994 and is headquartered in Calgary, Canada.
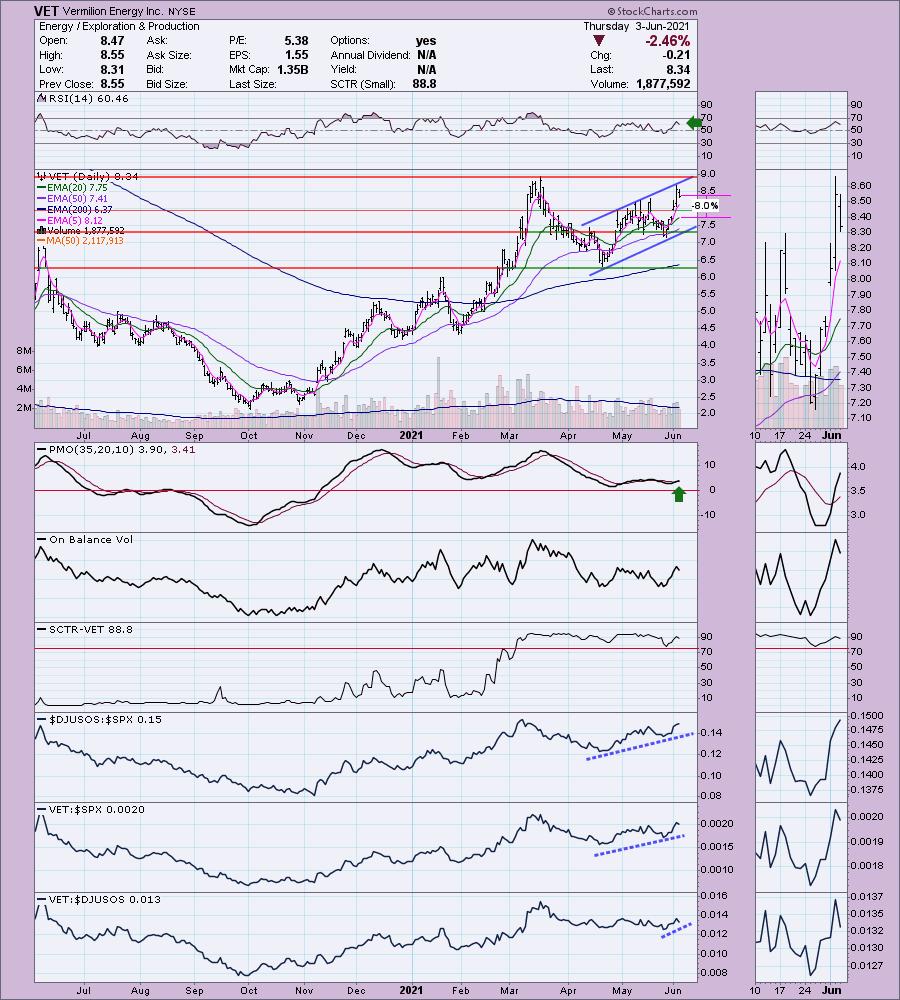
VET is up 2.64% in after hours trading, so I suspect our reader may be onto something. That rise would basically erase today's loss. The RSI is positive and price has been traveling in a rising trend channel. The issue might be that price needs to test the bottom of the channel again, so getting in here could be a bit risky. However, it is staying above short-term support at the May top. The PMO just triggered a crossover BUY signal. The OBV isn't telling us much, but the SCTR is in the "hot zone" above 75 so it is in the upper quartile of all small-cap stocks. We already know this industry group is on fire, VET is outperforming the group and SPX right now so it does look like an excellent choice. The stop is set at 8% which is below the 20-EMA.
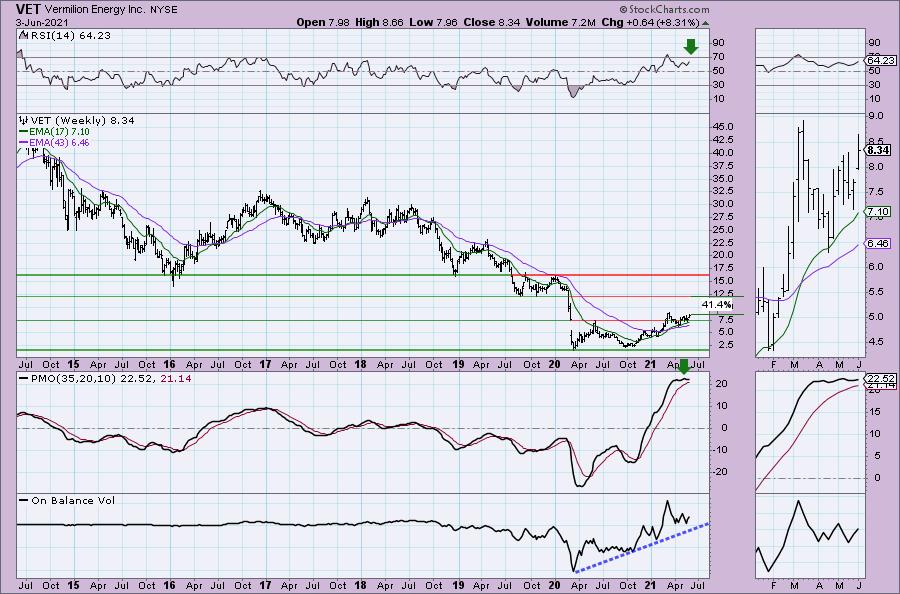
The weekly RSI is positive and rising, but not overbought. Price just broke out above gap resistance again. The weekly PMO is flat which is acceptable, but it is on the overbought side. The OBV is confirming the rally. Upside potential is over 41%, but I think it could reach even higher to reach the 2020 high.
Don't forget, on Thursdays I look at reader-requested symbols, so shoot me an email at erin@decisionpoint.com. I read every email I receive and try to answer them all!
Current Market Outlook:
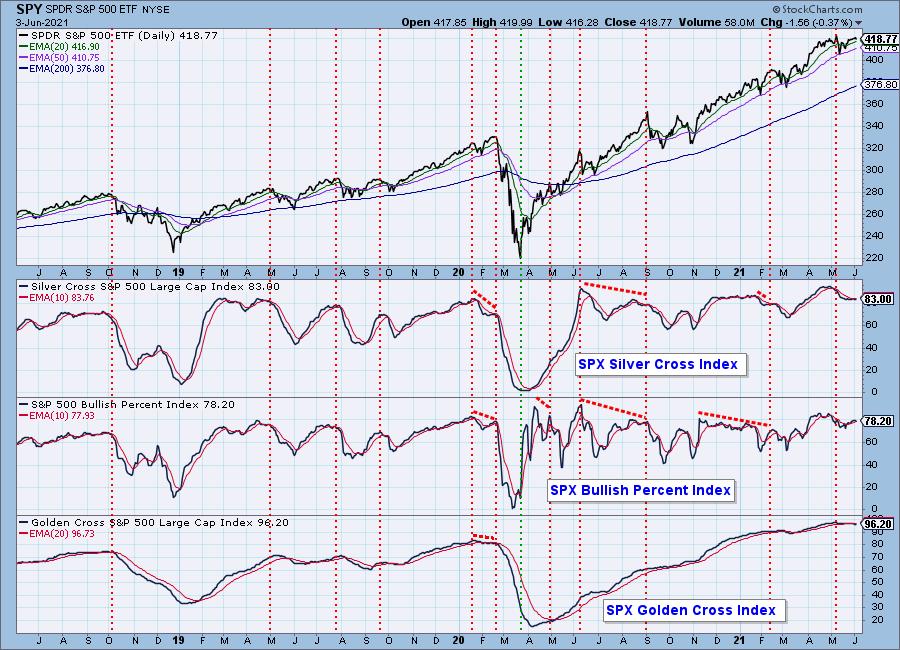
Market Environment: It is important to consider the odds for success by assessing the market tides. The following chart uses different methodologies for objectively showing the depth and trend of participation for intermediate- and long-term time frames.
- The Silver Cross Index (SCI) shows the percentage of SPX stocks on IT Trend Model BUY signals (20-EMA > 50-EMA)
- The Golden Cross Index (GCI) shows the percentage of SPX stocks on LT Trend Model BUY signals (50-EMA > 200-EMA)
- The Bullish Percent Index (BPI) shows the percentage of SPX stocks on Point & Figure BUY signals.
Don't forget that as a "Diamonds" member, you have access to our GCI/SCI curated ChartList on DecisionPoint.com. You'll find it under "Members Only" links on the left side on the Blogs and Links Page.
Here is the current chart:
Diamond Index:
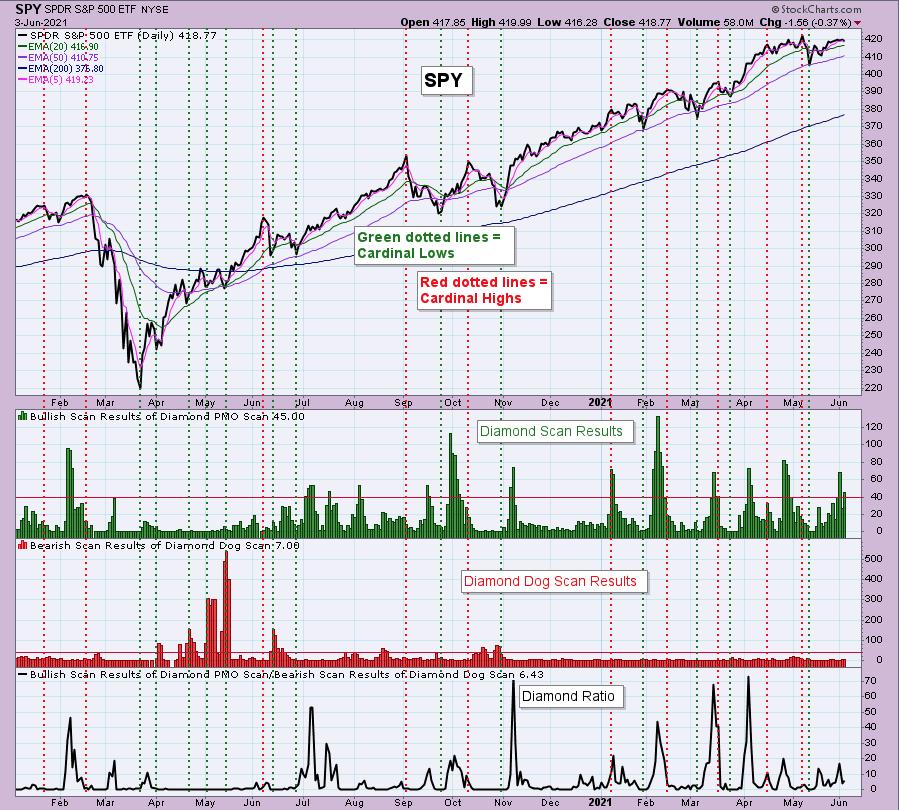
The Diamond Index chart looks at the number of scan results from my bullish Diamond PMO Scan and the number of scan results from the inverse Diamond Dog Scan. The Diamond Ratio divides the bullish results by the bearish results.
I only have data going back to October 2019 so I won't make any sweeping conclusions about the Diamond Index chart. I have marked cardinal tops with red dotted vertical lines and cardinal price bottoms with green dotted vertical lines. I believe that when the Diamond Dog results spike, it usually comes at a price bottom, or marks a strong continuation of the rising trend.
Unfortunately, the Diamond PMO Scan result numbers aren't providing much insight. The Diamond Ratio has promise, but again I don't see a clear correlation to the market tops/bottoms right now. I need to study and manipulate the data some more. Keep you posted!
Full Disclosure: I'm about 75% invested and 25% is in 'cash', meaning in money markets and readily available to trade with.
Technical Analysis is a windsock, not a crystal ball.
Happy Charting!
- Erin
erin@decisionpoint.com
Watch the latest episode of DecisionPoint with Carl & Erin Swenlin on Mondays 7:00p EST or on the DecisionPoint playlist on the StockCharts TV YouTube channel here!
NOTE: The stocks reported herein are from mechanical trading model scans that are based upon moving average relationships, momentum and volume. DecisionPoint analysis is then applied to get five selections from the scans. The selections given should prompt readers to do a chart review using their own analysis process. This letter is not a call for a specific action to buy, sell or short any of the stocks provided. There are NO sure things or guaranteed returns on the daily selection of "diamonds in the rough."
Helpful DecisionPoint Links:
DecisionPoint Shared ChartList and DecisionPoint Chart Gallery
Price Momentum Oscillator (PMO)
Swenlin Trading Oscillators (STO-B and STO-V)
For more links, go to DecisionPoint.com
