
Most of my scans are producing fewer and fewer results. I find when this happens the market is internally weak. It also means we should be more selective on where and what we trade.
Two of today's three selections have improving weekly charts. Typically "diamonds in the rough" have bearish weekly PMOs, today we have two with rising PMOs sitting aside bullish daily charts.
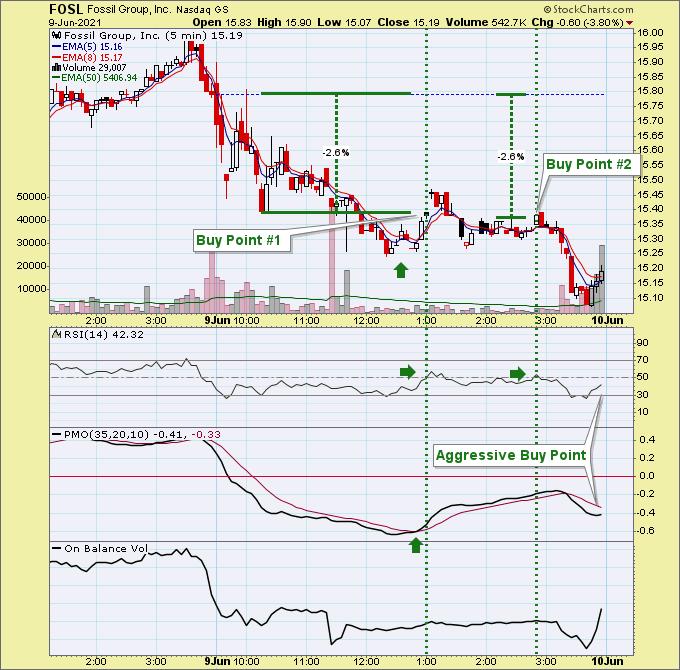
Update on FOSL, it pulled back nearly 4% today. The chart still looks healthy to me so I did pick up a small position at 2.6% discount from yesterday's close (thank you 5-min candlestick chart!).
You'll see that the first buy point came in around 1pm ET and the second buy point came in just before 3p ET. I got in at buy point #1. It appeared a new double-bottom had formed so it made sense to pull the trigger. Of course the pattern failed, but the PMO was still positive. The second buy point was similar to the original buy point. Now we have an aggressive buy point shaping up for tomorrow. The PMO has turned up and the RSI is rising toward positive territory. It's "aggressive" because the PMO hasn't had its crossover and the RSI is still negative. My stop loss is in place.
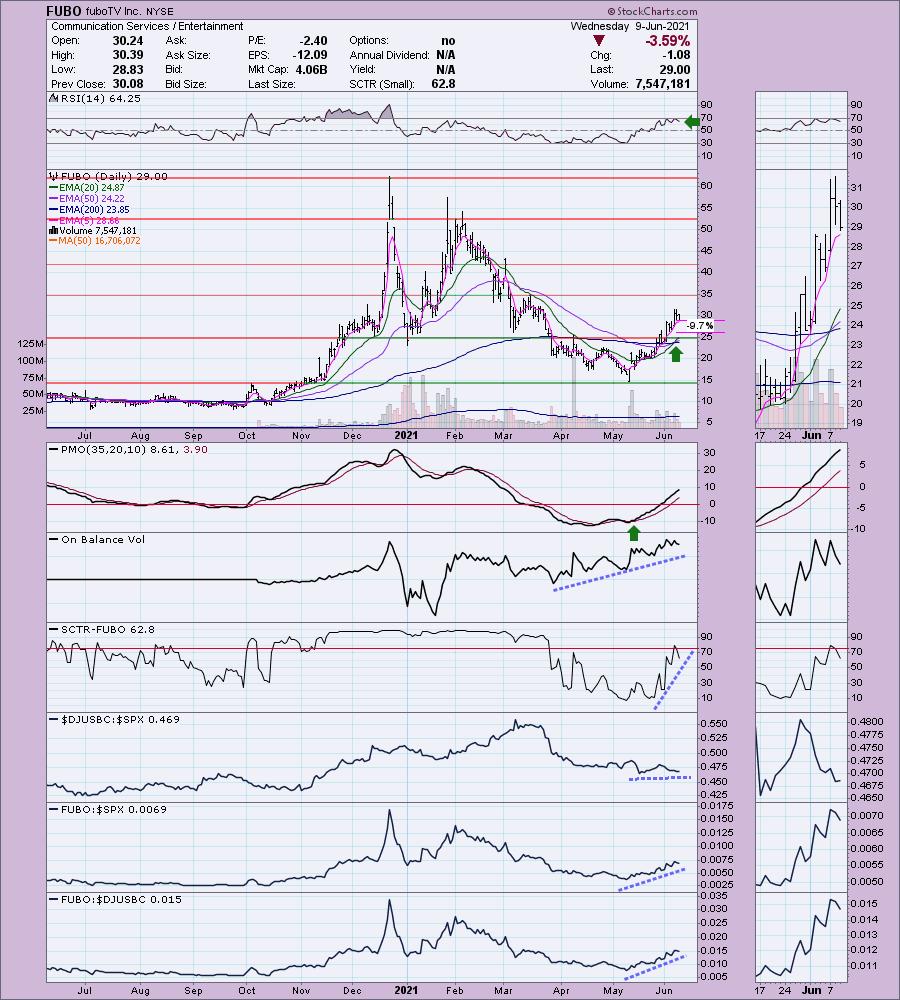
I selected FUBO today as a "diamond in the rough". This is a volatile and somewhat speculative stock, but the chart and upside potential made it worth reporting. Just be sure to set a stop if you get in.
I note that AAPL's chart is looking good, but I opted not to present it because the market is looking weak and this one could be caught in a pullback. Additionally, I think we all look at this chart everyday so no point in presenting it.
ILMN and NWE have very favorable charts and are not nearly as speculative as FUBO.
Today's "Diamonds in the Rough" are: FUBO, ILMN and NWE.
Stocks/ETFs to Review (no order): AAPL, HRTX, WU, EGLX, STE and TAK.
 Diamond Mine REGISTRATION Information:
When: Jun 11, 2021 09:00 AM Pacific Time (US and Canada)
Topic: DecisionPoint Diamond Mine (6/11/2021) LIVE Trading Room
Register in advance for this webinar HERE.
After registering, you will receive a confirmation email containing information about joining the webinar, including the password. SAVE IT! Zoom doesn't always send out the reminders.
=======================================================================
Diamond Mine RECORDING Link:
Topic: DecisionPoint Diamond Mine (6/4/2021) LIVE Trading Room
Start Time : Jun 4, 2021 09:00 AM PT
Meeting Recording LINK.
Access Passcode: June-4th
***Click here to register for this recurring free DecisionPoint Trading Room on Mondays at Noon ET!***
+++++++++++++++++++++++++++++++++++++++++++++++++++++++++++++++++++++++++++++++
Free DP Trading Room RECORDING LINK:
Topic: DecisionPoint Trading Room
Start Time : Jun 7, 2021 08:41 AM
Meeting Recording Link.
Access Passcode: June-7th
For best results, copy and paste the access code to avoid typos.
Welcome to DecisionPoint Daily Diamonds, wherein I highlight five "diamonds in the rough." These are selected from the results of my DecisionPoint scans, which search for stocks that could benefit from the trend and condition of the market. Remember, these are not recommendations to buy or sell, but are the most interesting of the stocks that surfaced in my scans. My objective is to save you the work of the initial, tedious culling process, but you need to apply your own analysis to see if these stocks pique your interest as well. There are no guaranteed winners here!
fuboTV Inc. (FUBO)
EARNINGS: 8/10/2021 (AMC)
fuboTV, Inc. operates as a digital entertainment company. It focuses on offering consumers a live television (TV) streaming platform for sports, news and entertainment through fuboTV. The company was founded by David Gandler, Alberto Horihuela Suarez and Sung Ho Choi on February 20, 2009 and is headquartered in New York, NY.
FUBO is down -1.14% in after hours trading so a better entry should be available tomorrow. I covered FUBO as a reader request on January 14th 2021. It closed at $52.40 on February 1st with a gain of over 47%, but the 11% stop was eventually hit in early March. Price action has gotten far less volatile, but this stock is still subject to speculation. Notice all of the volume that has been coming in since April, yet price hasn't come close to testing the price highs associated with all of the OBV highs. That is a reverse divergence. However, the RSI is positive and the PMO was not fazed by today more than 3.5% drop and continues to rise out of oversold territory. We've had two major EMA crossovers. There was a LT Trend Model "Golden Cross" BUY signal on the 50/200-EMA positive crossover and an IT Trend Model "Silver Cross" BUY signal on the 20/50-EMA positive crossover. While the group has been underperforming, FUBO is holding its own against the SPX. I'd like to set the stop at the 200-EMA, but that is an almost 12% stop loss which doesn't work for me so I picked the level to match with the early March low.
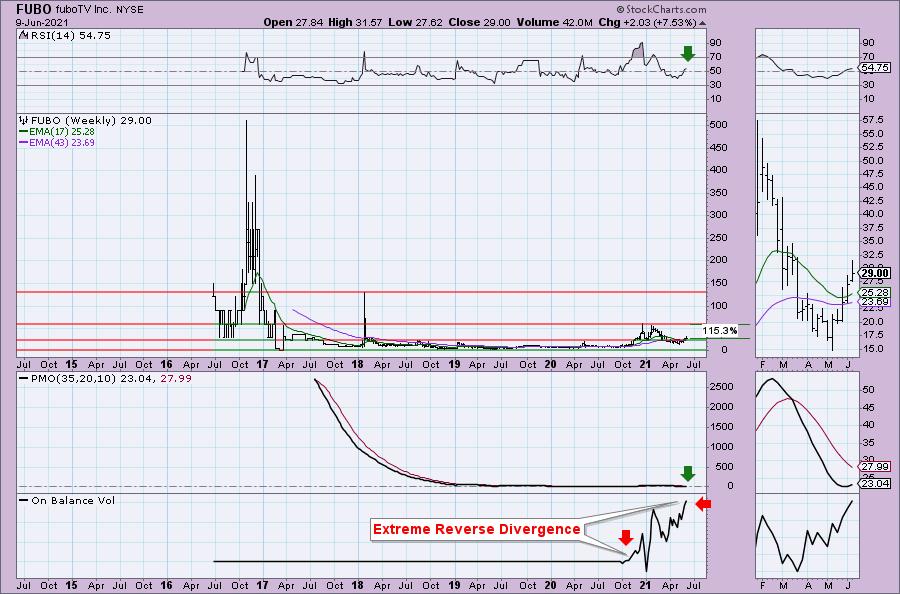
The weekly chart has a rising weekly PMO and the weekly RSI just hit positive territory. We can see that price is now back above the original basing pattern between 2018 and 2020. Even if price can get to this year's high, that is an over 115% gain. The big problem on the chart is the extreme reverse divergence that I alluded to on the daily chart. Price should follow volume. So when the OBV moves that high, price should also be making new highs. It's not. I'm not too concerned only because this has been a "meme" type stock with lots of interest, hype and volatility.
Illumina, Inc. (ILMN)
EARNINGS: 8/5/2021 (AMC)
Illumina, Inc. engages in the development, manufacturing, and marketing of life science tools and integrated systems for large-scale analysis of genetic variation and function. It operates through Core Illumina segment, which serves customers in the research, clinical and applied markets, and enable the adoption of a variety of genomic solutions. The firm's products include instruments, kits and reagents, selection tools, and software and analysis. Its services include sequencing and microarray services; proactive instrument monitoring; and instrument services, training, and consulting. The company was founded by David R. Walt, John R. Stuelpnagel, Anthony W. Czarnik, Lawrence A. Bock, and Mark S. Chee in April 1998 and is headquartered in San Diego, CA.
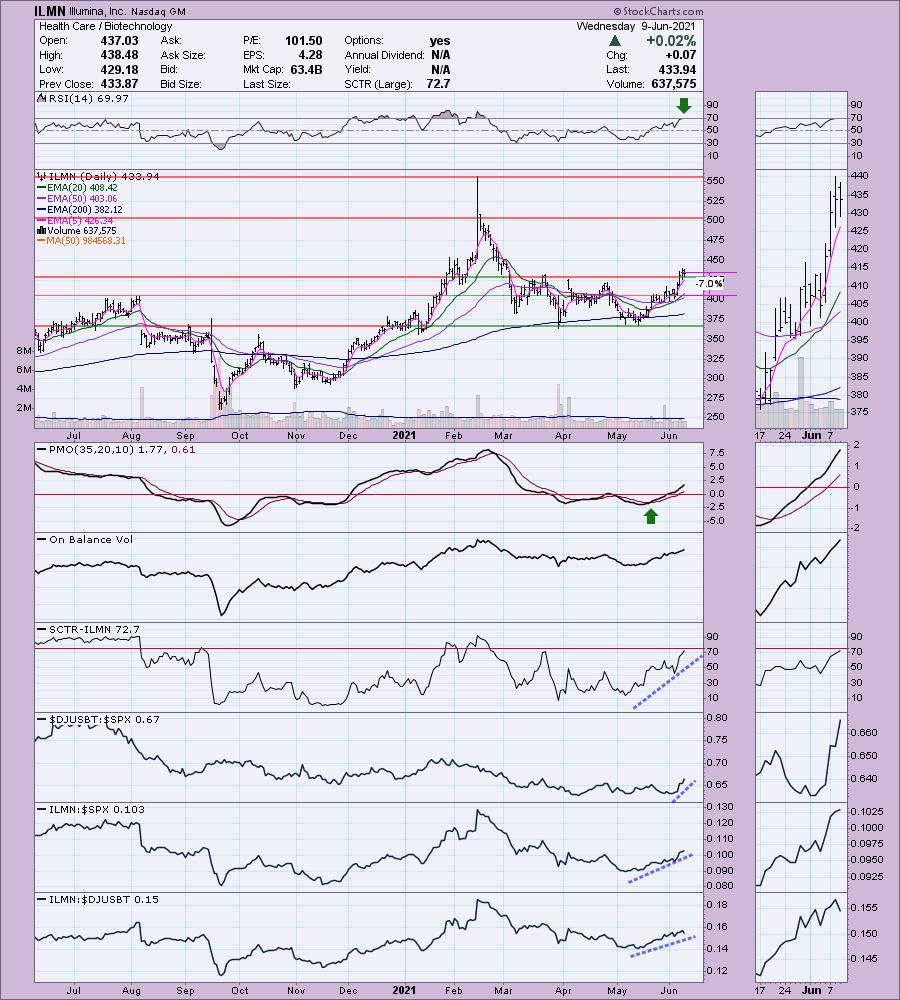
ILMN is down -0.01% in after hours trading. I was surprised I hadn't covered this one before. It's not as volatile as many of the biotechs out there. We have a nice breakout from a trading range. The breakout occurred Monday and price has held above support today and yesterday. The RSI is on the overbought side so we should be aware of that. The PMO is on an oversold BUY signal and has now reached positive territory. There was a recent IT Trend Model "Silver Cross" BUY signal when the 20-EMA crossed above the 50-EMA. The OBV is confirming the rally and the SCTR is almost in the "hot zone" above 75, meaning it is in the upper quartile among all large-cap stocks. Outperformance is clear. I like that you can set a reasonable 7% stop.
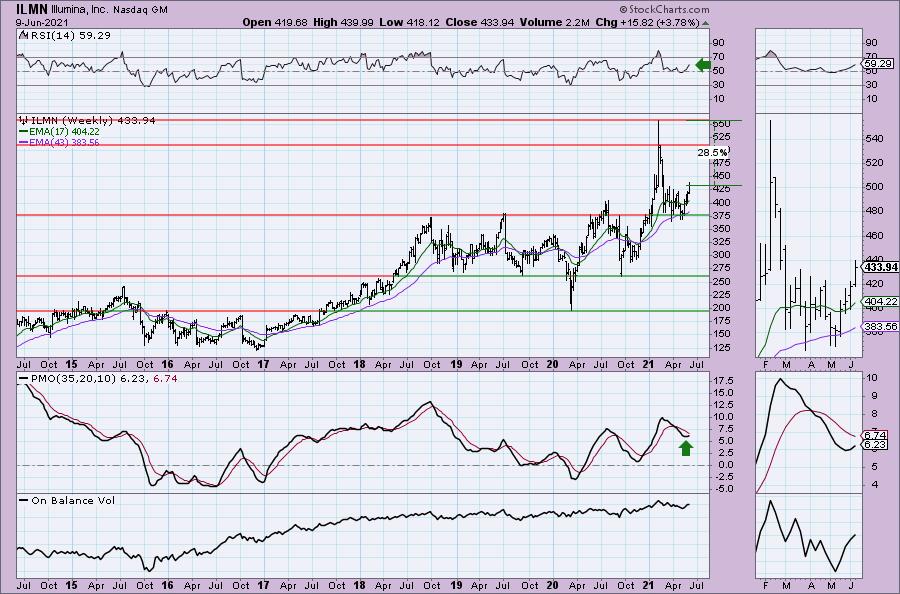
Here is another rising weekly PMO. It is not overbought. The weekly RSI is positive. Price bounced off strong support. If it challenges its all-time high that would be an over 28% gain.
NorthWestern Corp. (NWE)
EARNINGS: 7/27/2021 (AMC)
NorthWestern Corp. engages in generating and distributing electricity and natural gas. It operates through the following segments: Electric Utility Operations, Natural Gas Operations, and All Other. The Electric Utility Operations segment includes generation, transmission, and distribution of electric utility business as a vertically integrated generation transmission and distribution utility. The Natural Gas Operations segment comprises production, storage, transmission, and distribution of natural gas. The All Other segment consists of unallocated corporate costs. The company was founded in November 1923 and is headquartered in Sioux Falls, SD.
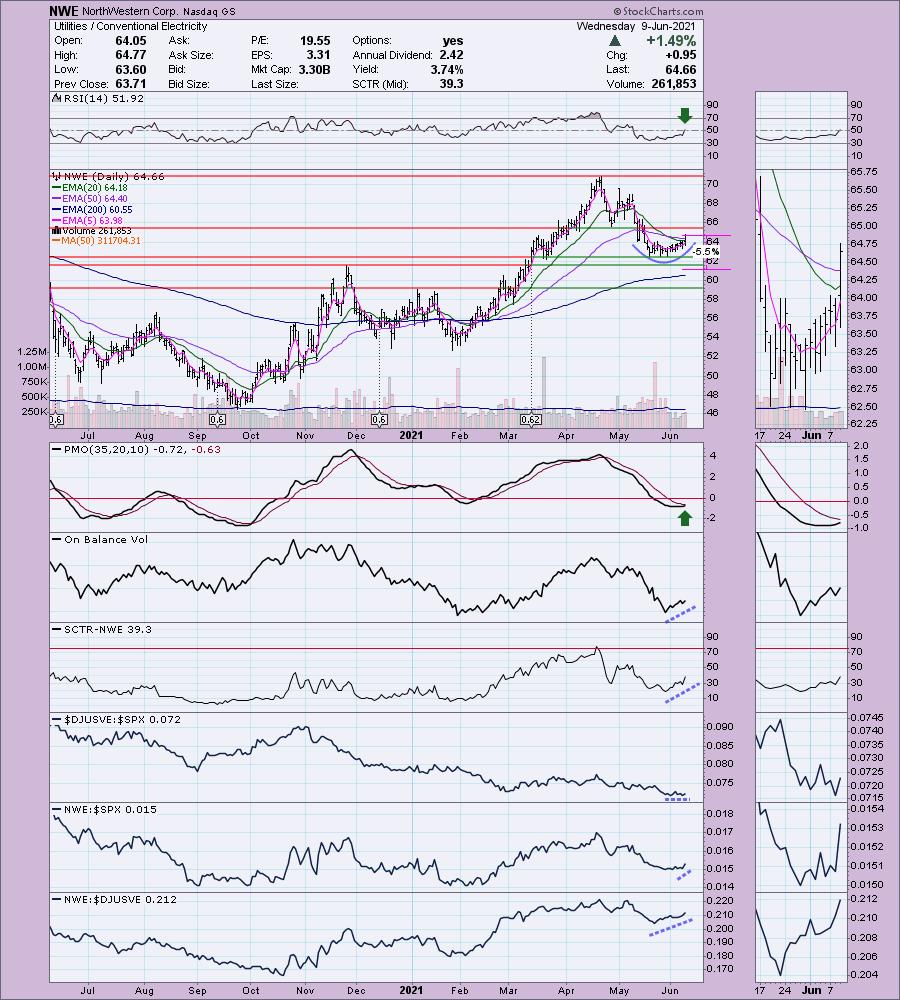
NWE is unchanged in after hours trading. If the market is weak, Utilities is generally a good place to go. This chart is very bullish. Price is forming a cup shaped bottom. Price has broken above key EMAs. The RSI has just moved into positive territory and the PMO is about ready to give us a crossover BUY signal. The OBV is confirming the new rally and the SCTR is improving. While the industry group isn't doing much, NWE is outperforming the SPX and is one of the stronger members of the group given its outperformance. The stop is great! You don't have to let this one run that much lower. If it is going to breakout, it needs to stay above the fairly strong support zone. If it fails, it can be dumped quickly.
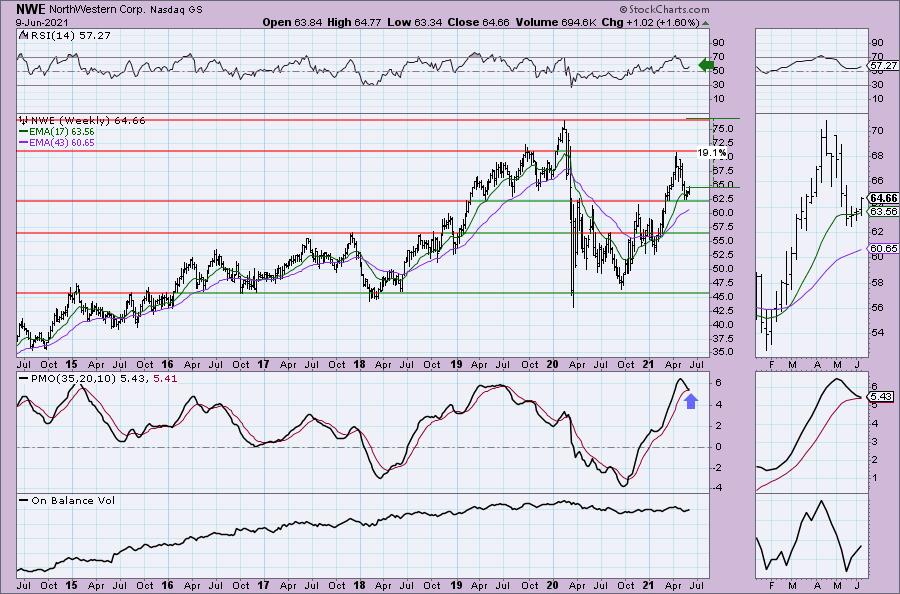
This weekly chart looks pretty good. The weekly PMO isn't great, but it is still above its signal line and appears to be decelerating to avoid it. The RSI is positive. Price bounced off strong support at the 2019 lows and the 2020 tops.
Don't forget, on Thursdays I look at reader-requested symbols, so shoot me an email at erin@decisionpoint.com. I read every email I receive and try to answer them all!
Current Market Outlook:
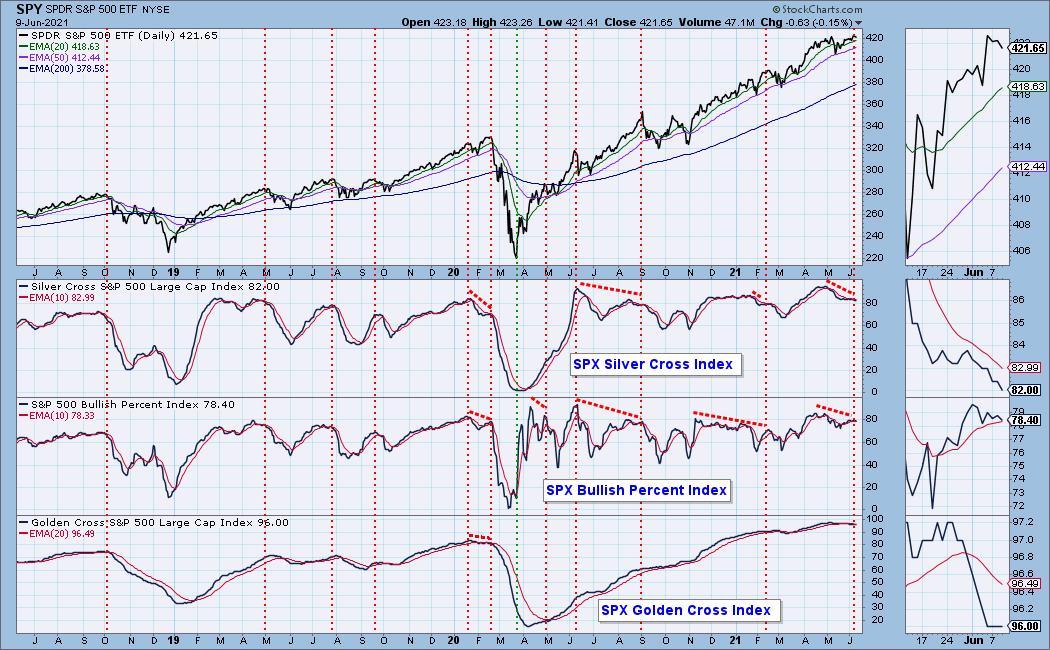
Market Environment: It is important to consider the odds for success by assessing the market tides. The following chart uses different methodologies for objectively showing the depth and trend of participation for intermediate- and long-term time frames.
- The Silver Cross Index (SCI) shows the percentage of SPX stocks on IT Trend Model BUY signals (20-EMA > 50-EMA)
- The Golden Cross Index (GCI) shows the percentage of SPX stocks on LT Trend Model BUY signals (50-EMA > 200-EMA)
- The Bullish Percent Index (BPI) shows the percentage of SPX stocks on Point & Figure BUY signals.
Don't forget that as a "Diamonds" member, you have access to our GCI/SCI curated ChartList on DecisionPoint.com. You'll find it under "Members Only" links on the left side on the Blogs and Links Page.
Here is the current chart:
Diamond Index:
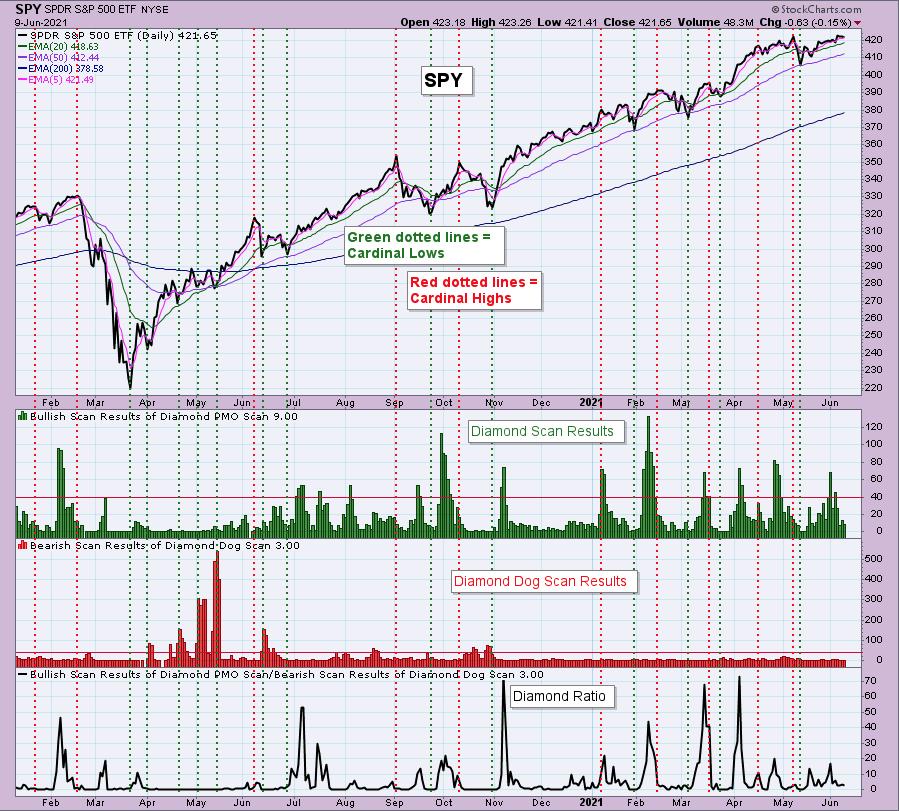
The Diamond Index chart looks at the number of scan results from my bullish Diamond PMO Scan and the number of scan results from the inverse Diamond Dog Scan. The Diamond Ratio divides the bullish results by the bearish results.
I only have data going back to October 2019 so I won't make any sweeping conclusions about the Diamond Index chart. I have marked cardinal tops with red dotted vertical lines and cardinal price bottoms with green dotted vertical lines. I believe that when the Diamond Dog results spike, it usually comes at a price bottom, or marks a strong continuation of the rising trend.
Unfortunately, the Diamond PMO Scan result numbers aren't providing much insight. The Diamond Ratio has promise, but again I don't see a clear correlation to the market tops/bottoms right now. I need to study and manipulate the data some more. Keep you posted!
Full Disclosure: I'm about 70% invested and 30% is in 'cash', meaning in money markets and readily available to trade with. I bought FOSL.
Technical Analysis is a windsock, not a crystal ball.
Happy Charting!
- Erin
erin@decisionpoint.com
Watch the latest episode of DecisionPoint with Carl & Erin Swenlin on Mondays 7:00p EST or on the DecisionPoint playlist on the StockCharts TV YouTube channel here!
NOTE: The stocks reported herein are from mechanical trading model scans that are based upon moving average relationships, momentum and volume. DecisionPoint analysis is then applied to get five selections from the scans. The selections given should prompt readers to do a chart review using their own analysis process. This letter is not a call for a specific action to buy, sell or short any of the stocks provided. There are NO sure things or guaranteed returns on the daily selection of "diamonds in the rough."
Helpful DecisionPoint Links:
DecisionPoint Shared ChartList and DecisionPoint Chart Gallery
Price Momentum Oscillator (PMO)
Swenlin Trading Oscillators (STO-B and STO-V)
For more links, go to DecisionPoint.com
