
I continue to get few results on my bullish scans. Thankfully it is Reader Request Day so I didn't have to tease out as many picks from my scans. However, the majority of picks are bearish so I picked two to explain my bearish analysis. You certainly can disagree, but it will help you understand what I don't like on a chart if nothing else.
I did include include to bullish picks. Both are mine. It is getting harder and harder to make bullish picks. While the market may've bounced today, I don't believe it will last. One of the reasons is that my scans aren't picking up winners, but also, they aren't picking out as many losers either. This tells me the market isn't oversold enough. I should see Diamond Dog results expanding and they aren't.
Under stocks to consider below, I'm putting in some of the reader requests and my own as well. I'm not really fond of any of them, but maybe you'll see something I don't.
Diamond Mine is tomorrow! Be sure to sign up at this link.
Today's "Diamonds in the Rough" are: BIDU, KMI, VOD and WYNN.
Stocks/ETFs to Review (no order): HBM, TTD, INGR, WMB and CBOE.
 Diamond Mine REGISTRATION Information:
When: May 14, 2021 09:00 AM Pacific Time (US and Canada)
Topic: DecisionPoint Diamond Mine (5/14/2021) LIVE Trading Room
Register in advance for this webinar HERE.
After registering, you will receive a confirmation email containing information about joining the webinar, including the password. SAVE IT! Zoom doesn't always send out the reminders.
=======================================================================
Diamond Mine RECORDING Link:
Topic: DecisionPoint Diamond Mine (5/14/2021) LIVE Trading Room
Date: May 10, 2021 08:59 AM Pacific Time (US and Canada)
Meeting Recording HERE.
Access Passcode: ih7j1e!V
***Click here to register for this recurring free DecisionPoint Trading Room on Mondays at Noon ET!***
+++++++++++++++++++++++++++++++++++++++++++++++++++++++++++++++++++++++++++++++
Free DP Trading Room RECORDING LINK:
Topic: DecisionPoint Trading Room
Start Time : May 10, 2021 09:00 AM
Meeting Recording Link.
Access Passcode: May-10th
For best results, copy and paste the access code to avoid typos.
Welcome to DecisionPoint Daily Diamonds, wherein I highlight five "diamonds in the rough." These are selected from the results of my DecisionPoint scans, which search for stocks that could benefit from the trend and condition of the market. Remember, these are not recommendations to buy or sell, but are the most interesting of the stocks that surfaced in my scans. My objective is to save you the work of the initial, tedious culling process, but you need to apply your own analysis to see if these stocks pique your interest as well. There are no guaranteed winners here!
Baidu, Inc. (BIDU)
EARNINGS: 5/18/2021 (BMO)
Baidu, Inc. engages in the provision of internet search and online marketing solutions. The firm's products and services include Baidu App, Baidu Search, Baidu Feed, Haokan, Quanmin, Baidu Post Bar, Baidu Knows, Baidu Encyclopedia, Baidu Input Method Editor or Baidu IME and Overseas Products. It operates through the following segments: Baidu Core and iQIYI. The Baidu Core segment provides search-based, feed-based, and other online marketing services. The iQiyi segment is an online entertainment service provider, which offers original, professionally produced and partner-generated content on its platform. The company was founded by Yanhong Li and Xu Yong on January 18, 2000 and is headquartered in Beijing, China.
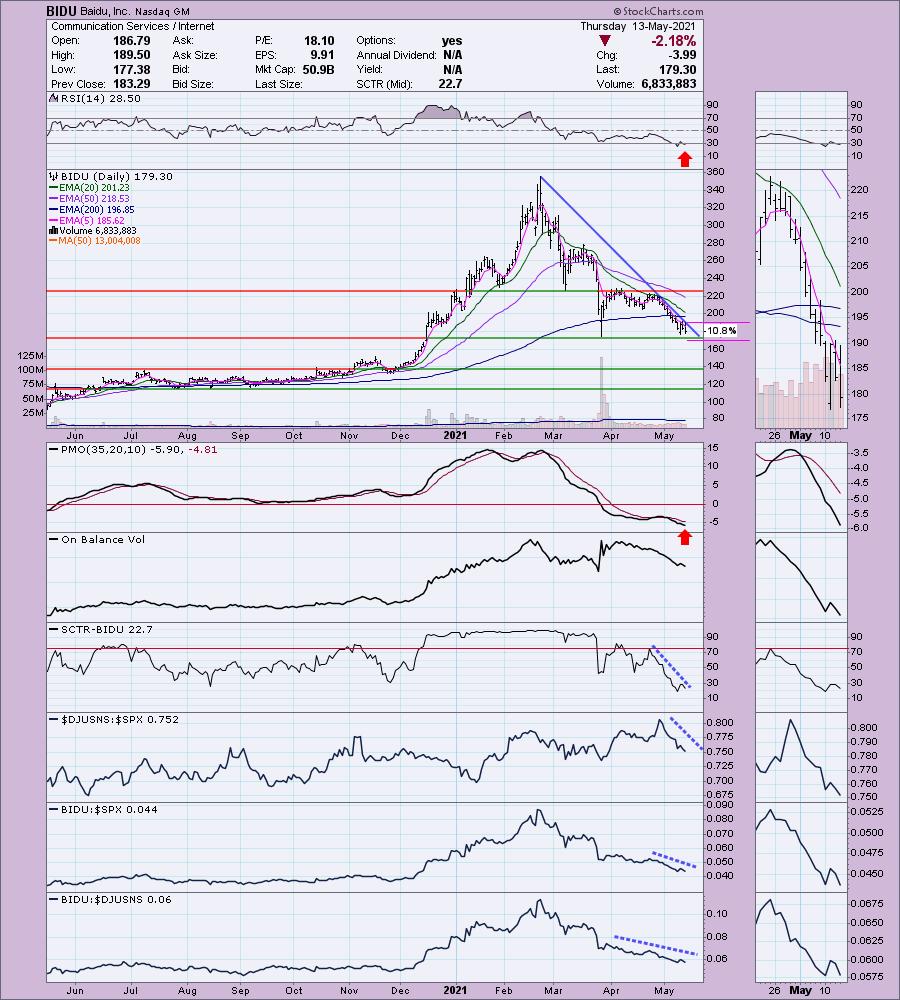
BIDU is down -0.07% in after hours trading. I covered BIDU back on August 26th 2020. The stop has never been hit so currently it is up 40.7% since. However, at its top in February, the position was up over 183%! I don't like it right now. Yes, it appears to be on support, but that late March low is a pinocchio tail, an intraday low. The 200-EMA has been broken. Last time it managed to close above the 200-EMA, even though the intraday low sunk below the 200-EMA. It has been closing beneath the 200-EMA for a little over a week. While the RSI is somewhat oversold, all of the indicators are moving south. This isn't my kind of investment. It's the "catching a falling knife" concept. The next area of true support doesn't arrive until $140. Too much risk here. However, if I present a chart, I will always include a stop level, even though it's a really really rough diamond.
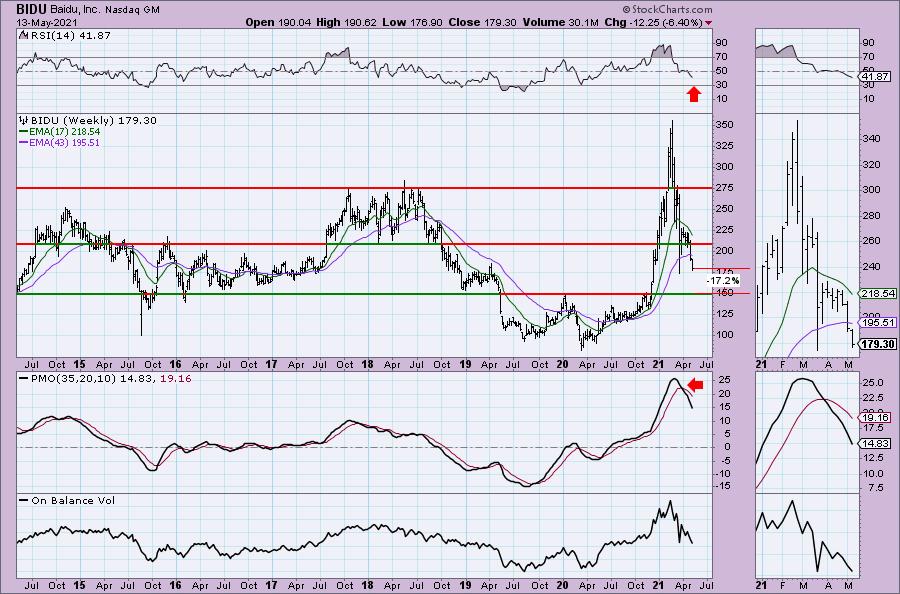
Downside risk is at least 17%. The weekly PMO is in free fall and the weekly RSI is negative and not oversold.
Kinder Morgan Inc. (KMI)
EARNINGS: 7/21/2021 (AMC)
Kinder Morgan, Inc. operates as an energy infrastructure company. The firm engages in the operation of pipelines and terminals that transport natural gas, gasoline, crude oil, carbon dioxide (CO2) and other products and stores petroleum products chemicals and handles bulk materials like ethanol, coal, petroleum coke and steel. It operates through the following segments: Natural Gas Pipelines, CO2, Terminals, Product Pipelines and Kinder Morgan Canada. The Natural Gas Pipelines segment engages in the ownership and operation of major interstate and intrastate natural gas pipeline and storage systems, natural gas and crude oil gathering systems and natural gas processing and treating facilities. The CO2 segment focuses on the production, transportation and marketing of CO2 to oil fields that use CO2 as a flooding medium for recovering crude oil from mature oil fields to increase production. The Terminals segment consists of the ownership and operation of liquids and bulk terminal facilities located throughout the U.S. and portions of Canada that trans load and store refined petroleum products, crude oil, chemicals, ethanol and bulk products, including coal, petroleum coke, fertilizer, steel and ores. The Products Pipelines segment owns and operates refined petroleum products, NGL and crude oil and condensate pipelines that primarily deliver, among other products, gasoline, diesel and jet fuel, propane, crude oil and condensate to various markets. The Kinder Morgan Canada segment operates the Trans Mountain pipeline system that transports crude oil and refined petroleum products from Edmonton, Alberta, Canada for marketing terminals and refineries in British Columbia, Canada and the state of Washington. The company was founded by Richard D. Kinder and William V. Morgan in February 1997 and is headquartered in Houston, TX.
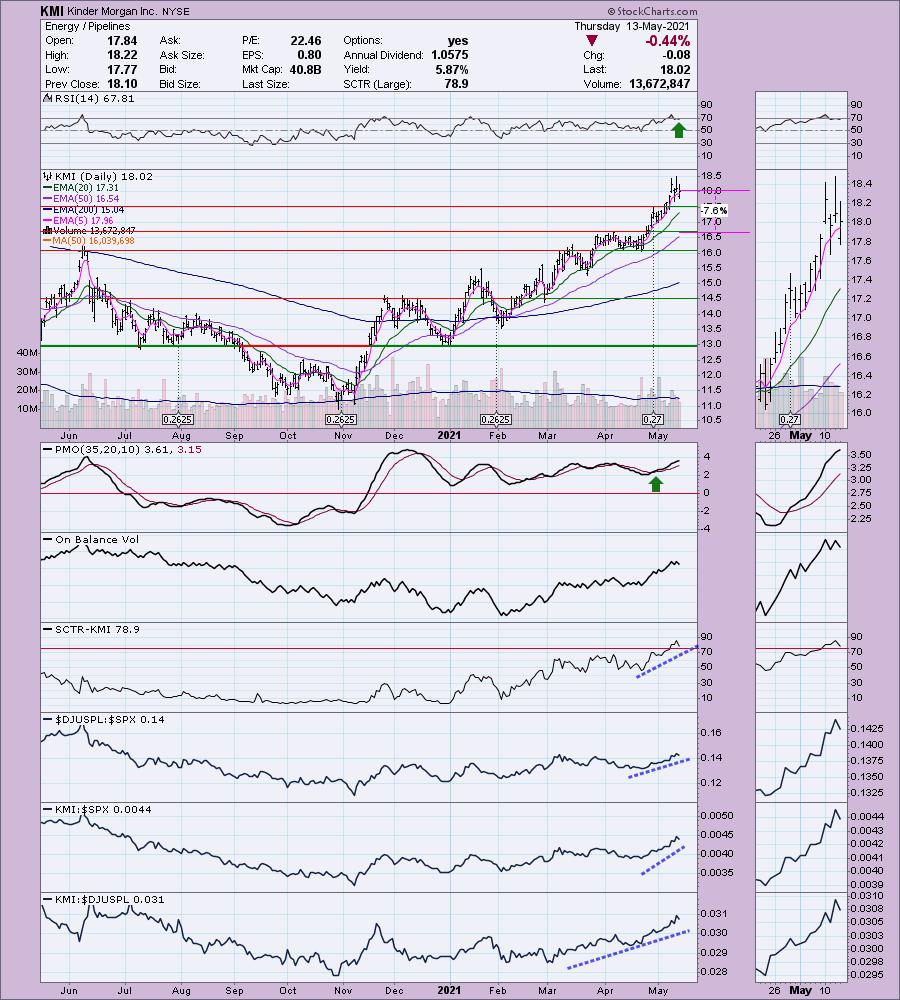
KMI is up +0.17% in after hours trading. I covered KMI on August 4th 2020. It hit its 7% stop at the beginning of September. This is one of my picks for the day. I still believe Energy and Pipelines are going to move even higher than they already have. KMI showed up on my scans and I liked it. The RSI is positive and moving out of overbought territory. The PMO is on a BUY signal and isn't that overbought. The OBV is confirming this rally and it is definitely outperforming right now. The stop is set below the April tops.
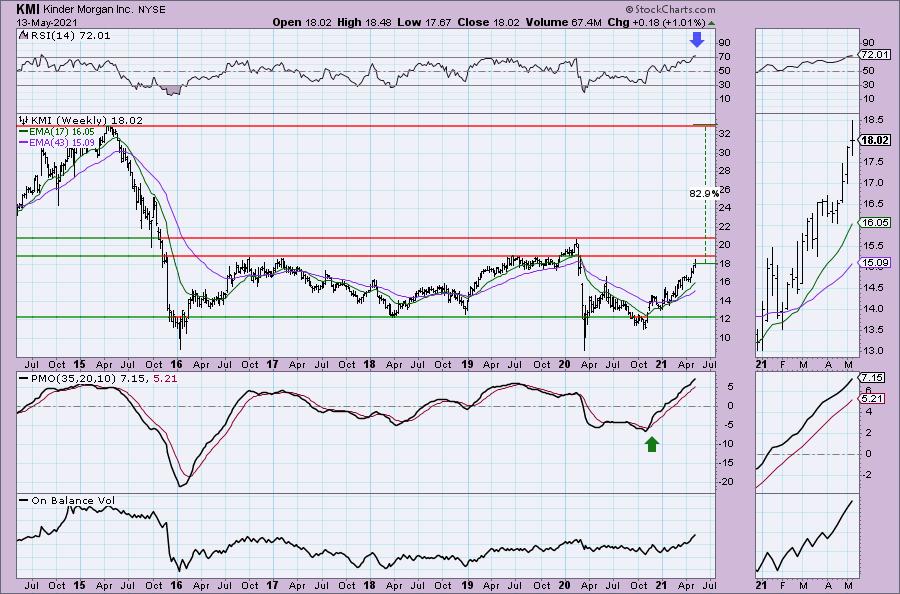
Upside potential looks good, although I'm not looking for it to make it to its 2015 high anytime soon. However, if it does breakout, there isn't much in the way of overhead resistance to prevent it from moving toward it.
Vodafone Group Public Limited Company (VOD)
EARNINGS: 5/18/2021
Vodafone Group Plc engages in telecommunication services in Europe and internationally. The firms offers mobile services that enable customers to call, text, and access data; fixed line services, including broadband, television (TV) offerings, and voice; and convergence services under the GigaKombi and Vodafone One names to customers. It also provides mobile, fixed, and a suite of converged communication services, such as Internet of Things (IoT) comprising managed IoT connectivity, automotive, and insurance services, as well as smart metering and health solutions; cloud and security portfolio comprising public and private cloud services, as well as cloud-based applications and products for securing networks and devices; and international voice, IP transit, and messaging services to support business customers that include small home offices and large multi-national companies. In addition, the company offers M-Pesa, an African payment platform, which provides money transfer, financial, and business and merchant payment services; and various services to operators through its market agreements, as well as rents capacity to mobile virtual network operators to provide mobile services. The firm has a strategic partnership with Open Fiber. As of March 31, 2019, it had approximately 650 million mobile customers, 19 million fixed broadband customers, and 14 million TV customers. The company was founded on July 17, 1984 and is headquartered in Newbury, the United Kingdom.
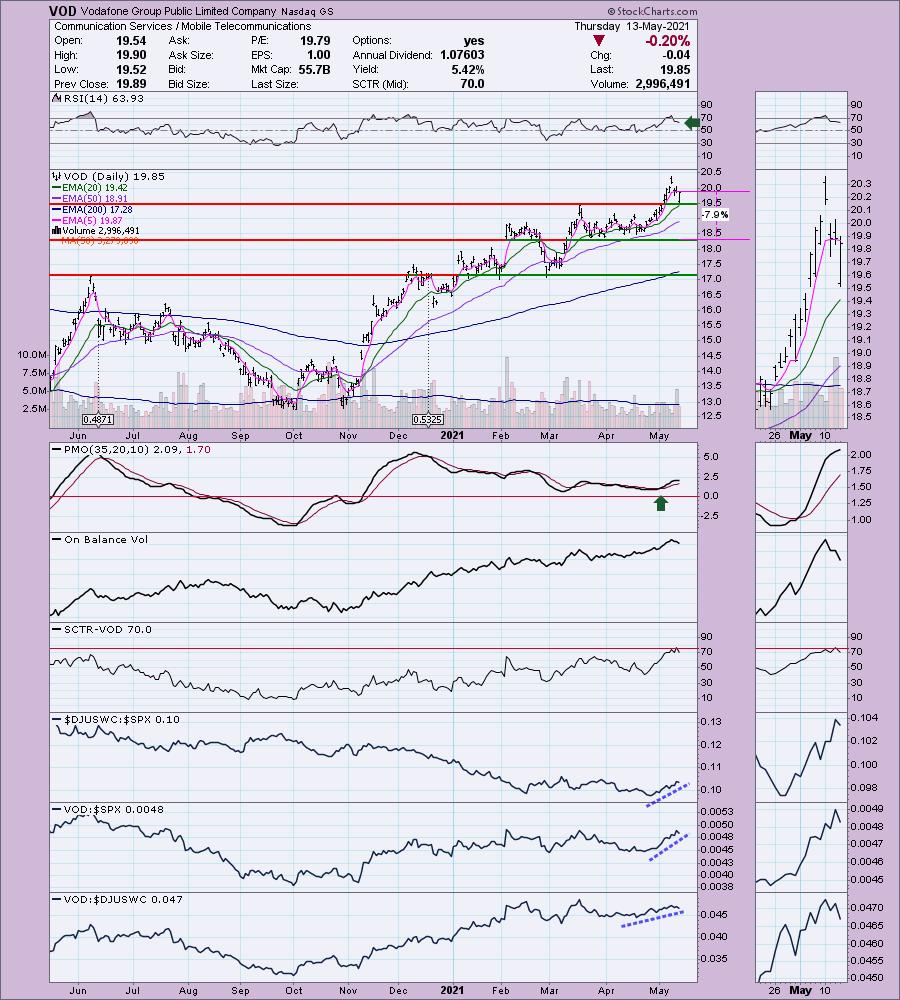
VOD is up +0.35% in after hours trading. This is my other pick today. While I'm not thrilled with this sector, the industry group looks good when compared to the SPX. I like this one on today's pullback to short-term support at the March top. The RSI is positive and not overbought. The PMO is looking a bit toppy, but it makes sense on the pullback. Performance hasn't been hampered yet and there was a huge amount of negative volume on this decline as demonstrated by the OBV. The stop is set below support at the late March and April lows.
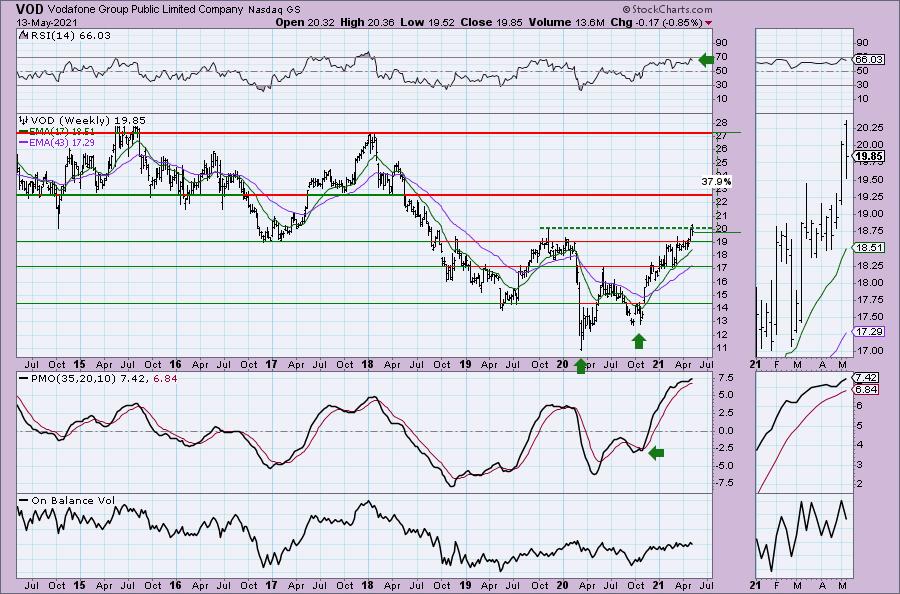
The weekly PMO has bottomed above the signal line. It is on the overbought side, so we need to be aware of that. The weekly RSI is positive and we can see that the double-bottom pattern was confirmed on the breakout past $17. The minimum upside target of the pattern would take it to that first area of overhead resistance at the various lows from 2014-2018.
Wynn Resorts Ltd (WYNN)
EARNINGS: 8/3/2021 (AMC)
Wynn Resorts Ltd. is a holding company, which engages in the design, development, and operation of destination casino resorts. It operates through the following segments: Wynn Palace, Wynn Macau, Las Vegas Operations, and Encore Boston Harbor. The company was founded by Stephen Alan Wynn, Elaine P. Wynn, and Kazuo Okada in 2002 and is headquartered in Las Vegas, NV.
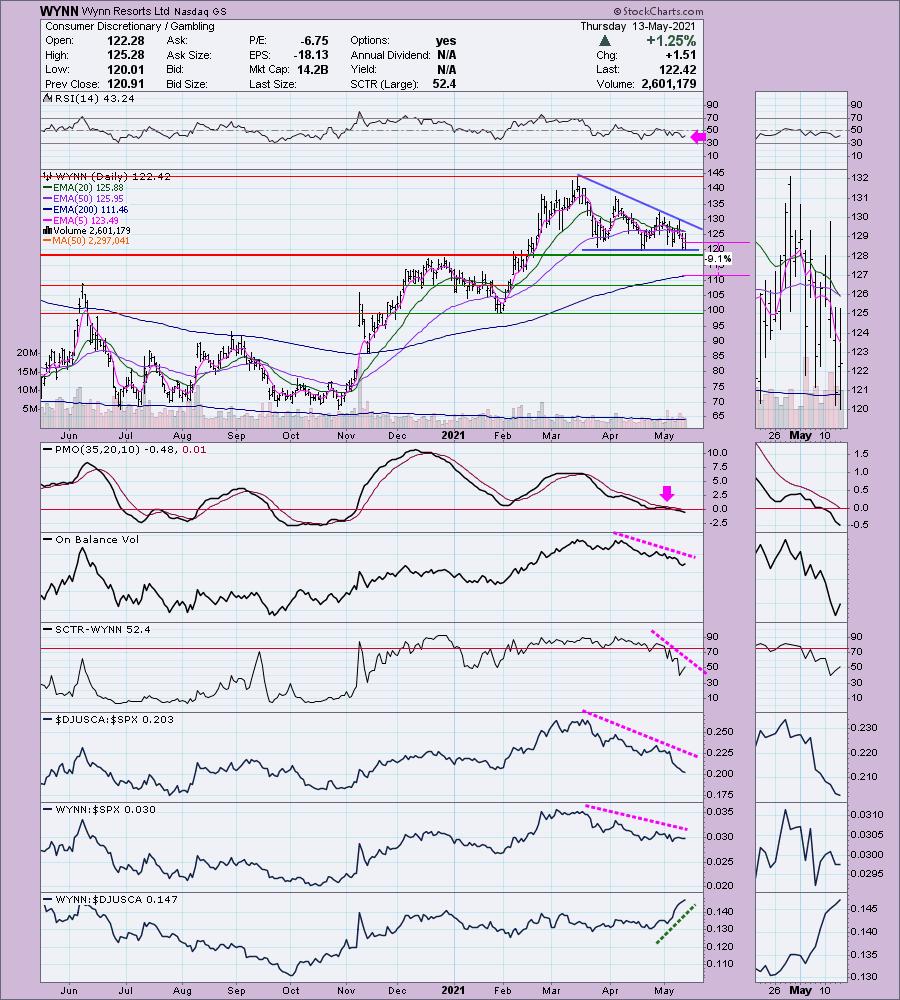
WYNN is up +0.43% in after hours trading, so Joe, I could be wrong here, but.... I see this as a very bearish chart. The one bullish characteristic in my mind is that price is sitting on support. However, this support forms the bottom of a descending triangle--a bearish formation that suggests a breakdown below support here. The minimum downside target can be calculated by taking the length of the back of the triangle. This would put the minimum downside target around $100 which aligns with the 2021 low. The RSI is negative and not oversold. The PMO topped beneath the signal line and has now moved below the zero line. The OBV is confirming this decline. Performance is weak all the way around from the industry group to the stock against the SPX. You'll note that it is clearly outperforming its industry group...basically it isn't falling as fast. If this is your cup of tea, I have listed a stop at the 200-EMA ($111.46).
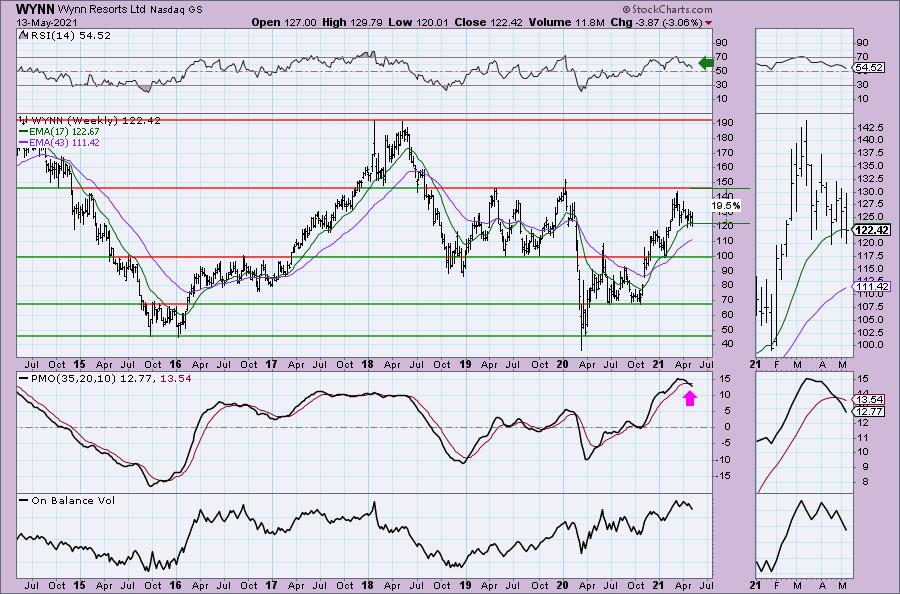
The weekly RSI is positive, but falling. The weekly PMO just triggered a crossover SELL signal. I'm not a fan.
Don't forget, on Thursdays I look at reader-requested symbols, so shoot me an email at erin@decisionpoint.com. I read every email I receive and try to answer them all!
Current Market Outlook:
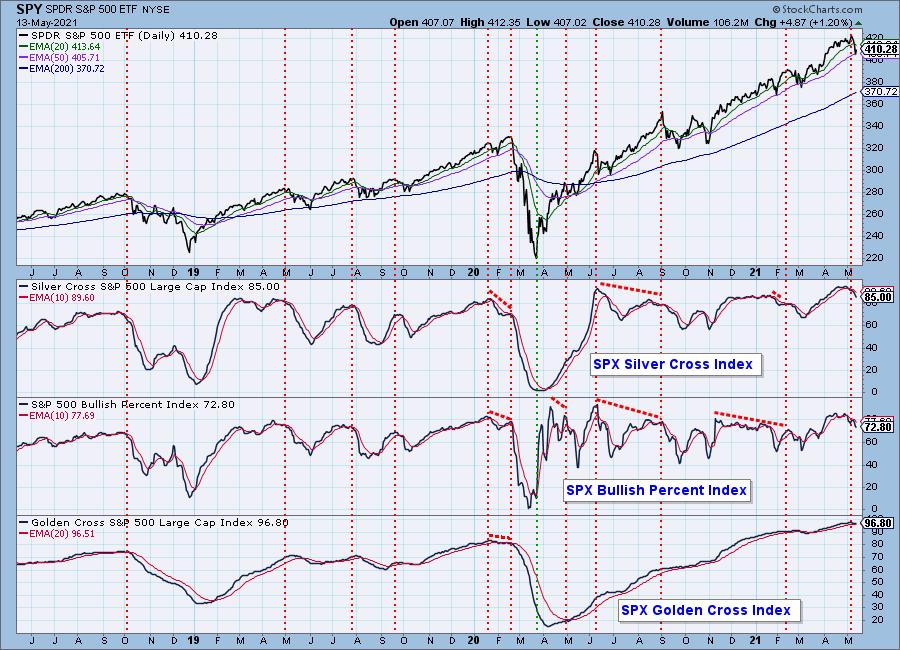
Market Environment: It is important to consider the odds for success by assessing the market tides. The following chart uses different methodologies for objectively showing the depth and trend of participation for intermediate- and long-term time frames.
- The Silver Cross Index (SCI) shows the percentage of SPX stocks on IT Trend Model BUY signals (20-EMA > 50-EMA)
- The Golden Cross Index (GCI) shows the percentage of SPX stocks on LT Trend Model BUY signals (50-EMA > 200-EMA)
- The Bullish Percent Index (BPI) shows the percentage of SPX stocks on Point & Figure BUY signals.
Don't forget that as a "Diamonds" member, you have access to our GCI/SCI curated ChartList on DecisionPoint.com. You'll find it under "Members Only" links on the left side on the Blogs and Links Page.
Here is the current chart:
Diamond Index:
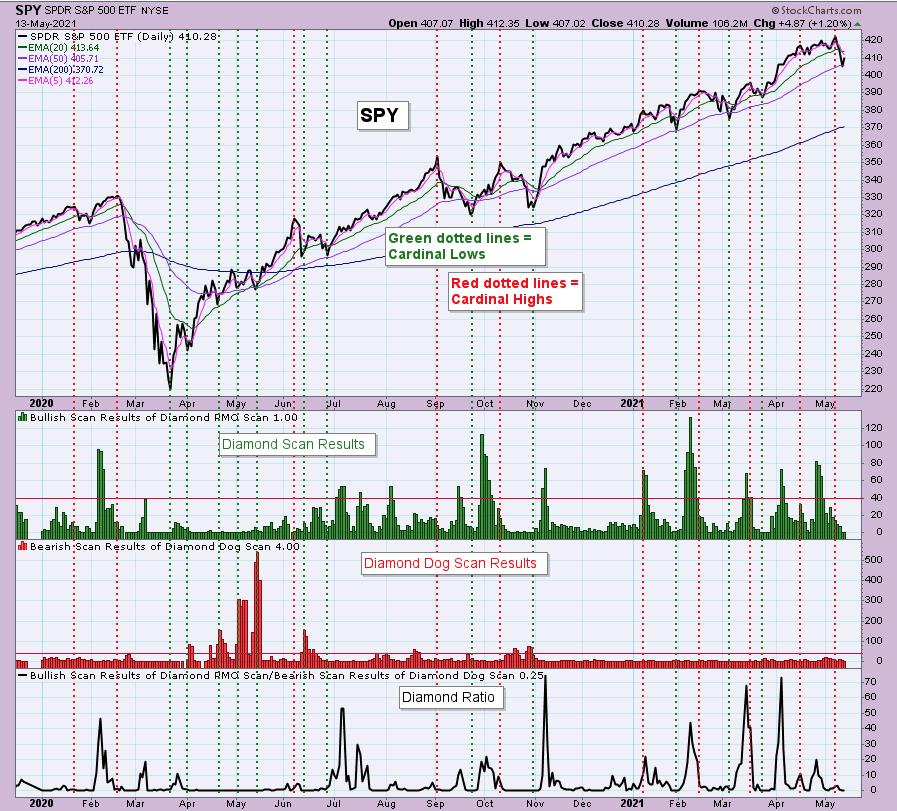
The Diamond Index chart looks at the number of scan results from my bullish Diamond PMO Scan and the number of scan results from the inverse Diamond Dog Scan. The Diamond Ratio divides the bullish results by the bearish results.
I only have data going back to October 2019 so I won't make any sweeping conclusions about the Diamond Index chart. I have marked cardinal tops with red dotted vertical lines and cardinal price bottoms with green dotted vertical lines. I believe that when the Diamond Dog results spike, it usually comes at a price bottom, or marks a strong continuation of the rising trend.
Unfortunately, the Diamond PMO Scan result numbers aren't providing much insight. The Diamond Ratio has promise, but again I don't see a clear correlation to the market tops/bottoms right now. I need to study and manipulate the data some more. Keep you posted!
Full Disclosure: I'm about 60% invested and 40% is in 'cash', meaning in money markets and readily available to trade with.
Technical Analysis is a windsock, not a crystal ball.
Happy Charting!
- Erin
erin@decisionpoint.com
Watch the latest episode of DecisionPoint with Carl & Erin Swenlin on Mondays 7:00p EST or on the DecisionPoint playlist on the StockCharts TV YouTube channel here!
NOTE: The stocks reported herein are from mechanical trading model scans that are based upon moving average relationships, momentum and volume. DecisionPoint analysis is then applied to get five selections from the scans. The selections given should prompt readers to do a chart review using their own analysis process. This letter is not a call for a specific action to buy, sell or short any of the stocks provided. There are NO sure things or guaranteed returns on the daily selection of "diamonds in the rough."
Helpful DecisionPoint Links:
DecisionPoint Shared ChartList and DecisionPoint Chart Gallery
Price Momentum Oscillator (PMO)
Swenlin Trading Oscillators (STO-B and STO-V)
For more links, go to DecisionPoint.com!
