
The market logged a new all-time high today with Technology and Consumer Discretionary leading the way. It appears these aggressive sectors are waking up again and could push the market even higher. With that in mind, I have two technology and one discretionary "diamonds in the rough".
Building Materials didn't do so hot today so two of our "diamonds in the rough" yesterday took a hit. I still like the group, especially when I see Materials like Steel and Concrete rallying strongly. I decided to include the Steel ETF (SLX) as a "diamond in the rough" today.
We've been waiting for it and it does appear that Renewable Energy is ready to recapture its all-time highs again. I've included the ETF, TAN as my choice in this area, but as you know I have Sunpower (SPWR) rather than the ETF, although I am considering repurchasing to get more exposure to this group. I would expect the other Solar stocks to outperform as well.
IMPORTANT NOTE: Friday is a market holiday so I will be skipping the Diamonds Recap on Friday. Since I have already set the date and time for the Diamond Mine, I'll plan on being there Friday morning so we can still investigate some symbols, sectors and industry groups to prepare us for next week.
Today's "Diamonds in the Rough" are: FLIR, HRB, KEYS, SLX and TAN.
 Diamond Mine REGISTRATION Information:
When: Apr 2, 2021 09:00 AM Pacific Time (US and Canada)
Topic: DecisionPoint Diamond Mine (04/02/2021) LIVE Trading Room
Register in advance for this webinar HERE.
After registering, you will receive a confirmation email containing information about joining the webinar, including the password.
=======================================================================
Diamond Mine RECORDING Link from 3/26/2021:
Topic: DecisionPoint Diamond Mine (03/26/2021) LIVE Trading Room
Start Time : Mar 26, 2021 08:58 AM
Meeting Recording HERE.
Access Passcode: i$6DFL+U
***Click here to register for this recurring free DecisionPoint Trading Room on Mondays at Noon ET!***
+++++++++++++++++++++++++++++++++++++++++++++++++++++++++++++++++++++++++++++++
Free DP Trading Room RECORDING LINK:
Topic: DecisionPoint Trading Room
Start Time : Mar 29, 2021 08:54 AM
DP Trading Room Meeting Recording HERE.
Access Passcode: f^mTv+1?
For best results, copy and paste the access code to avoid typos.
Welcome to DecisionPoint Daily Diamonds, wherein I highlight five "diamonds in the rough." These are selected from the results of my DecisionPoint scans, which search for stocks that could benefit from the trend and condition of the market. Remember, these are not recommendations to buy or sell, but are the most interesting of the stocks that surfaced in my scans. My objective is to save you the work of the initial, tedious culling process, but you need to apply your own analysis to see if these stocks pique your interest as well. There are no guaranteed winners here!
FLIR Systems, Inc. (FLIR)
EARNINGS: 5/5/2021 (BMO)
FLIR Systems, Inc. develops technologies, which enhance perception and awareness. It design, develop, market, and distribute solutions that detect people, objects and substances that may not be perceived by human senses and improve the way people interact with the world around them. The firm operates through the Industrial Technologies and Defense Technologies segments. The Industrial Technologies segment develops and manufactures thermal and visible-spectrum imaging camera cores and components that are utilized by third parties to create thermal, industrial, and other types of imaging systems. The Defense Technologies segment involves in developing and manufacturing enhanced imaging and recognition solutions for a wide variety of military, law enforcement, public safety, and other government customers around the world for the protection of borders, troops, and public welfare. The company was founded in 1978 and is headquartered in Wilsonville, OR.
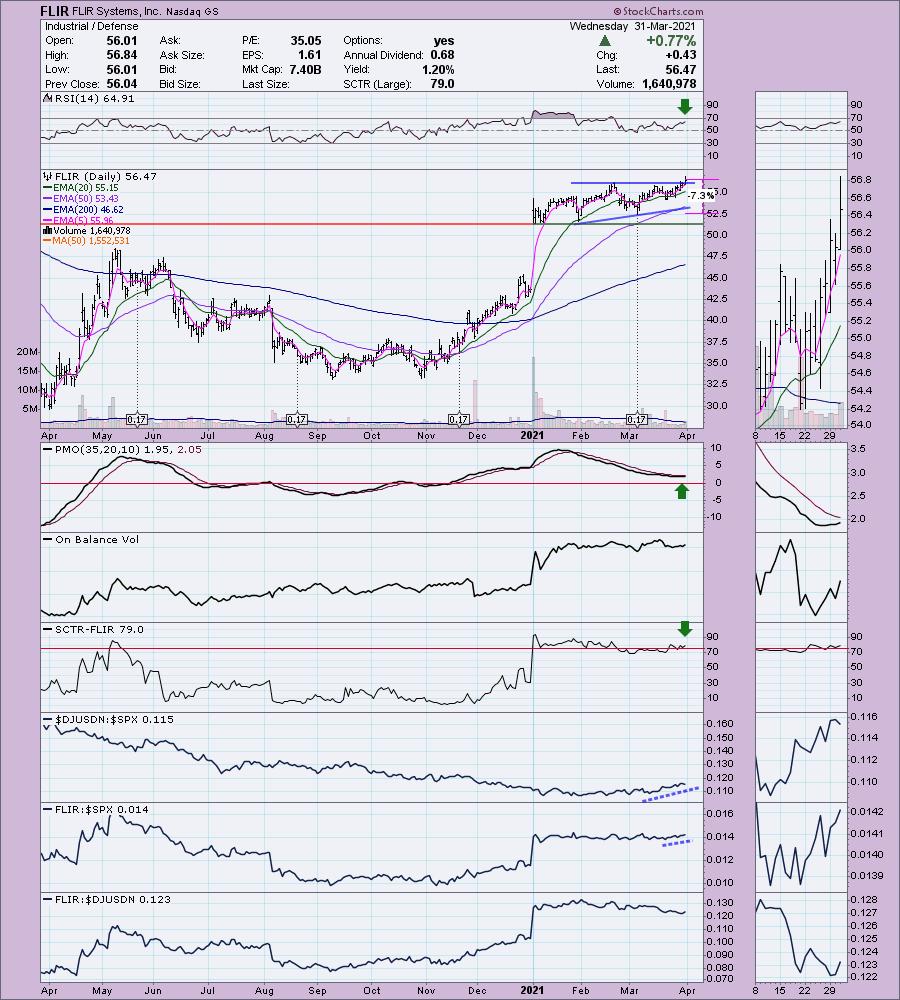
FLIR is unchanged in after hours trading. I will call out the negative on this chart right away. It has been underperforming its industry group which has been outperforming the market. On the bright side, it is beginning to outperform the SPY. I decided to take a look at the Defense industry group to see if there were any I liked better. This chart really looked the best to me. I like the new breakout from the bullish ascending triangle particularly. The PMO is going in for a crossover BUY signal above the zero line. The SCTR is above 75. I set a stop around that early March low. If you wanted to go to the next support level, that would be closer to 10%+.
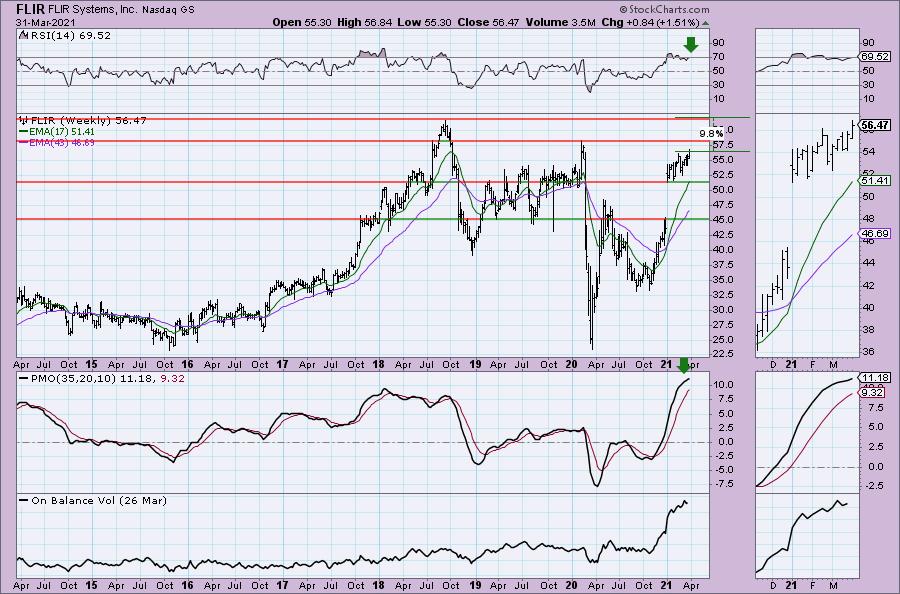
The weekly PMO is very overbought, but it is rising. The RSI is in positive, not overbought territory right now. Overhead resistance is arriving at the 2020 high, but I would look for it to make new all-time highs soon.
H & R Block, Inc. (HRB)
EARNINGS: 6/15/2021 (AMC)
H&R Block, Inc. engages in the provision of tax preparation and other services. It offers assisted and do-it-yourself tax return preparation solutions through multiple channels and distribute the H&R block-branded financial products and services, including those of its financial partners, to the general public primarily in the United States, Canada, and Australia. The company was founded by Henry W. Bloch and Richard A. Bloch on January 25, 1955 and is headquartered in Kansas City, MO.
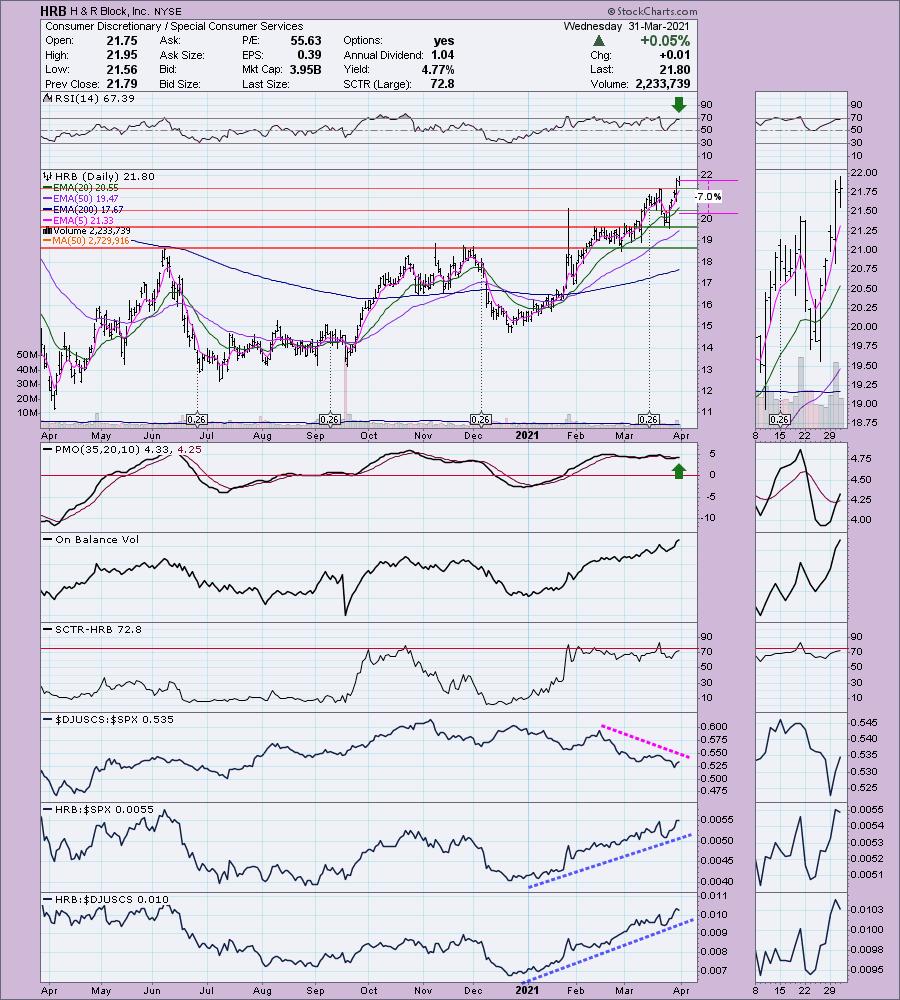
HRB is down -1.28% in after hours trading so there is a better entry than today's close possible. Not to bring up taxes, but this chart looked great. (For grins, I checked Intuit (INTU) because I use TurboTax, but that chart didn't look good). HRB broke out strongly yesterday and maintained above support today. The PMO just gave us a crossover BUY signal. The RSI is positive and not overbought. HRB has been a clear outperformer against the SPX. The industry group hasn't been doing well, but even so, HRB is outperforming the group. The stop is fairly shallow at 7%.
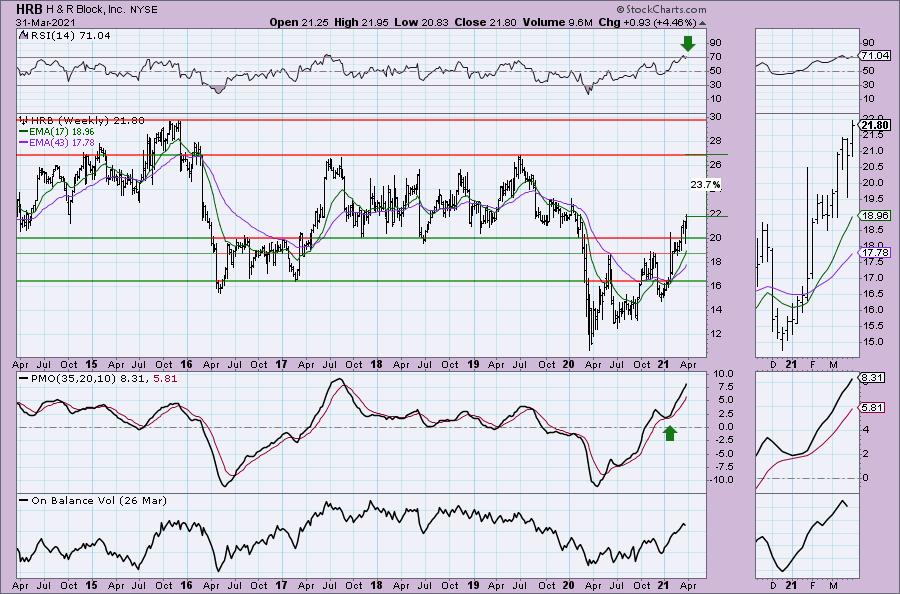
The weekly chart is very strong. The PMO, although overbought, is rising strongly. The RSI is only slightly overbought. I love that price broke back into the large trading channel from 2017-2019. A trip to the top of the channel is 23% gain and if it can breakout there and reach all-time highs, that would be an over 36% gain.
Keysight Technologies Inc. (KEYS)
EARNINGS: 5/26/2021 (AMC)
Keysight Technologies, Inc. engages in the provision of electronic design and test solutions that are used in the design, development, manufacture, installation, deployment, validation, optimization and secure operation of electronics systems to communications, networking and electronics industries. It operates through the following segments: Communications Solutions Group, and Electronic Industrial Solutions Group. The Communications Solutions Group segment serves customers spanning the worldwide commercial communications end market, which includes internet infrastructure, and the aerospace, defense and government end market. The Electronic Industrial Solutions Group segment offers test and measurement solutions across a broad set of electronic industrial end markets, focusing on high-growth applications in the automotive and energy industry and measurement solutions for semiconductor design and manufacturing, consumer electronics, education, and general electronics manufacturing. The company was founded by William R. Hewlett and David Packard in 1937 and is headquartered in Santa Rosa, CA.
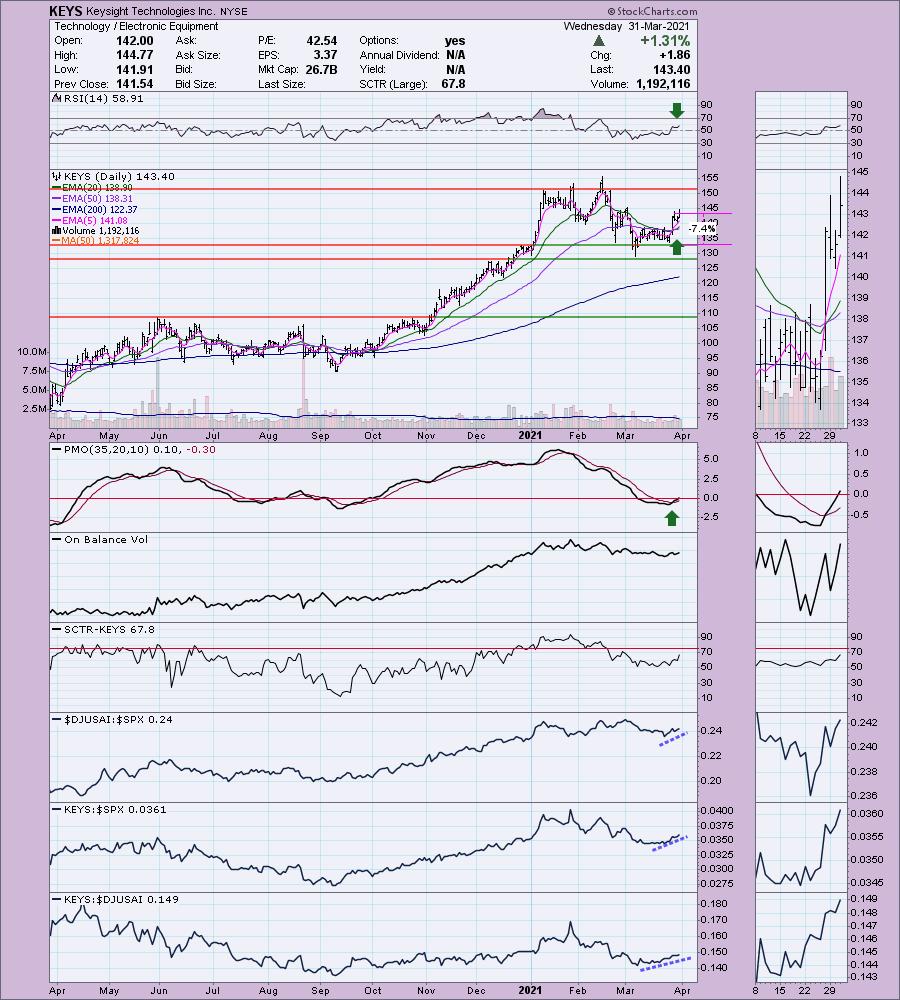
KEYS is unchanged in after hours trading. I actually brought this stock to the table during the DecisionPoint Show on Monday. I did a live scan and sort that produced KEYS as one of the strong charts. The chart still looks very good. The RSI is positive and the PMO is on a BUY signal. In fact, the PMO just reached positive territory. There is a new IT Trend Model "silver cross" BUY signal as the 20-EMA crossed above the 50-EMA. The stop is set below last week's low.
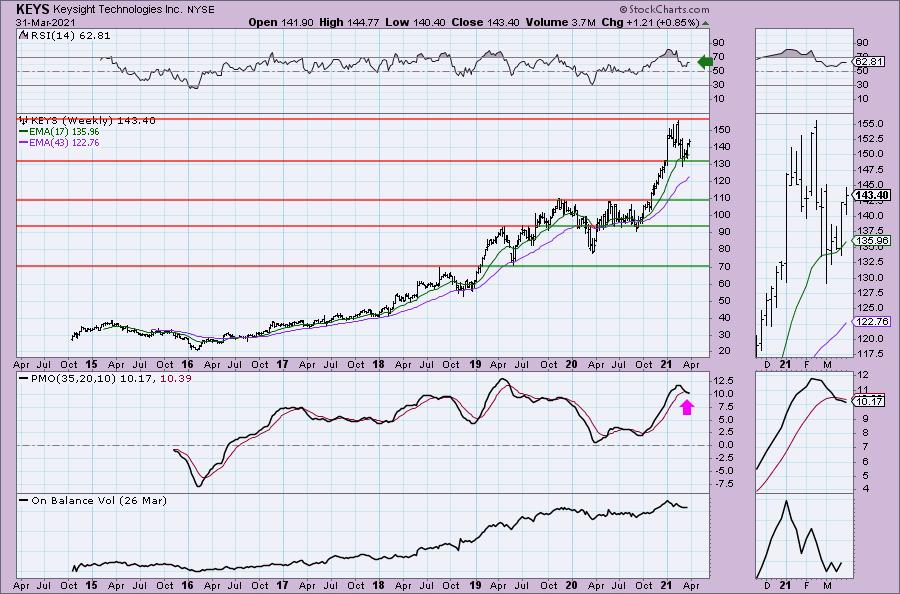
The weekly chart is okay. The PMO is on a SELL signal, but it is decelerating to possibly turn back around. The RSI is positive.
Don't forget, on Thursdays I look at reader-requested symbols, so shoot me an email at erin@decisionpoint.com. I read every email I receive and try to answer them all!
VanEck Vectors Steel ETF (SLX)
EARNINGS: N/A
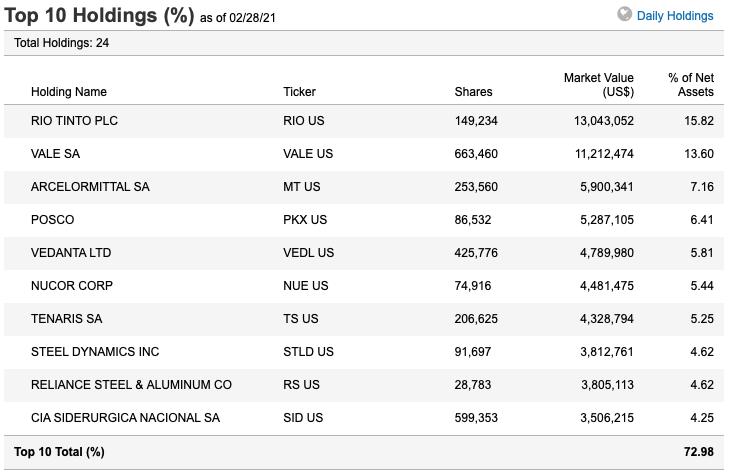
SLX tracks a market-cap-weighted index of global steel firms.
Top Ten Holdings per their website:
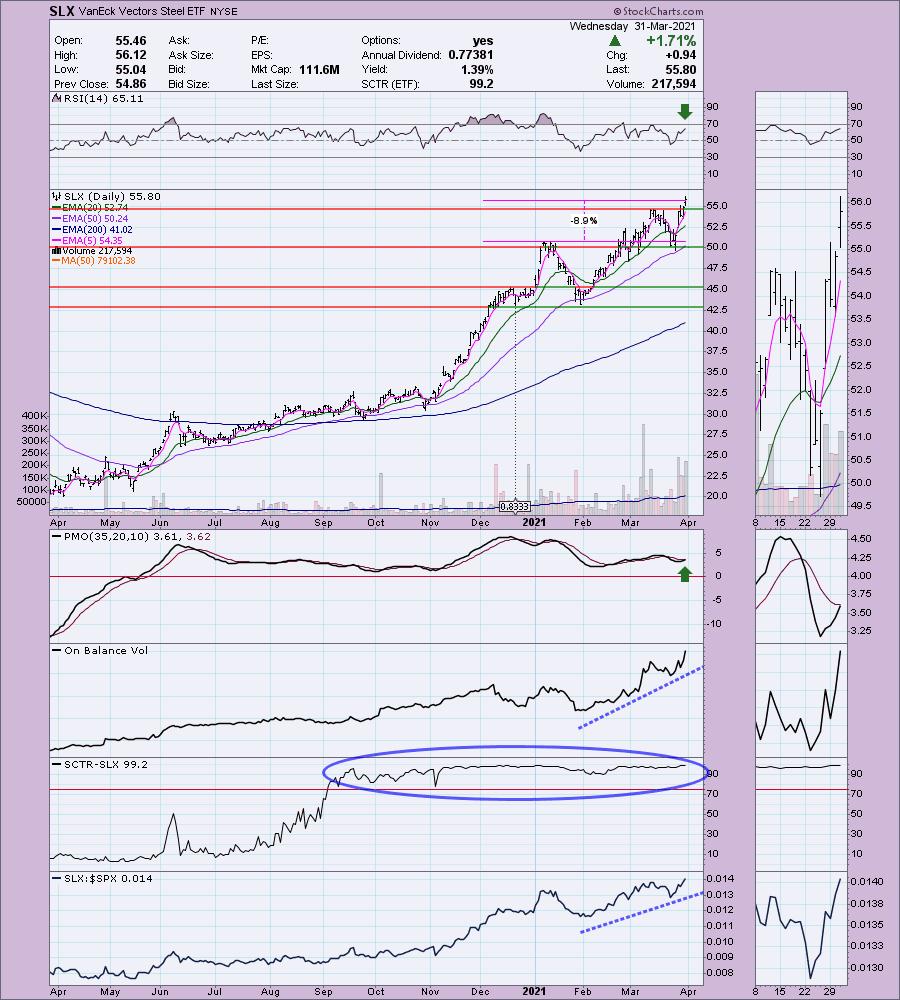
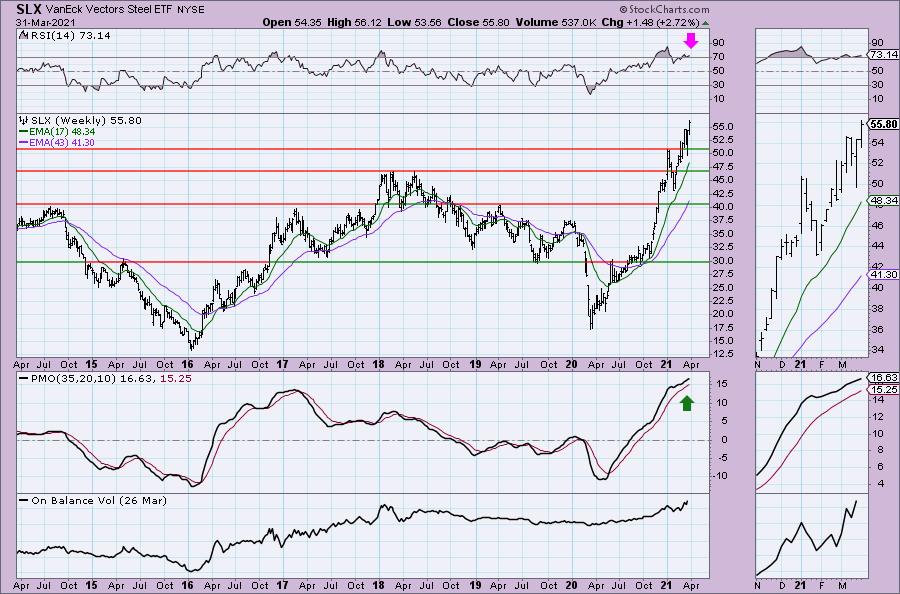
SLX is down -1.43% in after hours trading, so a better entry is likely. The PMO is just about to give us a crossover BUY signal and the RSI is seated well within positive territory above net neutral (50). The OBV is rising strongly suggesting investors are still very interested in it. The SCTR has been in the "hot zone" above 75 for many months. It continues to be a clear outperformer. The stop is set at the January top.
The weekly chart looks good minus the overbought RSI, but it isn't as overbought as we've seen it.
Invesco Solar ETF (TAN)
EARNINGS: N/A
TAN tracks an index of global solar energy companies selected based on the revenue generated from solar related business.
Top Ten Holdings from their website:
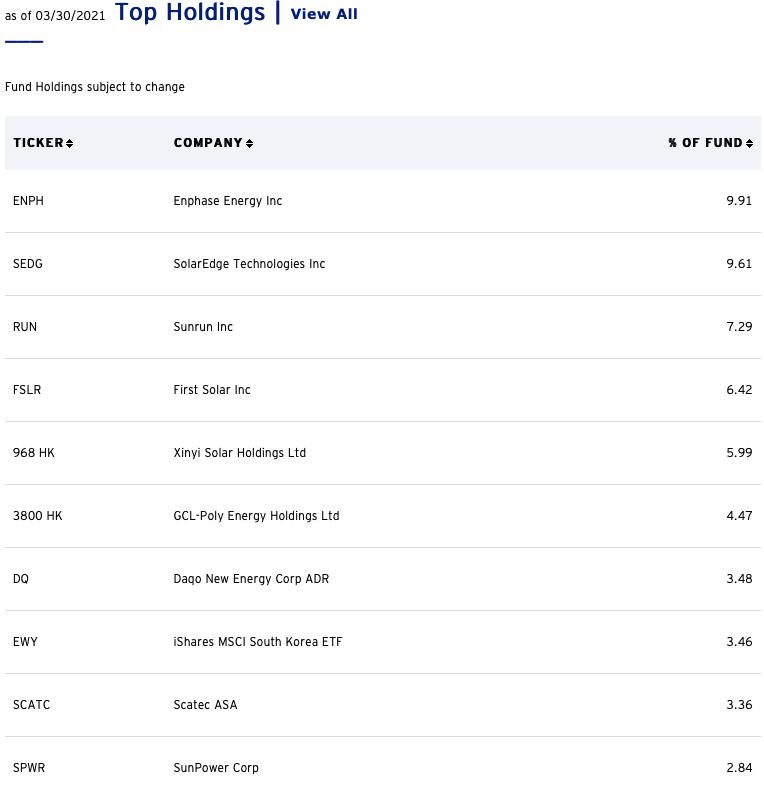
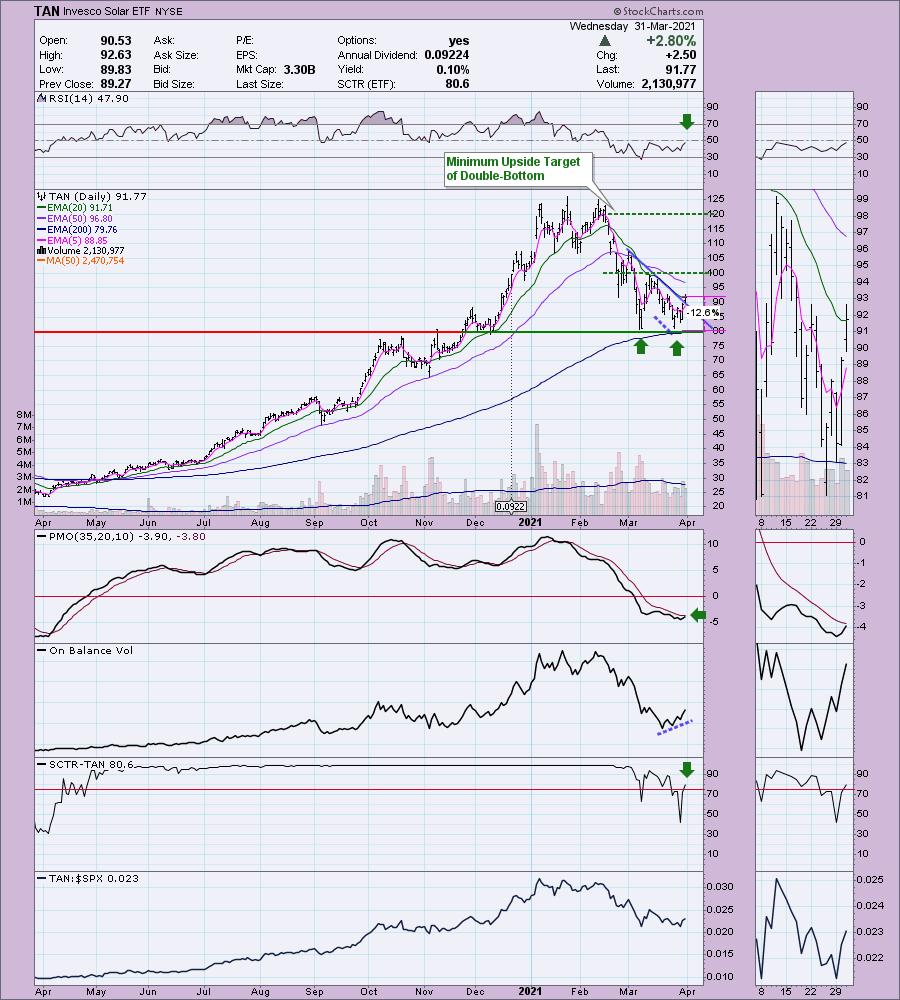
TAN is up +0.52% in after hours trading. The top ten holdings are above if you're interested in buying a particular renewable energy company. We have a double-bottom developing (it isn't an actual double-bottom until it crosses above the confirmation line) and today was a breakout from the recent declining trend. The minimum upside target for the double-bottom would bring price to $120. There is a nice looking positive OBV divergence, price finally closed above the 20-EMA. The PMO has faked us out before, but this is the thinnest margin we've seen with the signal line--it's ready to finally give us a crossover BUY signal. The SCTR just entered the "hot zone" above 75 which indicates it is in the upper quartile of all ETFs as far as internal strength. The stop is very deep, more than I usually like, but we know with this group, the moves can be significant in just one day. Protect yourself by position sizing to reflect this.
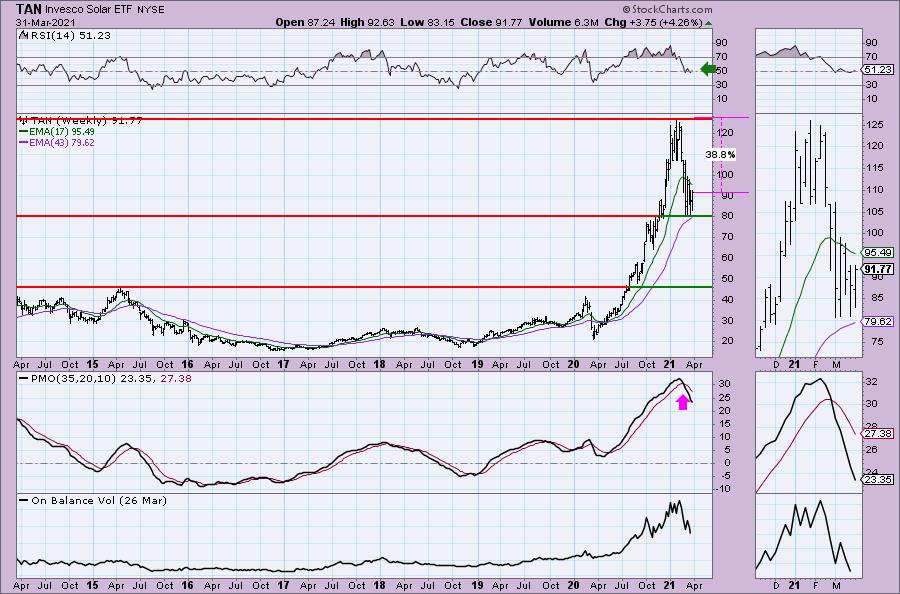
The weekly PMO is terrible but of course it would be. It is balanced out by a positive RSI.
Full Disclosure: I'm about 45% invested and 55% is in 'cash', meaning in money markets and readily available to trade with.
Current Market Outlook:
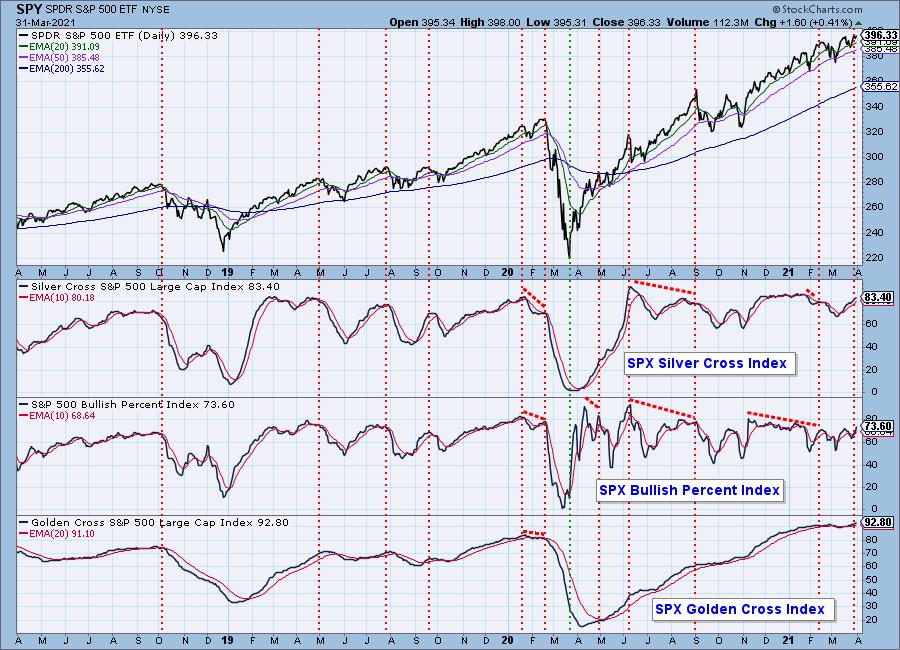
Market Environment: It is important to consider the odds for success by assessing the market tides. The following chart uses different methodologies for objectively showing the depth and trend of participation for intermediate- and long-term time frames.
- The Silver Cross Index (SCI) shows the percentage of SPX stocks on IT Trend Model BUY signals (20-EMA > 50-EMA)
- The Golden Cross Index (GCI) shows the percentage of SPX stocks on LT Trend Model BUY signals (50-EMA > 200-EMA)
- The Bullish Percent Index (BPI) shows the percentage of SPX stocks on Point & Figure BUY signals.
Don't forget that as a "Diamonds" member, you have access to our GCI/SCI curated ChartList on DecisionPoint.com. You'll find it under "Members Only" links on the left side on the Blogs and Links Page.
Here is the current chart:
Diamond Index:
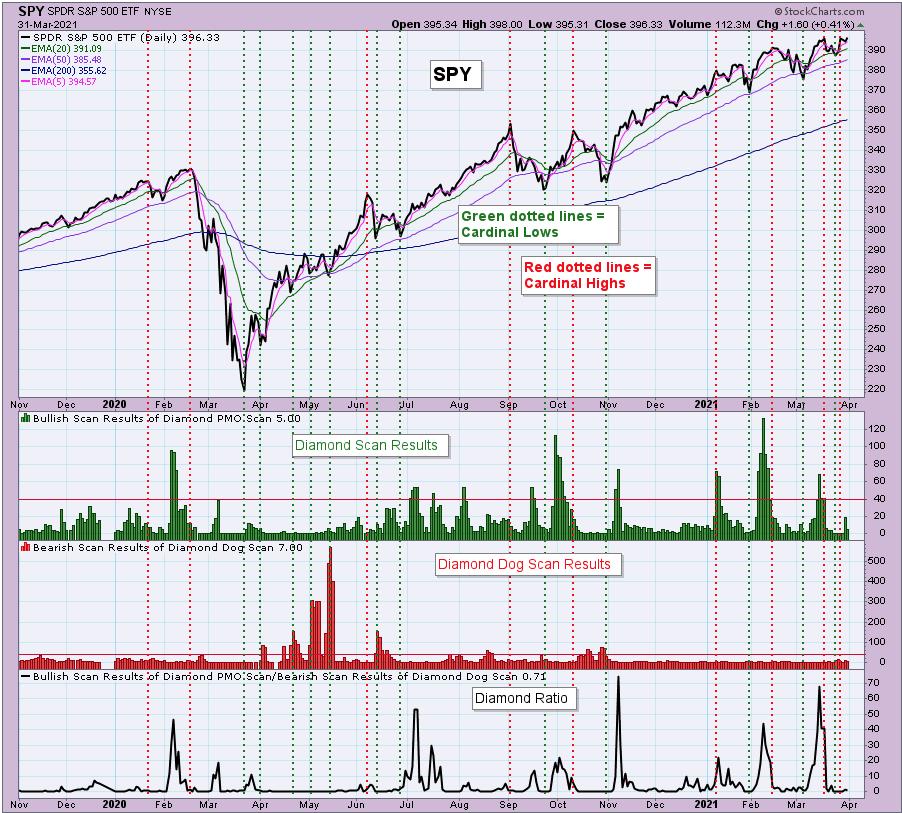
The Diamond Index chart looks at the number of scan results from my bullish Diamond PMO Scan and the number of scan results from the inverse Diamond Dog Scan. The Diamond Ratio divides the bullish results by the bearish results.
I only have data going back to October 2019 so I won't make any sweeping conclusions about the Diamond Index chart. I have marked cardinal tops with red dotted vertical lines and cardinal price bottoms with green dotted vertical lines. I believe that when the Diamond Dog results spike, it usually comes at a price bottom, or marks a strong continuation of the rising trend.
Unfortunately, the Diamond PMO Scan result numbers aren't providing much insight. The Diamond Ratio has promise, but again I don't see a clear correlation to the market tops/bottoms right now. I need to study and manipulate the data some more. Keep you posted!
Technical Analysis is a windsock, not a crystal ball.
Happy Charting!
- Erin
erin@decisionpoint.com
Watch the latest episode of DecisionPoint with Carl & Erin Swenlin on Mondays 7:00p EST or on the DecisionPoint playlist on the StockCharts TV YouTube channel here!
NOTE: The stocks reported herein are from mechanical trading model scans that are based upon moving average relationships, momentum and volume. DecisionPoint analysis is then applied to get five selections from the scans. The selections given should prompt readers to do a chart review using their own analysis process. This letter is not a call for a specific action to buy, sell or short any of the stocks provided. There are NO sure things or guaranteed returns on the daily selection of "diamonds in the rough."
Helpful DecisionPoint Links:
DecisionPoint Shared ChartList and DecisionPoint Chart Gallery
Price Momentum Oscillator (PMO)
Swenlin Trading Oscillators (STO-B and STO-V)
For more links, go to DecisionPoint.com!
