
It took me some time to find my choice for the day so I'm thankful there were some great Reader Requests. I've been eyeing a few of them myself.
I nearly picked the Solar ETF (TAN) or Tesla (TSLA) as my pick. They have made excellent turnarounds on important support, but they got hung up on overhead resistance at the 20-EMA. Additionally, both will likely see a pullback given they've hit resistance. That shouldn't stop you from at least checking these charts out. There's a high likelihood that I will be reentering TAN by Monday.
My pick today comes from the Consumer Discretionary (XLY) sector. The sector chart is perking up. I'll show you tomorrow in the Diamond Mine. Speaking of which...register here right now!
Today's "Diamonds in the Rough" are: DAR, HEES, KAR, RAD and SXC.
** Everyone needs a vacation and I am no exception. I've planned a mini vacation to local wine country mid-week 3/23 through 3/25. The DecisionPoint Alert will be published, but I'll be taking the week off for Diamonds with the exception of the 3/26 Diamond Mine. I need to fit wine tasting in somehow! To compensate you for that week, I am adding a week to the end of all Diamond and Bundle subscribers' terms when I return, because who knows, I may end up writing a report or two. **
 Diamond Mine Registration Information:
When: Mar 19, 2021 09:00 AM Pacific Time (US and Canada)
Topic: DecisionPoint Diamond Mine (03/19/2021) LIVE Trading Room
Register in advance for this webinar at this REGISTRATION LINK.
After registering, you will receive a confirmation email containing information about joining the webinar, including the password.
=======================================================================
Recording Link:
Topic: DecisionPoint Diamond Mine (3/5/2021) LIVE Trading Room
Start Time : Mar 5, 2021 08:55 AM
Meeting RECORDING LINK.
Access Passcode: 2*cm7yhJ
***Click here to register for this recurring free DecisionPoint Trading Room on Mondays at Noon ET!***
+++++++++++++++++++++++++++++++++++++++++++++++++++++++++++++++++++++++++++++++
Free DP Trading Room RECORDING LINK:
Topic: DecisionPoint Trading Room
Start Time : Mar 8, 2021 09:00 AM PT
Free Trading Room RECORDING LINK.
Access Passcode: G@W.$M5B
For best results, copy and paste the access code to avoid typos.
Welcome to DecisionPoint Daily Diamonds, wherein I highlight five "diamonds in the rough." These are selected from the results of my DecisionPoint scans, which search for stocks that could benefit from the trend and condition of the market. Remember, these are not recommendations to buy or sell, but are the most interesting of the stocks that surfaced in my scans. My objective is to save you the work of the initial, tedious culling process, but you need to apply your own analysis to see if these stocks pique your interest as well. There are no guaranteed winners here!
Darling Ingredients Inc. (DAR)
EARNINGS: 5/5/2021 (AMC)
Darling Ingredients, Inc. engages in the development and production of natural ingredients from edible and inedible bio-nutrients. It operates through the following segments: Feed Ingredients, Food Ingredients and Fuel Ingredients. The Feed Ingredients segment includes ingredients business such as fats and proteins used cooking oil, trap grease and food residuals collection, the Rothsay ingredients, and the ingredients and specialty products. The Food Ingredients segment comprises gelatin, natural casings and meat by-products, and specialty products activities. The Fuel Ingredients segment consists of biofuel and bioenergy services. The company was founded in 1882 and is headquartered in Irving, TX.
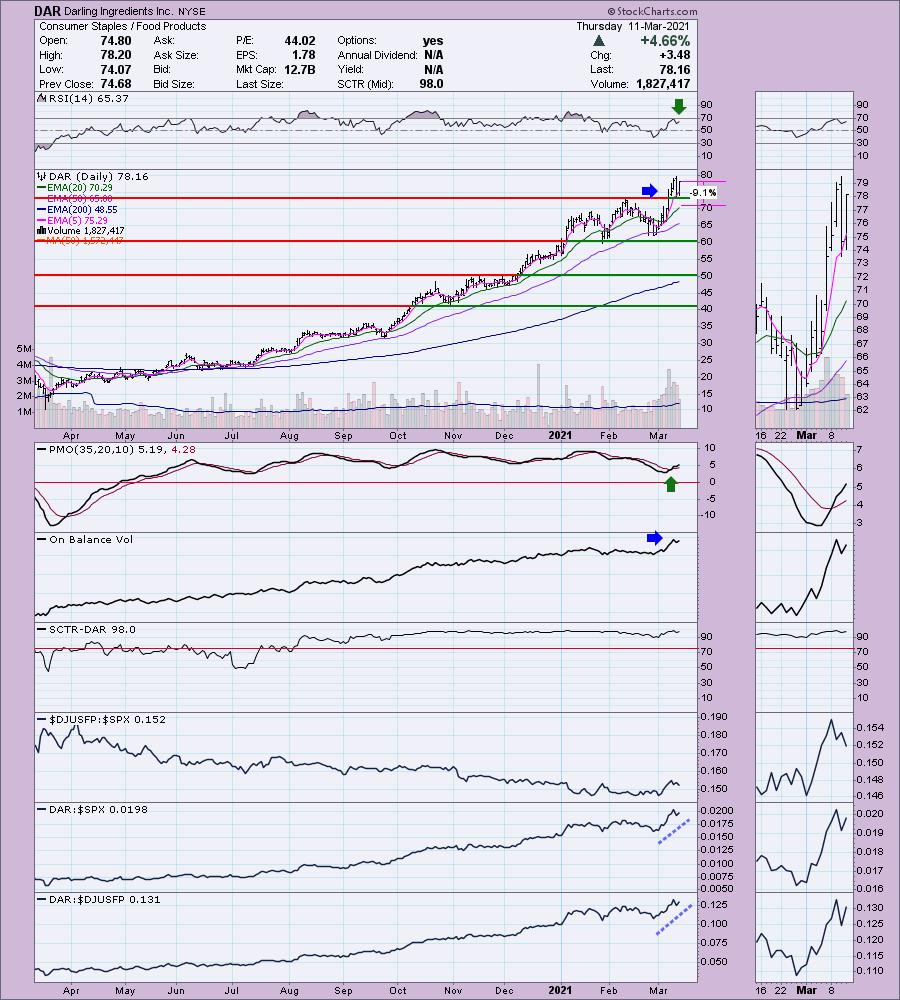
Reader Request #1: DAR is down -2.69% in after hours trading. Looks like a better entry can be had as its current price is $76.06 in after hours which still has price above important support. There's a new PMO BUY signal that arrived on the breakout above previous overhead resistance. The RSI is positive. The OBV made a new high on that breakout which is also bullish. It's a clear out-performer. I've set a 9% stop that would take price back into the prior trading range. Watch for it to hold the 20-EMA, if it doesn't I'd cut your losses.
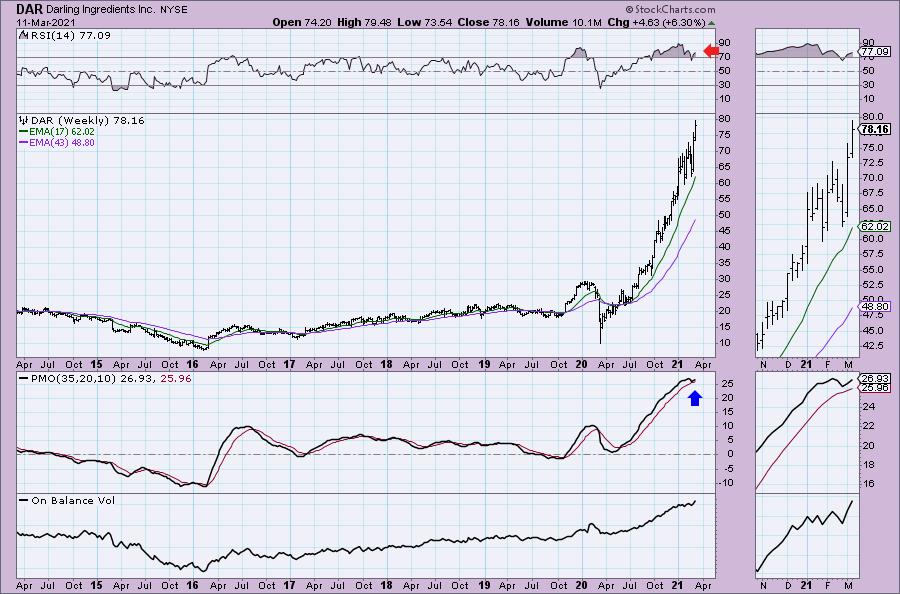
The RSI on the weekly chart is very overbought, but it was more overbought previously so that's helpful. The best part of this chart is the PMO bottom above the signal line. For a Consumer Staple stock this one has been killing it!
H&E Equipment Services Inc. (HEES)
EARNINGS: 5/7/2021 (BMO)
H&E Equipment Services, Inc. engages in the provision of equipment services which focused on heavy construction and industrial equipment. It operates through the following segments: Equipment Rentals, New Equipment Sales, Used Equipment Sales, Parts Sales, and Services. The Equipment Rentals segment rents construction and industrial equipment. The New Equipment Sales segment sells new equipment in product categories. The Used Equipment Sales segment offers rental fleet and inventoried equipment that are acquired through trade-ins its equipment customers and through purchases of high quality used equipment. The Parts Sales segment consists of new and used parts for the equipment and rental fleet. The Services segment operation provides maintenance and repair services for customers equipment and to rental fleet. The company was founded by Tom Engquist and Frank Head in 1961 and is headquartered in Baton Rouge, LA.
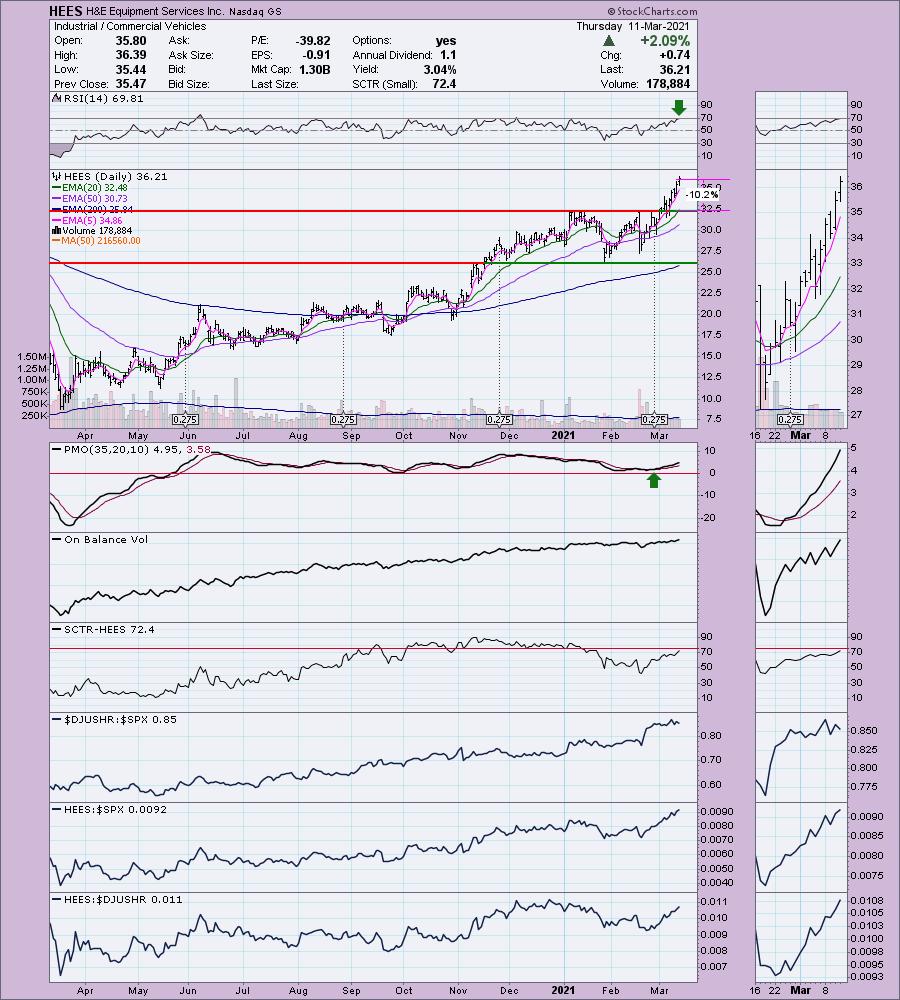
Reader Request #2: HEES is unchanged in after hours trading. This one is on fire. That has pushed the RSI very close to overbought territory. However, the PMO is still rising on a BUY signal and is not overbought. It's been a strong performer against its group and the SPX. The stop is deep based on support. It wouldn't be necessary to ride it all the way down. Given it is overbought and may pullback soon, you may want a deeper stop.
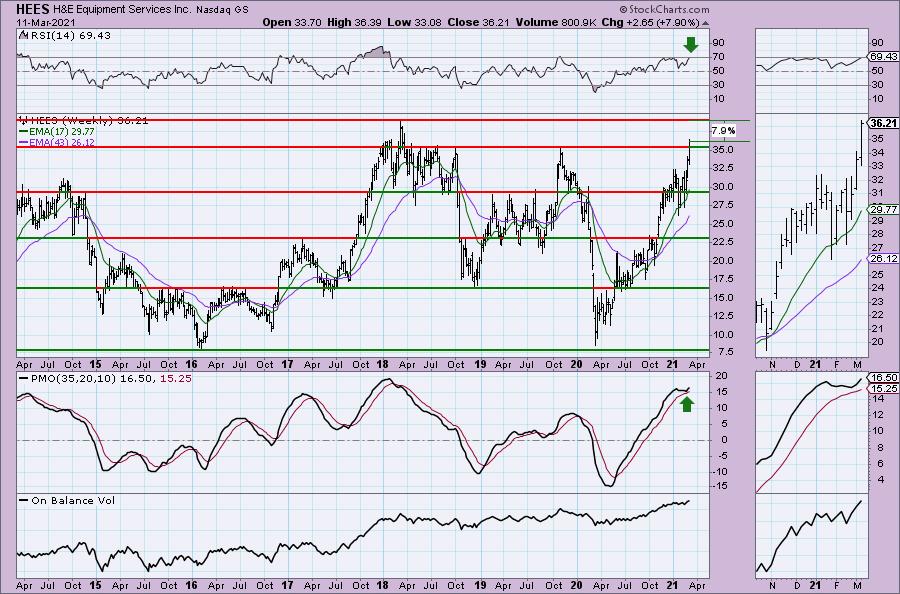
The weekly chart has a bullish PMO bottom above the signal line and the RSI is positive and not yet overbought. Best of all it has broken above strong overhead resistance at the 2019 top. Granted a trip to the 2018 top would only be a gain of 8%, but if it continues to outperform, it should press past that level.
KAR Auction Services Inc. (KAR)
EARNINGS: 5/6/2021 (AMC)
KAR Auction Services, Inc. engages in the provision of used car auction services and salvage auction services in North America and the United Kingdom. It operates through the following segments: ADESA Auctions and Automotive Finance Corporation (AFC). The ADESA segment provides whole car auctions and related services to the vehicle remarketing industry in North America. The AFC segment provides floor plan financing to used vehicle dealers. The company was founded on November 9, 2006 and is headquartered in Carmel, IN.
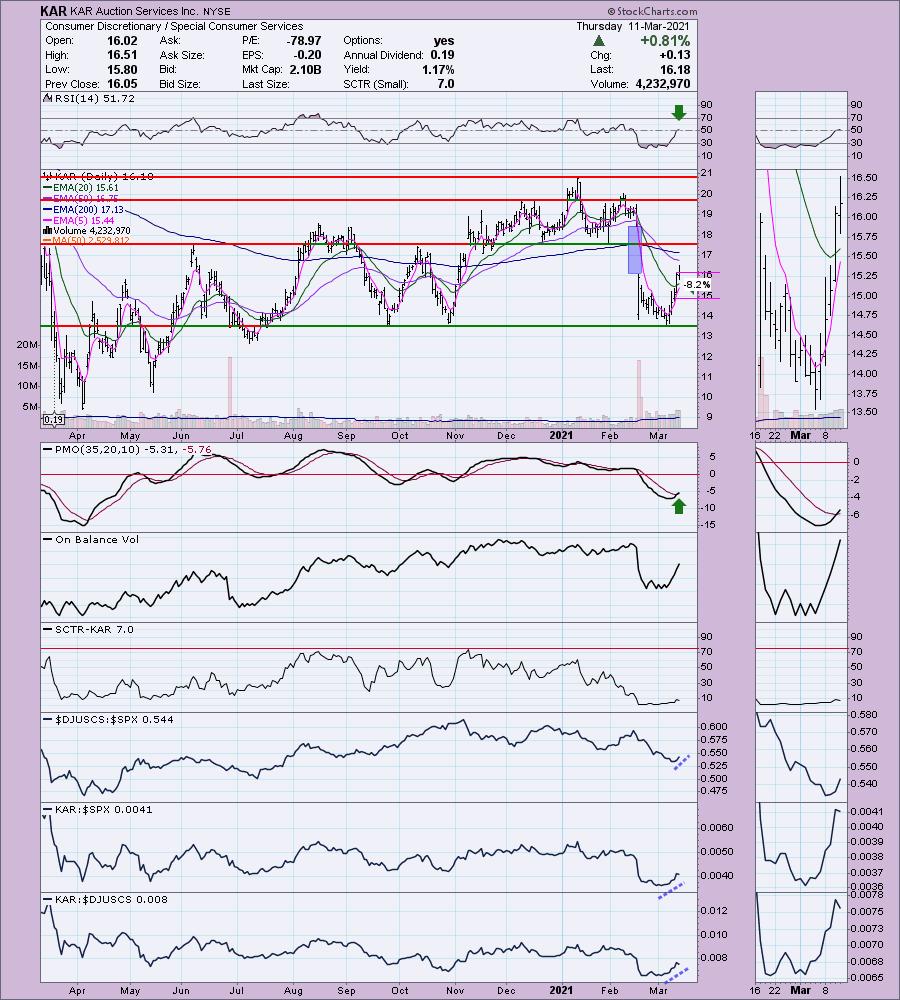
This is my "beat down" selection. KAR is down -1.11% in after hours trading. That does put price right at the bottom of gap resistance again, but the rest of the chart is so tasty. If it can begin to cover that gap, it should make its way back to the February top. The PMO is on a crossover BUY signal. The 5-EMA is about to cross above the 20-EMA which would be a ST Trend Model BUY signal. Like the Consumer Discretionary sector, I see the group is beginning to wake up when compared to the SPX. This one has already been outperforming the SPX. The RSI just hit positive territory. If I were timing my entry on a 5-minute candlestick chart, this would be the entry as the PMO just had a positive crossover and the RSI just went positive. The stop is somewhat arbitrary as moving it down to support would have made it 15%. Since it is beat down, I would go with my typical minimum stop level at 8%.
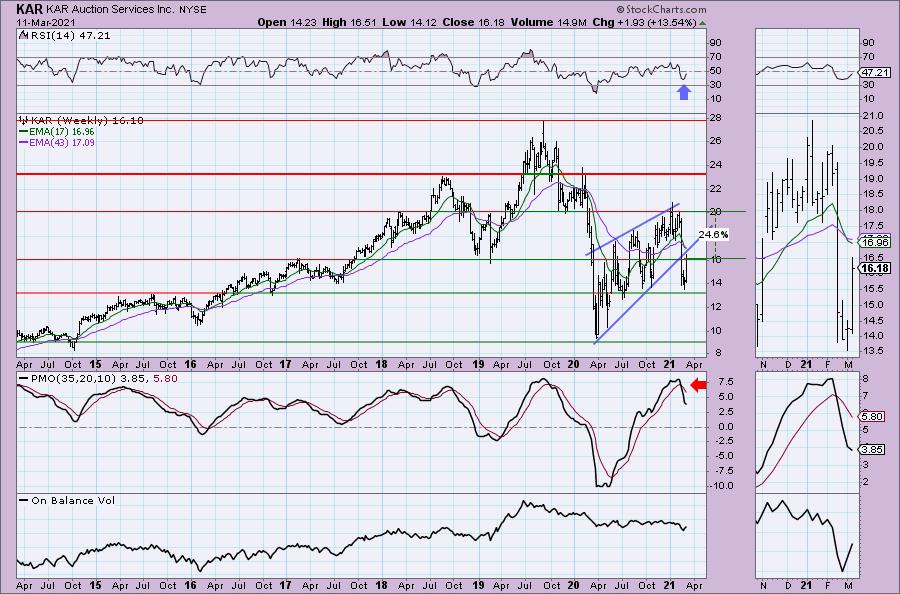
We can see that the bearish rising wedge executed last month on the hefty decline. Now it has bounced off support and has now pushed past overhead resistance at the 2019 low. The PMO is still in decline, but is trying to decelerate. I wouldn't get too greedy here. We can revisit the chart at that point and make a decision on whether it would be a good hold.
Don't forget, on Thursdays I look at reader-requested symbols, so shoot me an email at erin@decisionpoint.com. I read every email I receive and try to answer them all!
Rite Aid Corp. (RAD)
EARNINGS: 4/15/2021 (BMO)
Rite Aid Corp. engages in the ownership and management of retail drug stores. It operates through following segments: Retail Pharmacy and Pharmacy Services. The Retail Pharmacy segment includes branded and generic prescription drugs, health and beauty aids, personal care products, and walk-in retail clinics. The Pharmacy Services segment offers transparent and traditional pharmacy benefit management for insurance companies, employers, health plans, and government employee groups. The company was founded by Alex Grass on September 12, 1962 and is headquartered in Camp Hill, PA.
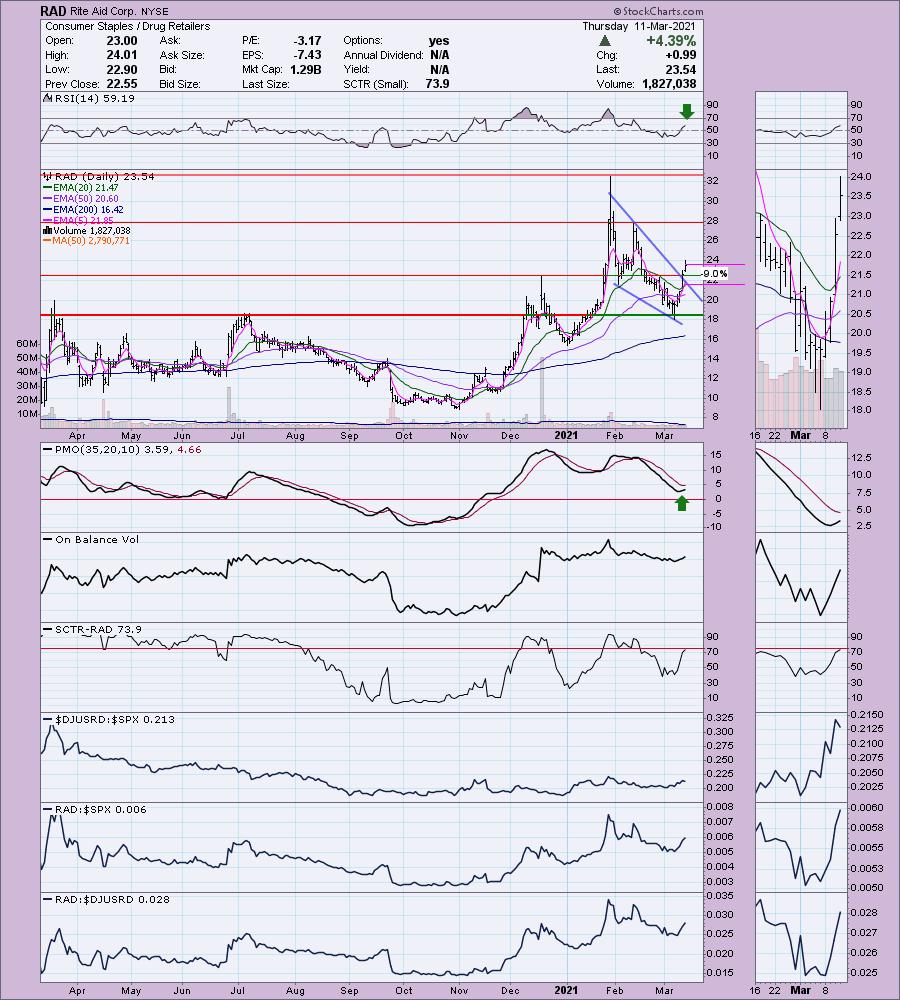
Reader Request #3: RAD is up +0.34% in after hours trading. I've covered this one multiple times in Diamonds. The April 15th 2020 Report (Timing was off by one day. 6.3% stop was hit almost immediately), June 2nd 2020 Report (Was up 53% before it back down and triggered the 9.9% stop) and again on June 25th 2020 as a reader request (It rose about 14.5% and then later triggered the stop at $14).
I have been stalking this one. Yesterday's breakout from the bullish falling wedge was impressive and today we saw more follow-through on the breakout. The PMO has turned up and the RSI is now positive. It is beginning to outperform along with its industry group. Today a new ST Trend Model BUY signal was triggered as the 5-EMA crossed above the 20-EMA. I have a 9% stop set that would put price below the 20-EMA.
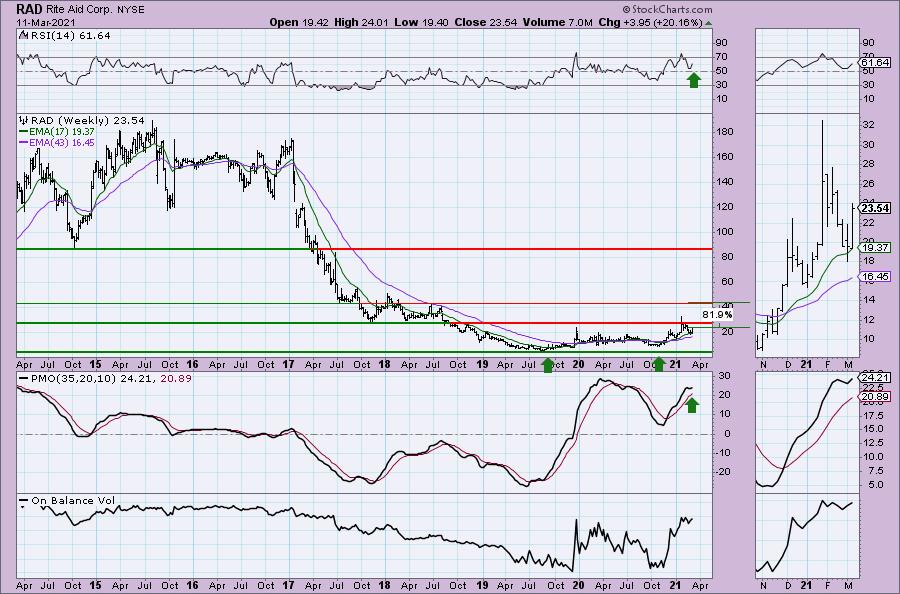
We have a long-term double-bottom. It attempted to trigger earlier this year but fell back below the confirmation line. It's holding above the 17-week EMA and the PMO has bottomed above the signal line. The RSI is positive. Upside potential is eye popping.
SunCoke Energy Inc. (SXC)
EARNINGS: 5/7/2021 (BMO)
SunCoke Energy, Inc. is engaged in the production of coke through heating metallurgical coal in a refractory oven. It operates through the following segments: Domestic Coke, Brazil Coke, and Logistics. The Domestic Coke segment consists of Jewell facility located in Vansant, Virginia; Indiana Harbor facility located in East Chicago, Indiana; Haverhill facility located in Franklin Furnace, Ohio; Granite City facility located in Granite City, Illinois; and Middletown facility located in Middletown, Ohio. The Brazil Coke segment comprises of its operations in Vitória, Brazil. The Logistics segment comprises of CMT, KRT, Lake Terminal, which provides services to Indiana Harbor cokemaking facility; and DRT, which provides services to Jewell cokemaking facility. The company was founded in December 2010 and is headquartered in Lisle, IL.
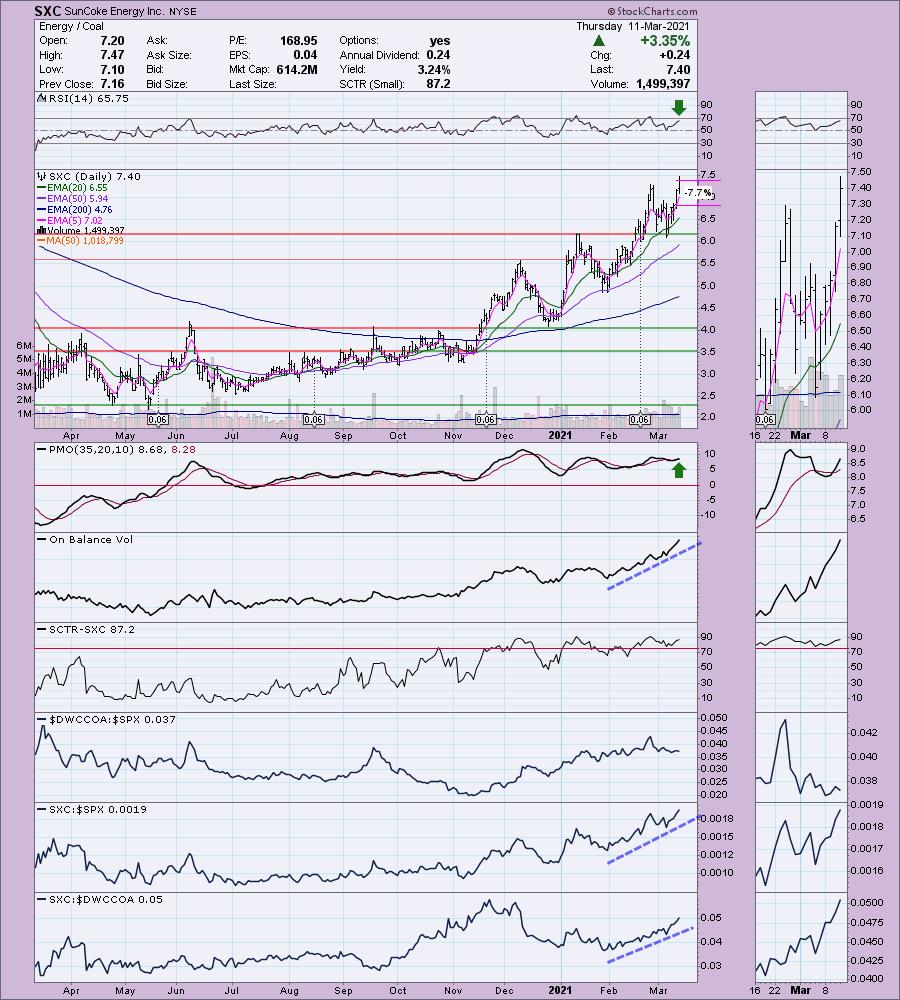
Reader Request #4: SXC is down -3.92% in after hours trading. It was due for a pullback, but I'm surprised to see it take back all of today's gain plus some. I would expect to see it continue to rally off any pullback. The PMO has triggered another crossover BUY signal and the RSI is positive. I've set a 7.7% stop, but given after hours trading, you could time a better entry and set it closer to support.
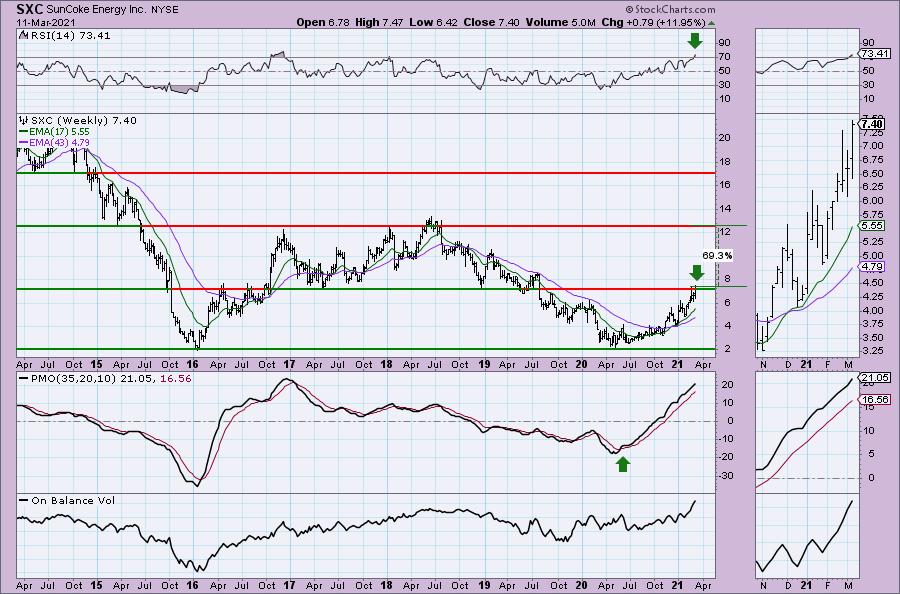
It's a strong weekly chart with a rising PMO on an oversold BUY signal. The RSI is overbought. I note very strong overhead resistance so it isn't surprising to see a pullback in after hours trading. If it can press past resistance, there is huge potential upside to this one. I also note a long-term double-bottom.
Full Disclosure: I'm about 70% invested and 30% is in 'cash', meaning in money markets and readily available to trade with.
Current Market Outlook:
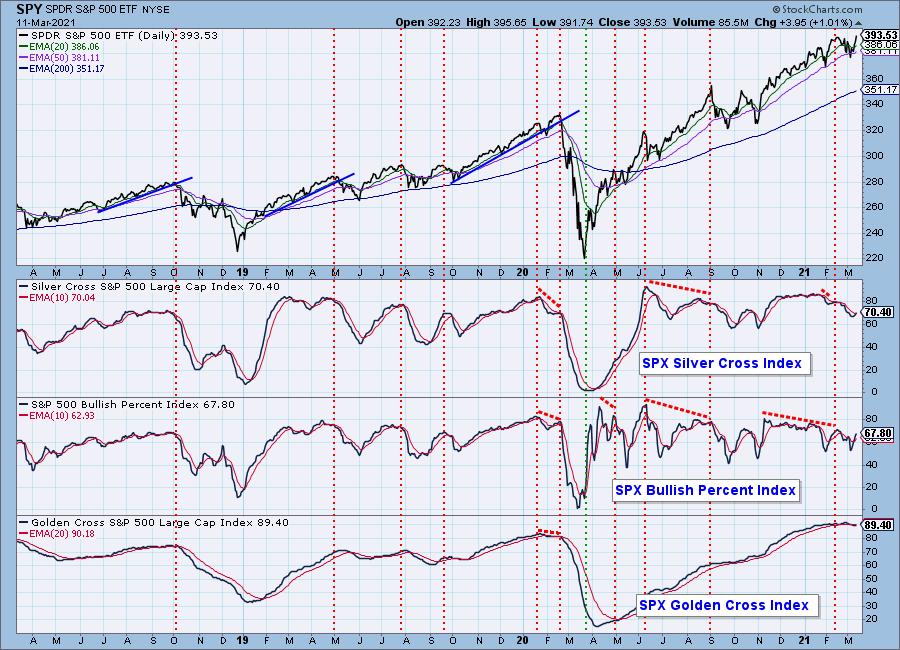
Market Environment: It is important to consider the odds for success by assessing the market tides. The following chart uses different methodologies for objectively showing the depth and trend of participation for intermediate- and long-term time frames.
- The Silver Cross Index (SCI) shows the percentage of SPX stocks on IT Trend Model BUY signals (20-EMA > 50-EMA)
- The Golden Cross Index (GCI) shows the percentage of SPX stocks on LT Trend Model BUY signals (50-EMA > 200-EMA)
- The Bullish Percent Index (BPI) shows the percentage of SPX stocks on Point & Figure BUY signals.
Don't forget that as a "Diamonds" member, you have access to our GCI/SCI curated ChartList on DecisionPoint.com. You'll find it under "Members Only" links on the left side on the Blogs and Links Page.
Here is the current chart:
Diamond Index:
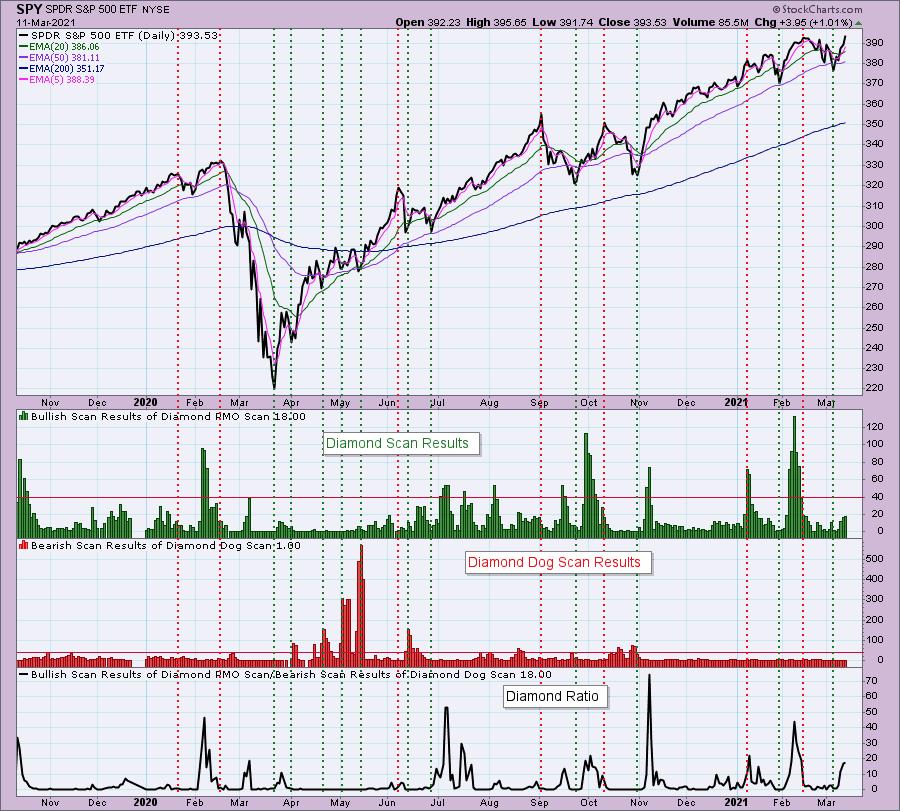
The Diamond Index chart looks at the number of scan results from my bullish Diamond PMO Scan and the number of scan results from the inverse Diamond Dog Scan. The Diamond Ratio divides the bullish results by the bearish results.
I only have data going back to October 2019 so I won't make any sweeping conclusions about the Diamond Index chart. I have marked cardinal tops with red dotted vertical lines and cardinal price bottoms with green dotted vertical lines. I believe that when the Diamond Dog results spike, it usually comes at a price bottom, or marks a strong continuation of the rising trend.
Unfortunately, the Diamond PMO Scan result numbers aren't providing much insight. The Diamond Ratio has promise, but again I don't see a clear correlation to the market tops/bottoms right now. I need to study and manipulate the data some more. Keep you posted!
Technical Analysis is a windsock, not a crystal ball.
Happy Charting!
- Erin
erin@decisionpoint.com
Watch the latest episode of DecisionPoint with Carl & Erin Swenlin on Mondays 7:00p EST or on the DecisionPoint playlist on the StockCharts TV YouTube channel here!
NOTE: The stocks reported herein are from mechanical trading model scans that are based upon moving average relationships, momentum and volume. DecisionPoint analysis is then applied to get five selections from the scans. The selections given should prompt readers to do a chart review using their own analysis process. This letter is not a call for a specific action to buy, sell or short any of the stocks provided. There are NO sure things or guaranteed returns on the daily selection of "diamonds in the rough."
Helpful DecisionPoint Links:
DecisionPoint Shared ChartList and DecisionPoint Chart Gallery
Price Momentum Oscillator (PMO)
Swenlin Trading Oscillators (STO-B and STO-V)
For more links, go to DecisionPoint.com!
